KZ SessionsThis shows killzone sessions for London NY, Asia sessions.
In addition to the opening hours of session, the pre-market and closing time periods are also marked with a grey color
Generally these are consided period of high activity and can experience more volatility in these periods
I also have enabled it to display the session times even on weekends. There is no session open at such times but heightened activity is noticed in these periods even on weekends.
If want to disable showing it on weekends, then remove ":1234567" from all the lines in code
DAY

Candle checker for long/short for scalping/day tradingHey.
This strategy is still in working.
For it I check a x amount of candles in the past if they been for example all red/green in row, and based on that I enter. For example candle 7 < candle 6 .... candle 3 < candle 2 .... candle 1 < candle current for long and viceversa for short.
After that,once the trade is initiated, I exit based on 2 possibilities : candle color is different than the color of candle when entry, or based tp/sl.
Let me know what you think of it.
I will try to make the process to calculate automatically and input the number of candles to check like 5-10-15 and so on.

Custom Time ranges. Daily price ranges.Addition to previous time range script, now containing daily ranges. You can select a day of the week, and have it show the high, low, mid, and open of that day.
For the time bands:
Monday = 2
Tuesday = 3
Wednesday = 4
Thursday = 5
Friday = 6
Saturday = 7
Sunday = 1
Example 1:
1500-1800:2
This will colour the background between 3pm and 6pm on Mondays.
Example 2:
0000-0600:247
This will colour the background between midnight and 6am on Mondays, Wednesdays, and Saturdays.
For the Daily price ranges:
Just select the tick-box forthe day, and then the price levels you'd like to see.
I want to add specific weekly levels to this, for example: week 06 of year 2020, but I've not figured out how to do it yet. If anyone knows, I'd appreciate it if you let me know. I'll then update this script.
As always, any questions you may have, please leave in comments below and I'll respond when I have time.
If you notice anything good with this indicator, let me know. We are all in this to make money after all! ;)

Day of week, Forex FixCalendar to work on instruments that trade a 24 hour day like crypto and forex, also does not display if you are above an intraday time. Main tweak was to end the trading day at 0000 (midnight) instead of 1700 (5pm) NYC time.
This update is geared towards Forex traders, which is why I chose to highlight Wednesday in yellow since that is commonly thought of as a midweek reversal point.
@airscape built a good calendar indicator based on the work of @ChrisMoody, this is really an update to their work and directed towards FX and Crypto
airscape:
ChrisMoody:
Future development:
Toggle for light and dark themes
Adjustment/offset for DLST and local vs/ server time
Additional color bands to denote Asian/London/NYC sessions?
Text label for days instead of color option?
Clean up the code and simplify


Higher Timeframe EMAThis script plots a higher timeframe EMA to your chart.
You can specify the timeframe and the length of the EMA in the settings.
This chart demonstrates the 5-minute 50EMA (black) combined with the 1-hour 50EMA (colored) on the 1 minute timeframe.


400 Day Simple Moving AverageAlways shows the 400d simple moving average, regardless of currently-shown timeframe.

Session RangeSimple script for showing the high/low/midrange of a session. By default configured to do the Daily range using the "regular" session. But it's configurable. For example on this chart I am showing the Weekly range.

Day25RangeDay25Range(1) - Plot on the candle the 25% low range of the daily price. This helps to show when the current price is at or below the 25% price range of the day. Best when used with other indicators to show early wakening strength in price. On the attached chart, if you look at Jan 23, 2018 you will see a red candle that closed below the 25% mark of the trading day. For that day the 25% mark was at 38.66 and the close of the day was at 38.25 That indicators a potential start of a strong swing trade down. A second signal was given on Jan 25, 2018 when a red candle closed (37.25) below the 25% mark (38.08) again. Within the next few days a third weak indicator signaled on Jan 30,2018 with a close (35.88) below the Day25Range (37.46). price continued down from there for the next 4 days before starting to reverse. If the price closes below the 25% daily range as shown on the Day25Range(1) indicator, this could indicate a possible start of weakening in the price movement.
Day25RangeDay25Range(1) - I use this indicator to show where the lower 25% daily range of a stock is. This helps to show weakness in a stock during the trading day. I use this indicator with a CIRCLE or DOT plotted on the candle. Makes it easy to show weakness during the trading day.
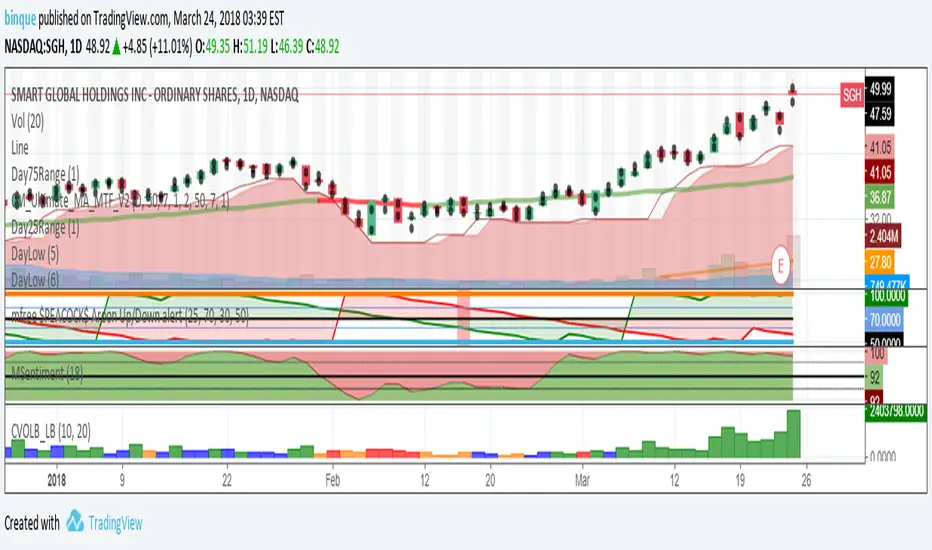
Day75RangeDay75Range(1) use to plot the 75% range of a trading day. I use a CIRCLE or DOT to indict the 75% range of the trading day.

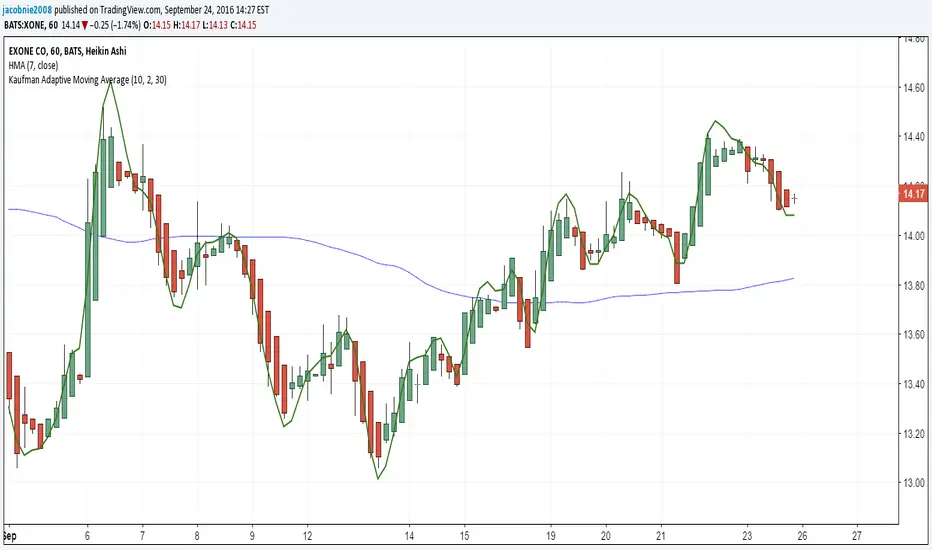
Kaufman Adaptive Moving Average (day)The KAMA will not change when the interval changes from day to something like 5 minutes or 30 minutes. Allows for more precise trading with the same indicator on a different interval.
Day Of The WeekVery simple script, which is also publicly available and found on the web by the way.
More visually appealing way of seeing what time it is. Works best around 15 minute charts. Doesn't work well on high timeframes.

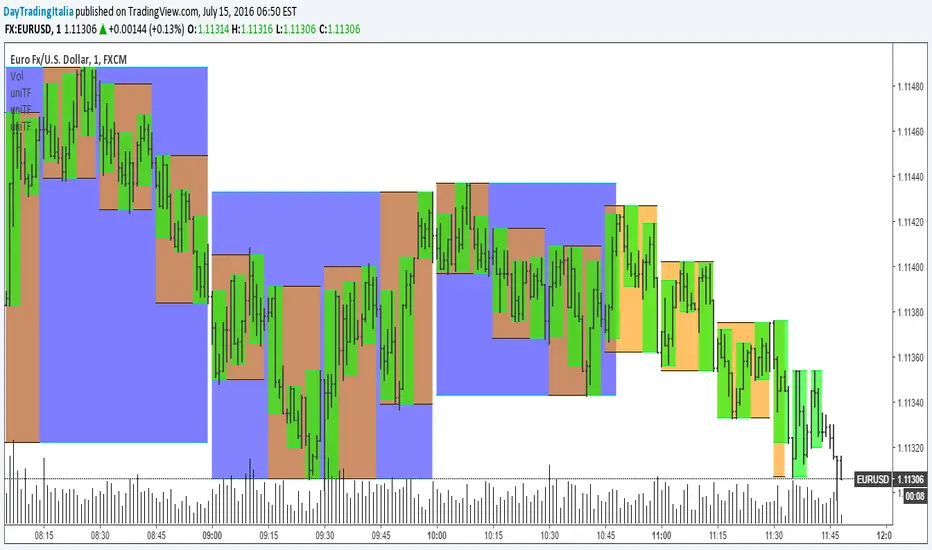
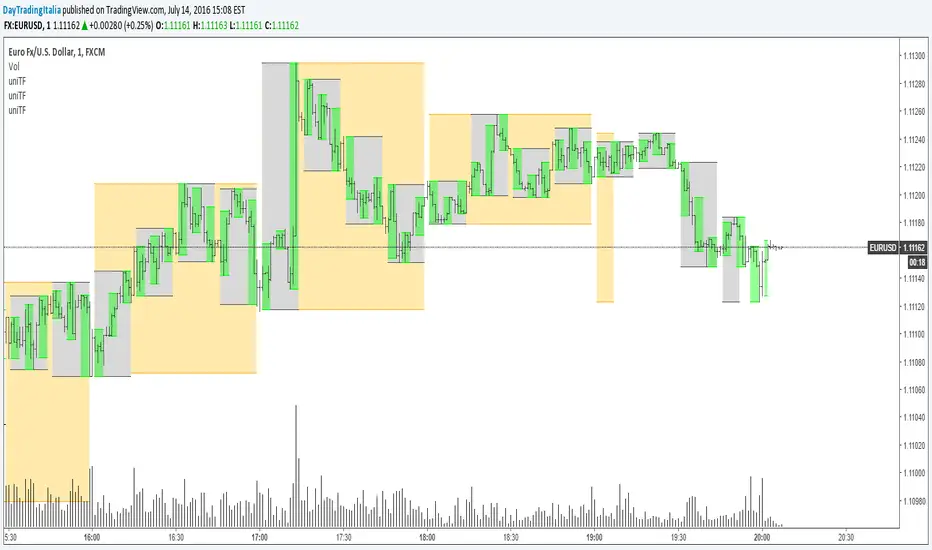
Universal Time Frame v1.1Now it should work better but is only for intraday charts. There are some other glitches though; I'll try to fix them as soon as possible.
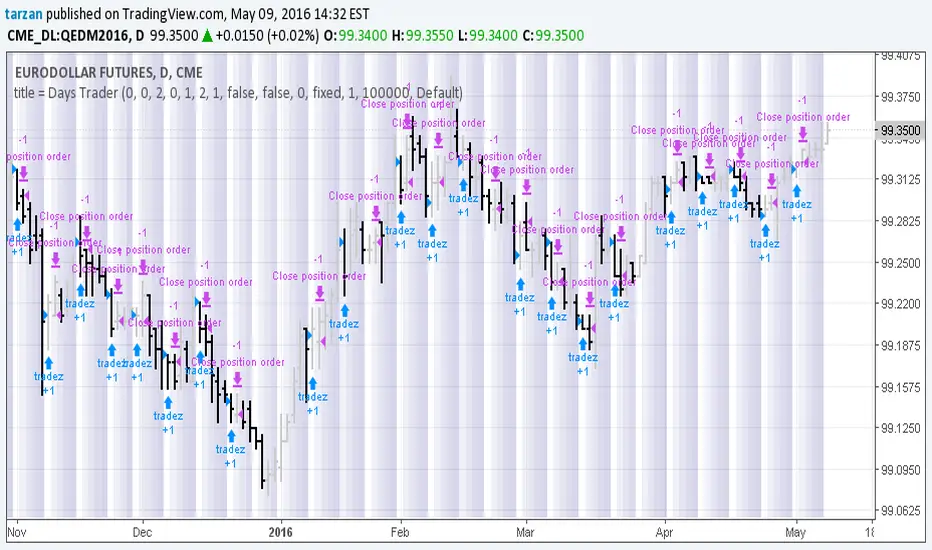
Days Trader 1.0Simple program to look for day of week or day of month patterns in chart data.
All original work by Boffin Hollow Lab
Author: Tarzan