Contrarian with 5 Levels5 Levels application was inspired and adapted from Predictive Ranges indicator developed by Lux Algo. So much credit to their work.
Indicator Description: Contrarian with 5 Levels
Overview
The "Contrarian with 5 Levels" indicator is a powerful tool designed for traders seeking to identify potential reversal points in the market by combining contrarian trading principles with dynamic support and resistance levels. This indicator overlays a Simple Moving Average (SMA) shadow and five adaptive price levels, integrating Institutional Concepts of Structure (ICT) such as Break of Structure (BOS) and Market Structure Shift (MSS) to provide clear buy and sell signals. It is ideal for traders looking to capitalize on overextended price movements, particularly on the daily timeframe, though it is adaptable to other timeframes with proper testing.
How It Works
The indicator operates on two core components:
Contrarian SMA Shadow: A shaded region between the SMA of highs and lows (default length: 100) acts as a dynamic zone to identify overbought or oversold conditions. When the price moves significantly outside this shadow, it signals potential exhaustion, aligning with contrarian trading principles.
Five Adaptive Levels: Using a modified ATR-based calculation, the indicator plots five key levels (two resistance, one average, and two support) that adjust dynamically to market volatility. These levels serve as critical zones for potential reversals.
ICT Structure Analysis: The indicator incorporates BOS and MSS logic to detect shifts in market structure, plotting bullish and bearish breaks with customizable colors for clarity.
Buy and sell signals are generated when the price crosses key levels while outside the SMA shadow, indicating potential reversal opportunities. The signals are visualized as small circles above (sell) or below (buy) the price bars, making them easy to interpret.
Mathematical Concepts
SMA Shadow: The indicator calculates the SMA of the highest highs and lowest lows over a user-defined period (default: 100). This creates a dynamic range that highlights extreme price movements, which contrarian traders often target for reversals.
Five Levels Calculation: The five levels are derived using a volatility-adjusted formula based on the Average True Range (ATR). The average level (central pivot) is calculated as a smoothed price, with two upper (resistance) and two lower (support) levels offset by a multiple of the ATR (default multiplier: 6.0). This adaptive approach ensures the levels remain relevant across varying market conditions.
ICT BOS/MSS Logic: The indicator identifies pivot highs and lows on a user-defined timeframe (default: daily) to detect structural breaks. A BOS occurs when the price breaks a prior pivot high (bullish) or low (bearish), while an MSS signals a shift in market direction, providing context for potential reversals.
Entry and Exit Rules
Buy Signal (Blue Dot Below Bar): Triggered when the closing price is below both the SMA shadow (smaLow) and the average level (avg), and the price crosses under either the first or second support level (prS1 or prS2). This suggests the market may be oversold, indicating a potential reversal upward.
Sell Signal (White Dot Above Bar): Triggered when the closing price is above both the SMA shadow (smaHigh) and the average level (avg), and the price crosses over either the first or second resistance level (prR1 or prR2). This suggests the market may be overbought, indicating a potential reversal downward.
Recommended Usage
This indicator is optimized for the daily timeframe, where it has been designed to capture significant reversal opportunities in trending or ranging markets. However, it can be adapted to other timeframes (e.g., 1H, 4H, 15M) with proper testing of settings such as SMA length, ATR multiplier, and structure timeframe. Users are encouraged to backtest and optimize parameters to suit their trading style and asset class.
Customization Options
SMA Length: Adjust the SMA period (default: 100) to control the sensitivity of the shadow.
Five Levels Length and Multiplier: Modify the length (default: 200) and ATR multiplier (default: 6.0) to fine-tune the support/resistance levels.
Timeframe Settings: Set separate timeframes for structure analysis and five levels to align with your trading strategy.
Color and Signal Display: Customize colors for BOS/MSS lines and toggle buy/sell signals on or off for a cleaner chart.
Why Use This Indicator?
The "Contrarian with 5 Levels" indicator combines the power of contrarian trading with dynamic levels and market structure analysis, offering a unique perspective for identifying high-probability reversal setups. Its intuitive design, customizable settings, and clear signal visualization make it suitable for both novice and experienced traders. Whether you're trading forex, stocks, or cryptocurrencies, this indicator provides a robust framework for spotting potential turning points in the market.
We hope you find the "Contrarian with 5 Levels" indicator a valuable addition to your trading toolkit! Happy trading!
Please leave feedback in the comments section.
Dollarcostaverage

Risk Investor - Risk based DCAA Dollar Cost Averaging (DCA) tool that manages investments based on customizable risk levels. Features include:
Risk-based investment sizing
Vault system for deposit management
Daily/Weekly/Monthly investment options
Configurable profit-taking rules
Visual buy/sell indicators
The strategy uses buy multipliers to control position sizing. At lower risk levels (e.g., 0.1), higher multipliers (4x) enable larger purchases. As risk increases (e.g., 0.7), reduced multipliers (1x) limit market exposure, creating a dynamic DCA strategy that adapts to market conditions.
The sell mechanism activates at higher risk levels with configurable percentage-based exits.
For example, you can set 30% sell at risk level 0.8 and 70% at 0.9, creating a graduated exit strategy.
Profits automatically flow back into the vault system for reinvestment. If the vault is already topped up, profits are being taken out of the system.
Note: Risk Investor requires an external risk model.
Compatible options include:
Bitcoin Top Indicator by Da_Prof ()
Benjamin Cowen's Simplified Risk Metric by jacdr ()
Setup: Connect your chosen risk model via the risk indicator field and configure the minimum/maximum risk values. For example, when using Bitcoin Top Indicator by Da_Prof, set the Max. Risk Value to 12.

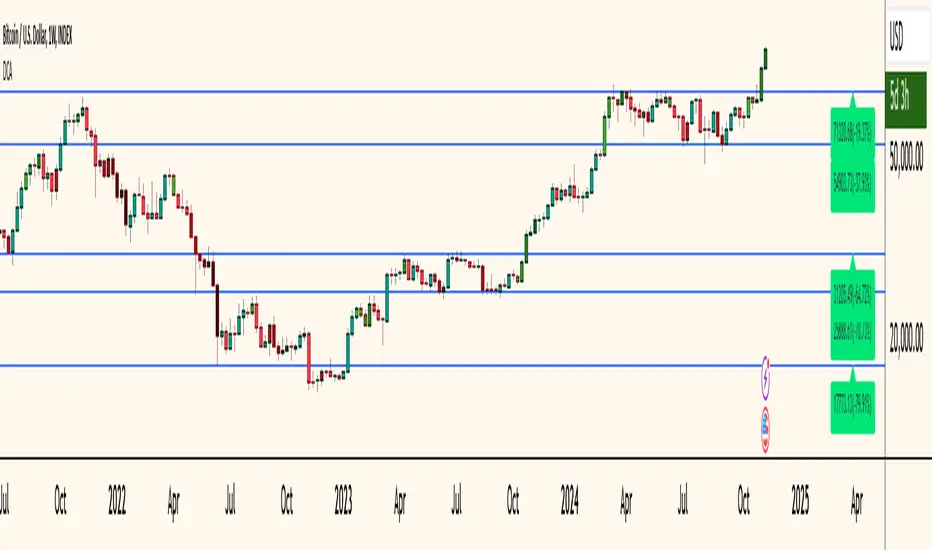
Dollar Cost Averaging (YavuzAkbay)The Dollar Cost Averaging (DCA) indicator is designed to support long-term investors following a Dollar Cost Averaging strategy. The core aim of this tool is to provide insights into overbought and oversold levels, assisting investors in managing buy and sell decisions with a clear visual cue system. Specifically developed for use in trending or fluctuating markets, this indicator leverages support and resistance levels to give structure to investors' buying strategies. Here’s a detailed breakdown of the indicator’s key features and intended usage:
Key Features and Color Coding
Overbought/Oversold Detection:
The indicator shades candles from light green to dark green when an asset becomes increasingly overbought. Dark green signals indicate a peak, where the asset is overbought, suggesting a potential opportunity to take partial profits.
Conversely, candles turn from light red to dark red when the market is oversold. Dark red signifies a heavily oversold condition, marking an ideal buying window for initiating or adding to a position. This color scheme provides a quick visual reference for investors to manage entries and exits effectively.
Support and Resistance Levels:
To address the risk of assets falling further after an overbought signal, the DCA indicator dynamically calculates support and resistance levels. These levels guide investors on key price areas to watch for potential price reversals, allowing them to make more informed buying or selling decisions.
Support levels help investors assess whether they should divide their capital across multiple buy orders, starting at the current oversold zone and extending to anticipated support zones for maximum flexibility.
Usage Methodology
This indicator is intended for Dollar Cost Averaging, a method where investors gradually add to their position rather than entering all at once. Here’s how it complements the DCA approach:
Buy at Oversold Levels: When the indicator shows a dark red candle, it signals that the asset is oversold, marking an optimal entry point. The presence of support levels can help investors determine if they should fully invest their intended amount or stagger buys at potential lower levels.
Sell at Overbought Levels: When the indicator transitions to dark green, it suggests that the asset is overbought. This is an ideal time to consider selling a portion of holdings to realize gains. The resistance levels, marked by the indicator, offer guidance on where the price may encounter selling pressure, aiding investors in planning partial exits.
Customizable Settings
The DCA indicator offers several user-adjustable parameters:
Pivot Frequency and Source: Define the pivot point frequency and the source (candle wick or body) for more tailored support/resistance detection.
Maximum Pivot Points: Set the maximum number of pivot points to be used in support/resistance calculations, providing flexibility in adapting to different market structures.
Channel Width and Line Width: Adjust the width of the channel for support/resistance levels and the thickness of the lines for easier visual tracking.
Color Intensities for Overbought/Oversold Levels: Customize the shading intensity for each overbought and oversold level to align with your trading preferences.
Smart DCA StrategyINSPIRATION
While Dollar Cost Averaging (DCA) is a popular and stress-free investment approach, I noticed an opportunity for enhancement. Standard DCA involves buying consistently, regardless of market conditions, which can sometimes mean missing out on optimal investment opportunities. This led me to develop the Smart DCA Strategy – a 'set and forget' method like traditional DCA, but with an intelligent twist to boost its effectiveness.
The goal was to build something more profitable than a standard DCA strategy so it was equally important that this indicator could backtest its own results in an A/B test manner against the regular DCA strategy.
WHY IS IT SMART?
The key to this strategy is its dynamic approach: buying aggressively when the market shows signs of being oversold, and sitting on the sidelines when it's not. This approach aims to optimize entry points, enhancing the potential for better returns while maintaining the simplicity and low stress of DCA.
WHAT THIS STRATEGY IS, AND IS NOT
This is an investment style strategy. It is designed to improve upon the common standard DCA investment strategy. It is therefore NOT a day trading strategy. Feel free to experiment with various timeframes, but it was designed to be used on a daily timeframe and that's how I recommend it to be used.
You may also go months without any buy signals during bull markets, but remember that is exactly the point of the strategy - to keep your buying power on the sidelines until the markets have significantly pulled back. You need to be patient and trust in the historical backtesting you have performed.
HOW IT WORKS
The Smart DCA Strategy leverages a creative approach to using Moving Averages to identify the most opportune moments to buy. A trigger occurs when a daily candle, in its entirety including the high wick, closes below the threshold line or box plotted on the chart. The indicator is designed to facilitate both backtesting and live trading.
HOW TO USE
Settings:
The input parameters for tuning have been intentionally simplified in an effort to prevent users falling into the overfitting trap.
The main control is the Buying strictness scale setting. Setting this to a lower value will provide more buying days (less strict) while higher values mean less buying days (more strict). In my testing I've found level 9 to provide good all round results.
Validation days is a setting to prevent triggering entries until the asset has spent a given number of days (candles) in the overbought state. Increasing this makes entries stricter. I've found 0 to give the best results across most assets.
In the backtest settings you can also configure how much to buy for each day an entry triggers. Blind buy size is the amount you would buy every day in a standard DCA strategy. Smart buy size is the amount you would buy each day a Smart DCA entry is triggered.
You can also experiment with backtesting your strategy over different historical datasets by using the Start date and End date settings. The results table will not calculate for any trades outside what you've set in the date range settings.
Backtesting:
When backtesting you should use the results table on the top right to tune and optimise the results of your strategy. As with all backtests, be careful to avoid overfitting the parameters. It's better to have a setup which works well across many currencies and historical periods than a setup which is excellent on one dataset but bad on most others. This gives a much higher probability that it will be effective when you move to live trading.
The results table provides a clear visual representation as to which strategy, standard or smart, is more profitable for the given dataset. You will notice the columns are dynamically coloured red and green. Their colour changes based on which strategy is more profitable in the A/B style backtest - green wins, red loses. The key metrics to focus on are GOA (Gain on Account) and Avg Cost .
Live Trading:
After you've finished backtesting you can proceed with configuring your alerts for live trading.
But first, you need to estimate the amount you should buy on each Smart DCA entry. We can use the Total invested row in the results table to calculate this. Assuming we're looking to trade on BITSTAMP:BTCUSD
Decide how much USD you would spend each day to buy BTC if you were using a standard DCA strategy. Lets say that is $5 per day
Enter that USD amount in the Blind buy size settings box
Check the Blind Buy column in the results table. If we set the backtest date range to the last 10 years, we would expect the amount spent on blind buys over 10 years to be $18,250 given $5 each day
Next we need to tweak the value of the Smart buy size parameter in setting to get it as close as we can to the Total Invested amount for Blind Buy
By following this approach it means we will invest roughly the same amount into our Smart DCA strategy as we would have into a standard DCA strategy over any given time period.
After you have calculated the Smart buy size , you can go ahead and set up alerts on Smart DCA buy triggers.
BOT AUTOMATION
In an effort to maintain the 'set and forget' stress-free benefits of a standard DCA strategy, I have set my personal Smart DCA Strategy up to be automated. The bot runs on AWS and I have a fully functional project for the bot on my GitHub account. Just reach out if you would like me to point you towards it. You can also hook this into any other 3rd party trade automation system of your choice using the pre-configured alerts within the indicator.
PLANNED FUTURE DEVELOPMENTS
Currently this is purely an accumulation strategy. It does not have any sell signals right now but I have ideas on how I will build upon it to incorporate an algorithm for selling. The strategy should gradually offload profits in bull markets which generates more USD which gives more buying power to rinse and repeat the same process in the next cycle only with a bigger starting capital. Watch this space!
MARKETS
Crypto:
This strategy has been specifically built to work on the crypto markets. It has been developed, backtested and tuned against crypto markets and I personally only run it on crypto markets to accumulate more of the coins I believe in for the long term. In the section below I will provide some backtest results from some of the top crypto assets.
Stocks:
I've found it is generally more profitable than a standard DCA strategy on the majority of stocks, however the results proved to be a lot more impressive on crypto. This is mainly due to the volatility and cycles found in crypto markets. The strategy makes its profits from capitalising on pullbacks in price. Good stocks on the other hand tend to move up and to the right with less significant pullbacks, therefore giving this strategy less opportunity to flourish.
Forex:
As this is an accumulation style investment strategy, I do not recommend that you use it to trade Forex.
STRATEGY IN ACTION
Here you see the indicator running on the BITSTAMP:BTCUSD pair. You can read the indicator as follows:
Vertical green bands on historical candles represents where buy signals triggered in the past
Table on the top right represents the results of the A/B backtest against a standard DCA strategy
Green Smart Buy column shows that Smart DCA was more profitable than standard DCA on this backtest. That is shown by the percentage GOA (Gain on Account) and the Avg Cost
Smart Buy Zone label marks the threshold which the entire candle must be below to trigger a buy signal (line can be changed to a box under plotting settings)
Green color of Smart Buy Zone label represents that the open candle is still valid for a buy signal. A signal will only be generated if the candle closes while this label is still green
Below is the same BITSTAMP:BTCUSD chart a couple of days later. Notice how the threshold has been broken and the Smart Buy Zone label has turned from green to red. No buy signal can be triggered for this day - even if the candle retraced and closed below the threshold before daily candle close.
Notice how the green vertical bands tend to be present after significant pullbacks in price. This is the reason the strategy works! Below is the same BITSTAMP:BTCUSD chart, but this time zoomed out to present a clearer picture of the times it would invest vs times it would sit out of the market. You will notice it invests heavily in bear markets and significant pullbacks, and does not buy anything during bull markets.
Finally, to visually demonstrate the indicator on an asset other than BTC, here is an example on CRYPTO:ETHUSD . In this case the current daily high has not touched the threshold so it is still possible for this to be a valid buy trigger on daily candle close. The vertical green band will not print until the buy trigger is confirmed.
BACKTEST RESULTS
Now for some backtest results to demonstrate the improved performance over a standard DCA strategy using all non-stablecoin assets in the top 30 cryptos by marketcap.
I've used the TradingView ticker (exchange name denoted as CRYPTO in the symbol search) for every symbol tested with the exception of BTCUSD because there was some dodgy data at the beginning of the TradingView BTCUSD chart which overinflated the effectiveness of the Smart DCA strategy on that ticker. For BTCUSD I've used the BITSTAMP exchange data. The symbol links below will take you to the correct chart and exchange used for the test.
I'm using the GOA (Gain on Account) values to present how each strategy performed.
The value on the left side is the standard DCA result and the right is the Smart DCA result.
✅ means Smart DCA strategy outperformed the standard DCA strategy
❌ means standard DCA strategy outperformed the Smart DCA strategy
To avoid overfitting, and to prove that this strategy does not suffer from overfitting, I've used the exact same input parameters for every symbol tested below. The settings used in these backtests are:
Buying strictness scale: 9
Validation days: 0
You can absolutely tweak the values per symbol to further improve the results of each, however I think using identical settings on every pair tested demonstrates a higher likelihood that the results will be similar in the live markets.
I'm presenting results for two time periods:
First price data available for trading pair -> closing candle on Friday 26th Jan 2024 (ALL TIME)
Opening candle on Sunday 1st Jan 2023 -> closing candle on Friday 26th Jan 2024 (JAN 2023 -> JAN 2024)
ALL TIME:
BITSTAMP:BTCUSD 80,884% / 133,582% ✅
CRYPTO:ETHUSD 17,231% / 36,146% ✅
CRYPTO:BNBUSD 5,314% / 2,702% ❌
CRYPTO:SOLUSD 1,745% / 1,171% ❌
CRYPTO:XRPUSD 2,585% / 4,544% ✅
CRYPTO:ADAUSD 338% / 353% ✅
CRYPTO:AVAXUSD 130% / 160% ✅
CRYPTO:DOGEUSD 13,690% / 16,432% ✅
CRYPTO:TRXUSD 414% / 466% ✅
CRYPTO:DOTUSD -16% / -7% ✅
CRYPTO:LINKUSD 1,161% / 2,164% ✅
CRYPTO:TONUSD 25% / 47% ✅
CRYPTO:MATICUSD 1,769% / 1,587% ❌
CRYPTO:ICPUSD 70% / 50% ❌
CRYPTO:SHIBUSD -20% / -19% ✅
CRYPTO:LTCUSD 486% / 718% ✅
CRYPTO:BCHUSD -4% / 3% ✅
CRYPTO:LEOUSD 102% / 151% ✅
CRYPTO:ATOMUSD 46% / 91% ✅
CRYPTO:UNIUSD -16% / 1% ✅
CRYPTO:ETCUSD 283% / 414% ✅
CRYPTO:OKBUSD 1,286% / 1,935% ✅
CRYPTO:XLMUSD 1,471% / 1,592% ✅
CRYPTO:INJUSD 830% / 1,035% ✅
CRYPTO:OPUSD 138% / 195% ✅
CRYPTO:NEARUSD 23% / 44% ✅
Backtest result analysis:
Assuming we have an initial investment amount of $10,000 spread evenly across each asset since the creation of each asset, it would have provided the following results.
Standard DCA Strategy results:
Average percent return: 4,998.65%
Profit: $499,865
Closing balance: $509,865
Smart DCA Strategy results:
Average percent return: 7,906.03%
Profit: $790,603
Closing balance: $800,603
JAN 2023 -> JAN 2024:
BITSTAMP:BTCUSD 47% / 66% ✅
CRYPTO:ETHUSD 26% / 33% ✅
CRYPTO:BNBUSD 15% / 17% ✅
CRYPTO:SOLUSD 272% / 394% ✅
CRYPTO:XRPUSD 7% / 12% ✅
CRYPTO:ADAUSD 43% / 59% ✅
CRYPTO:AVAXUSD 116% / 151% ✅
CRYPTO:DOGEUSD 8% / 14% ✅
CRYPTO:TRXUSD 48% / 65% ✅
CRYPTO:DOTUSD 24% / 35% ✅
CRYPTO:LINKUSD 83% / 124% ✅
CRYPTO:TONUSD 7% / 21% ✅
CRYPTO:MATICUSD -3% / 7% ✅
CRYPTO:ICPUSD 161% / 196% ✅
CRYPTO:SHIBUSD 1% / 8% ✅
CRYPTO:LTCUSD -15% / -7% ✅
CRYPTO:BCHUSD 47% / 68% ✅
CRYPTO:LEOUSD 9% / 11% ✅
CRYPTO:ATOMUSD 1% / 15% ✅
CRYPTO:UNIUSD 9% / 23% ✅
CRYPTO:ETCUSD 27% / 40% ✅
CRYPTO:OKBUSD 21% / 30% ✅
CRYPTO:XLMUSD 11% / 19% ✅
CRYPTO:INJUSD 477% / 446% ❌
CRYPTO:OPUSD 77% / 91% ✅
CRYPTO:NEARUSD 78% / 95% ✅
Backtest result analysis:
Assuming we have an initial investment amount of $10,000 spread evenly across each asset for the duration of 2023, it would have provided the following results.
Standard DCA Strategy results:
Average percent return: 61.42%
Profit: $6,142
Closing balance: $16,142
Smart DCA Strategy results:
Average percent return: 78.19%
Profit: $7,819
Closing balance: $17,819

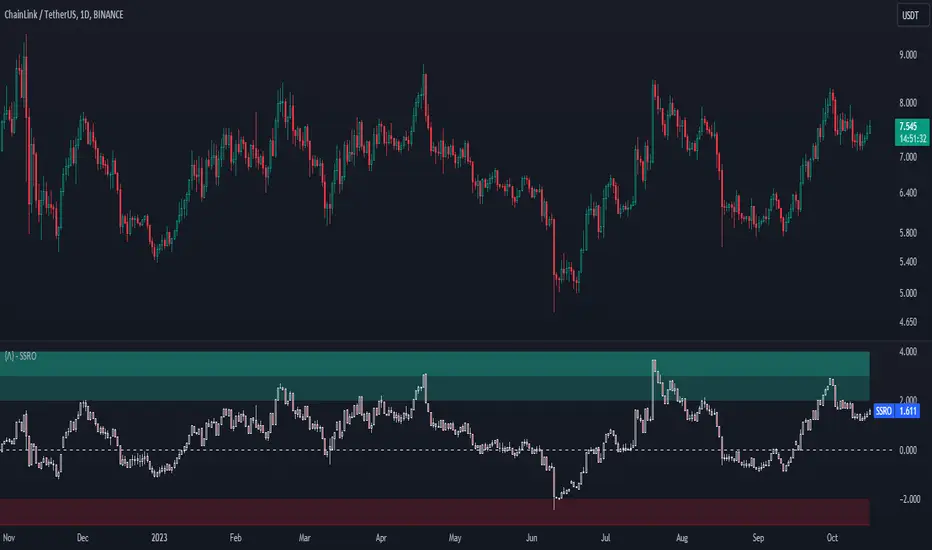
Stablecoin Supply Ratio Oscillator
The Stablecoin Supply Ratio Oscillator (SSRO) is a cryptocurrency indicator designed for mean reversion analysis and sentiment assessment. It calculates the ratio of CRYPTO:BTCUSD 's market capitalization to the sum of stablecoins' market capitalization and z-scores the result, offering insights into market sentiment and potential turning points.
Methodology:
The SSRO is calculated as follows-
method ssro(float src, array stblsrc, int len) =>
float ssr = src / stblsrc.sum() // Source of the underlying divided by the sum of stablecoin sources
(ssr - ta.sma(ssr, len)) / ta.stdev(ssr, len) // Z-Score Transformed
This ratio is Z-Scored to provide a standardized measure, allowing users to identify periods of market fear or greed based on the allocation of capital between the underlying and Stablecoins ( CRYPTOCAP:USDT , CRYPTOCAP:USDC , CRYPTO:TUSD , CRYPTOCAP:BUSD , CRYPTOCAP:DAI , CRYPTOCAP:USDD , CRYPTOCAP:FRAX ). The z-scored values indicate potential areas of discount (buying opportunities) or premium (selling opportunities) relative to historical patterns.
Customization:
Underlying Asset: SSRO is customizable to different underlying assets, offering a versatile tool for various cryptocurrencies.
Calculation Length: Users can adjust the length of the calculation, tailoring the indicator to short or long-term analysis.
Visualization: SSRO can be displayed as candles, providing a visual representation of premium and discount areas.
Interpretation:
Market Sentiment: Lower SSRO values may indicate market fear, suggesting a preference for stablecoins as a relatively safer haven for capital. Conversely, higher values may suggest market greed, as more capital is allocated to the underlying asset.
Utility and Use Cases:
1. Mean Reversion Analysis: SSRO identifies potential mean reversion opportunities, guiding traders on optimal entry and exit points.
2. Sentiment Analysis: The indicator provides insights into market sentiment, aiding traders in understanding market dynamics.
3. Macro Analysis: The majority of cryptos follow \ correlate to CRYPTO:BTCUSD , Therefore by assessing premium and discount areas of CRYPTO:BTCUSD relative to the chosen underlying asset, users gain insights into potential market tops and bottoms.
4. Divergence Analysis: SSRO divergence from price trends can signal potential reversals, providing traders with additional confirmation for their decisions.
The Stablecoin Supply Ratio Oscillator is a valuable tool for cryptocurrency traders, offering a nuanced perspective on market sentiment and mean reversion opportunities. Its customization options and visual representation make it a versatile and powerful addition to the crypto analyst's toolkit.
Dollar Cost Averaging (Portfolio)
You can use it in daily, weekly and monthly candles. It can be used on multiple assets(10). All assets must have data and make sure they all use the same currency. See style in settings for plot titles If you are interested in passive investing, I hope it helps.
------------------
Günlük, haftalık, aylık mumlarda kullabilirsiniz. Birden fazla varlıkta kullanılabilir. Çoklu kullanım için hepsinin verisi olmalı ve aynı para birimini kullanmalı. Ayarlardan stilde grafik başlıklarını bulabilirsiniz. Pasif yatırım ile ilgiyseniz umarım yardımcı olur.

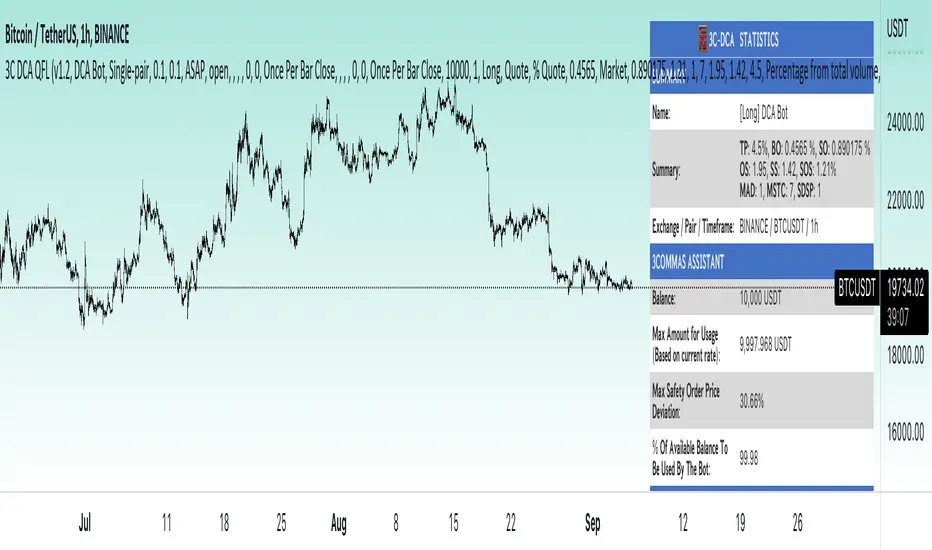
3Commas dollar cost averaging (DCA) QFL IndicatorAs investors, we often face the dilemma of willing high stock prices when we sell, but not when we buy. There are times when this dilemma causes investors to wait for a dip in prices, thereby potentially missing out on a continual rise. This is how investors get lured away from the markets and become tangled in the slippery slope of market timing, which is not advisable to a long-term investment strategy.
Skyrex developed a complex indicator based on dollar-cost averaging in Quick Fingers Luc's interpretation. It is a combinations of strategies which allows to systematically accumulate assets by investing scaled amounts of money at defined market cycle global support levels. Dollar-cost averaging can reduce the overall impact of price volatility and lower the average cost per asset thus even during market slumps only a small bounce is required to reach take profit.
The indicator script monitors a chart price action and identifies bases as they form. When bases are reached the script provides entry alerts. During price action development an asset value can go lower and in this way the script will perform safety entries alerts at each subsequent accumulation levels. When weighted average entry price reaches target profit the script will perform a take profit action alert.
Bases are identified as pivot lows in a fractal pattern and validated by an adjustable decrease/rise percentage to ensure significancy of identified bases. To qualify a pivot low, the indicator will perform the following validation:
Validate the price rate of change on drops and bounces is above a given threshold amount.
Validate the volume at the low pivot point is above the volume moving average (using a given length).
Validate the volume amount is a given factor of magnitude above is above the volume moving average.
Validate the potential new base is not too close to the previous range by using a given price percent difference threshold amount.
A fractal pattern is a recurring pattern on a price chart that can predict reversals among larger, more chaotic price movements. These basic fractals are composed of five or more bars. The rules for identifying fractals are as follows:
A bearish turning point occurs when there is a pattern with the highest high in the middle and two lower highs on each side.
A bullish turning point occurs when there is a pattern with the lowest low in the middle and two higher lows on each side.
Basic dollar-cost averaging approach is enhances by implementation of adjustable accumulation levels in order to provide opportunity of setting them at defined global support levels and Martingale volume coefficient to increase averaging effect. According to Quick Fingers Luc's principles trading principles we added volume validation of a base because it allows to confirm that the market is resistant to further price decrease.
The indicator supports traditional and cryptocurrency spot, futures , options and marginal trading exchanges. It works accurately with BTC , USD, USDT, ETH and BNB quote currencies. Best to use with 1H timeframe charts and limit orders. The indicator can be and should be configured for each particular asset according to its global support and resistance levels and price action cycles. You can modify levels and risk management settings to receive better performance
The difference between core script and this interpretation is that this strategy is specially designed for 3Commas bots
How to use?
1. Apply indicator to a trading pair your are interested in using 1H timeframe chart
2. Configure the indicator: change layer values, order size multiple and take profit/stop loss values according to current market cycle stage
3. Set up a TradingView custom alert using the indicator settings to trigger on a condition you are interested in
4. The indicator will send alerts when to enter and when to exit positions which can be applied to your portfolio using external trading platforms
5. Update settings once market conditions are changed using backtests on a monthly period
Dollar cost averaging (DCA) QFL IndicatorAs investors, we often face the dilemma of willing high stock prices when we sell, but not when we buy. There are times when this dilemma causes investors to wait for a dip in prices, thereby potentially missing out on a continual rise. This is how investors get lured away from the markets and become tangled in the slippery slope of market timing, which is not advisable to a long-term investment strategy.
Skyrex developed a complex indicator based on dollar-cost averaging in Quick Fingers Luc's interpretation. It is a combinations of strategies which allows to systematically accumulate assets by investing scaled amounts of money at defined market cycle global support levels. Dollar-cost averaging can reduce the overall impact of price volatility and lower the average cost per asset thus even during market slumps only a small bounce is required to reach take profit.
The indicator script monitors a chart price action and identifies bases as they form. When bases are reached the script provides entry alerts. During price action development an asset value can go lower and in this way the script will perform safety entries alerts at each subsequent accumulation levels. When weighted average entry price reaches target profit the script will perform a take profit action alert.
Bases are identified as pivot lows in a fractal pattern and validated by an adjustable decrease/rise percentage to ensure significancy of identified bases. To qualify a pivot low, the indicator will perform the following validation:
Validate the price rate of change on drops and bounces is above a given threshold amount.
Validate the volume at the low pivot point is above the volume moving average (using a given length).
Validate the volume amount is a given factor of magnitude above is above the volume moving average.
Validate the potential new base is not too close to the previous range by using a given price percent difference threshold amount.
A fractal pattern is a recurring pattern on a price chart that can predict reversals among larger, more chaotic price movements. These basic fractals are composed of five or more bars. The rules for identifying fractals are as follows:
A bearish turning point occurs when there is a pattern with the highest high in the middle and two lower highs on each side.
A bullish turning point occurs when there is a pattern with the lowest low in the middle and two higher lows on each side.
Basic dollar-cost averaging approach is enhances by implementation of adjustable accumulation levels in order to provide opportunity of setting them at defined global support levels and Martingale volume coefficient to increase averaging effect. According to Quick Fingers Luc's principles trading principles we added volume validation of a base because it allows to confirm that the market is resistant to further price decrease.
The indicator supports traditional and cryptocurrency spot, futures, options and marginal trading exchanges. It works accurately with BTC, USD, USDT, ETH and BNB quote currencies. Best to use with 1H timeframe charts and limit orders. The indicator can be and should be configured for each particular asset according to its global support and resistance levels and price action cycles. You can modify levels and risk management settings to receive better performance
Advantages of this indicator:
The indicator has custom alert settings for each strategy action
The indicator can be used with 3Commas, Cryptohopper, Alertatron or Zignaly bots
The indicator is sustainable to market slumps and can be used for long-term trading
The indicator provides a large number of entries which is good for diversification
Can be applied to any market and quote currency
Easy to configure user interface settings
How to use?
1. Apply indicator to a trading pair your are interested in using 1H timeframe chart
2. Configure the indicator: change layer values, order size multiple and take profit/stop loss values according to current market cycle stage
3. Set up a TradingView custom alert using the indicator settings to trigger on a condition you are interested in
4. The indicator will send alerts when to enter and when to exit positions which can be applied to your portfolio using external trading platforms
5. Update settings once market conditions are changed using backtests on a monthly period

Crypto Force IndexIntroduction
The Crypto Force Index (CFI) indicator helps us understand the current strength and weakness of the price. It is very useful when used on high timeframes for investment purposes and not for short term trading.
To determine the strength and weakness of the price, a level grid based on the RSI indicator is used.
Based on the RSI value, red circles (oversold condition) and green circles (overbought condition) appear under the price candles. The more intense the color of the circles, the more that the current price is in an overbought or oversold condition.
The signal levels are all configurable to adapt the indicator across multiple instruments and markets.
The default configuration have been designed to obtain more accurate signals on Ethereum and Bitcoin, using the weekly timeframe.
Why Crypto Force Index?
The Crypto Force Index (CFI) is the consequence of my study of investments based on the accumulation plan. I wanted to demonstrate that I am improving the returns of the classic DCA ( dollar cost averaging ) and VA ( value averaging ).
After finding my own model of an accumulation plan, I decided to create the Crypto Force Index to help me visually enter the market.
The formulas of the indicator are very simple, but my studies confirm the power of this tool.
How are the signals to be interpreted?
The Crypto Force Index helps us to highlight the overbought and oversold areas, with the use of circles under the price of candles and with a thermometer inserted at the base of the graph, where all the phases of strength and weakness are highlighted.
As soon as the red circles start to appear on the chart, that may be a good time to enter LONG to the market and start accumulating. If the circles are green, we can consider decreasing the current exposure by selling part of your portfolio, or decide to stay flat.
I personally use these signals on the weekly timeframe, to decide to feed my accumulation plan at the beginning of each month.
I hope it can be of help to you! Please help me improve the Crypto Force Index! :)

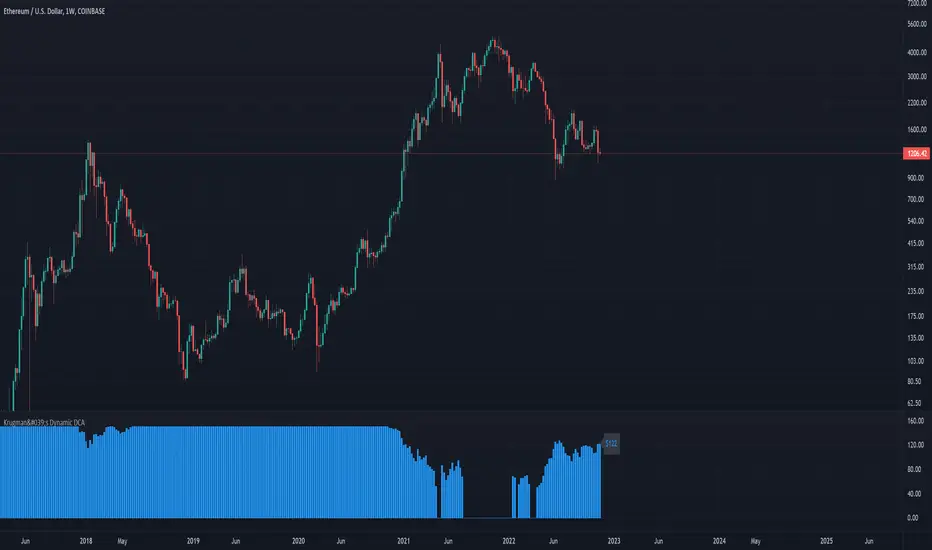
Krugman's Dynamic DCAThis script helps you create a DCA (dollar-cost averaging) strategy for your favorite markets and calculates the DCA value for each bar. This can be used to DCA daily, weekly, bi-weekly, etc.
Configuring the indicator:
- DCA Starting Price : the price you want to begin DCA'ing
- DCA Base Amount : the $ amount you will DCA when price is half of your starting price
- DCA Max Amount : the maximum amount you want to DCA regardless of how low price gets
The DCA scaling works exactly like the formula used to calculated the gain needed to recover from a given % loss. In this case it's calculated from the DCA Starting Price . The idea is to increase the DCA amount linearly with the increased upside potential.
Period Dollar Cost Average BacktesterHere is a simple script to calculate the profits and other dollar cost average strategy statistics. This strategy was created to avoid asset price volatility, so the pump and dump scheme does not affect the portfolio. By dividing the investment amount into periods, the investor doesn’t need to analyze the market, fundamental analysis, or anything. The goal is to increase the asset holdings and avoid fast and robust price movements.
This indicator has some configurations.
Amount to buy: the amount to buy at each time
Broker fee %: the fee percentage that the broker has for spot trade
Frequency: the frequency of the investments. Example: 1 Day means that every day, it will buy an amount of the asset
Starting Date: when the indicator will start the investment simulation
Ending Date: when the indicator will end the investment simulation
InfoCell With/Height: it relates to the panel for view purposes. Change the values to fit better on your screen.
This indicator has three lines:
Total Invested (green): total amount invested at the end of the period
Total Net Profit (pink): total profit by converting the amount of the asset bought at the latest closing price
Holding Profits (yellow): the amount that would be in the portfolio if the investor had invested all the capital in a signal trade at the beginning of the period.
The statistics panel has some information to help you understand buying the asset in one or more trades. So, besides those three lines that were mentioned above, here are the other statistics:
Entry Price: The price of the asset when the first investment was made
Gross Profit: Total amount of profit, not excluding the losses
Gross Losses: Total amount of losses, not excluding the profits
Profit Factor: The Gross Profit divided by the Gross Loss. A value above 1 means it’s profitable.
Profit/Trades: Net profit per trade. This includes the broker fees.
Recovery Factor: The Net profit divided by the relative drawdown. The higher the recovery factor, the faster the recovery of a loss
Total Asset Bought: The amount of the asset that was bought at the end of the investment plan
Absolute Drawdown: The total amount of losses that made the account balance go below its initial value
Relative Drawdown: The max drawdown that occurred, no matter the account balance amount
Total Trades: number of times the investment was made in the selected period
Total Fee: total Fee that was spent on the total investment
Total Winning Trades: the total amount of winning trades. A trade is considered a winner if the net profit is up compared with the latest investment.
Total Losing Trades: the total amount of losing trades. A trade is considered a loser if the net profit is down compared to the latest investment.
Max consecutive wins: the max amount of consecutive winning trades
Max consecutive losses: the max amount of consecutive losing trades
The chart above uses the default configuration of the indicator. Placed on the BTCUSD market, taking the time range of January 1st, 2018 to January 1st, 2022, 4 years. Buying a BTC amount with 10 USDT every day in that period would generate a more than 500% profit. Compared to the profit amount by just holding the count, which was close to 350% profit, the dollar cost average by period would be much more profitable.

TTP AF Sim ProThis indicator helps you visualise, practice, manage and automatically add funds to DCA deals that are in negative.
Multiple factors factors are relevant when trying to exit a bad deal:
How much funds are invested
What's the current average position price
How far the price has already dropped from that average
Is the price bouncing significantly and frequently to the upside providing multiple opportunities to exit or is it still a free-falling knife dumping heavy?
What are your TP % expectations
This indicator allows you to enter all these parameters visualising them all together in a single chart. The chart will show you based on all this information how much funds you would have required to exit in profit and rescue the deal in green. It will also flag if the exit strategy would have failed by plotting a red label indicating all the times where the TP wouldn't have been reached.
The exit strategies
In this pro version you have access to edit all settings and the added ability to use an external indicator as source:
Custom external indicator as source
Relative Strength Index (RSI)
Commodity Channel Index (CCI)
Money Flow Index (MFI)
Bollinger Bands (BB)
Automated Add Funds-alert
With this indicator you can also add funds to the deals automatically:
Every time the conditions are true an alert is sent
Add Bot ID and Email Token for the deals
Select automatically calculated volume or your own custom
Tweak your exit strategy to your liking and add your Bot ID and Email Token to automatically add funds to your open deals.

TTP AF SimThis indicator helps you visualise, practice, manage and automatically add funds to DCA deals that are in negative.
Multiple factors factors are relevant when trying to exit a bad deal:
How much funds are invested
What's the current average position price
How far the price has already dropped from that average
Is the price bouncing significantly and frequently to the upside providing multiple opportunities to exit or is it still a free-falling knife dumping heavy?
What are your TP % expectations
This indicator allows you to enter all these parameters visualising them all together in a single chart. The chart will show you based on all this information how much funds you would have required to exit in profit and rescue the deal in green. It will also flag if the exit strategy would have failed by plotting a red label indicating all the times where the TP wouldn't have been reached.
The exit strategies
In this basic version you have access to well tested and pre-defined conditions with the following indicators:
Relative Strength Index (RSI)
Commodity Channel Index (CCI)
Money Flow Index (MFI)
Bollinger Bands (BB)
Automated Add Funds-alert
With this indicator you can also add funds to the deals automatically:
Every time the conditions are true an alert is sent
Add Bot ID and Email Token for the deals
Select automatically calculated volume or your own custom
Select exit strategy and add your Bot ID and Email Token to automatically add funds to your open deals.

Add funds simulator This script is intended to help understanding better and practice how to exit DCA deals that are in negative.
Multiple factors factors are relevant when trying to exit a bad deal:
How much funds are invested
What's the current average position price
How far the price has already dropped from that average
Is the price bouncing significantly and frequently to the upside providing multiple opportunities to exit or is it still a free-falling knife dumping heavy?
What are your TP % expectations
This scripts allows you to enter all these parameters visualising them all together in a single chart.
The RSI exit strategy
You can then make use of a simple exit strategy based on RSI.
The strategy will trigger entries where you are planning to add funds.
The chart will show you based on all this information how much funds you would have required to exit in profit and rescue the deal in green.
It will also flag if the exit strategy would have failed by plotting a red label indicating all the times where the TP wouldn't have been reached.
Comments
Adding funds to a red deal and making it worst is one of the worst nightmares of traders using dollar-cost-average strategies.
I hope this script can help you visualise better and practice adding funds in a safe chart before ever jumping into real-money!
If you guys like this script we can add more features in the future, just leave a comment if you have new ideas.

Jackrabbit.SR-ATR-DCAThis is a standalone version of the Support and Resistance/Average True Range paradigm for the Jackrabbit suite and modulus framework. This module does not have a signal line and does not support integration with other modules.
Support and Resistance and ATR are preset and tuned to very specific settings for maximum profitability.
The blue line is the current average price of the asset.
The red line is the deviation boundary. Price action must be below this line for buys to be signaled.
The green line is the take profit. Price action must be above this line for a sell signal to be generated.
Here is a list of the settings:
Buy method: DCA or Strategy. DCA allows the module to decide buys based upon the methodology (step, price). Strategy added to the average on the basis of a buy signal from the strategy, but only when it is below the deviation and is the most organic of dollar cost averaging.
Sell Method. Take profit or Steategy. Take Profit sells the asset as soon as the price action crosses above the take profit line. Strategy sells on the basis of a sell signal, but only if it is above the take profit. Selling never occurs at a loss, with the only exception being the exit point.
Methodolgy: Step or Price. Stepping allows a fixed and uniform averaging ant percise intervals of deviation. Price is a very aggressive approach that will drive the average down on the basis of the difference between the average and the current price action. The price methodology is VERY high risk.
Take Profit, which describes the average profit percent of the combined positions.
Deviation, which describes the percent boundary for which price action must drop before additional assets are purchased.
Sideways Breaker: This algorithm breaks the sideways rut by forcing a purchase after X days, minimum 1 day.
Exit Position: Internal stop loss expressed in the number of buys.
It is important that when you establish your sell signal, ALL positions must be sold to ensure the average profit. If required, use a CLOSE ALL message provided by your platform. Also, any platform specific DCA or Safety Orders will cause losses as this script can not track their value. It is recommended that these features not be used.
This script is by invitation only. To learn more about accessing this script, please see my signature or send me a PM. Thank you.

Bitcoin Difficult Model [ChuckBanger]Simple script that graphically represents the mining difficulty of Bitcoin. It is ment to be used as a tool to decide when it is good time to dollar cost average (DCA) in your Bitcoin hodl position. When Price is below the difficulty model it is usually a good time to DCA.
Formula for the model used in this calculation is 0.002 * difficulty ^ 0.51. It is possible to change this numbers if necessarily.

Cyatophilum Scalper [ALERTSETUP]This indicator comes with a backtest and alert version. This is the alert version. Its purpose is to create low timeframe and scalping strategies, by choosing from a list of built-in entry points which are described in detail below, and by configuring a risk management system to your liking.
Before diving into the entry points, I will explain the strategy and risk management settings.
These 3 settings allow to choose your strategy direction, and main behavior.
- Go Long ↗: activate or deactivate long entry points.
- Go Short ↘: activate or deactivate short entry points.
- Reversal strategy ↗↘↗↘: Activate this option will allow trades to reverse position from an opposite entry point. Keep it deactivated and trades will either wait a TakeProfit(TP) or StopLoss(SL) to be closed. When neither SL nor TP or set, this option is automatically activated.
StopLoss settings:
Both Long and Short SL can be activated and configured.
The base % price is the starting point of the stoploss, in a percentage of current price.
Trailing stop, when activated, works with 2 settings:
- % Price to Trigger: a percentage of current price the price should move in a bar to trigger a trailing movement.
- % Price Movement: the stoploss variation in a percentage of current price that moves on each bar.
TakeProfit settings:
Both Long and Short TP can be activated and configured.
The base % price is the value of the TP, in a percentage of current price.
Trailing Profit Deviation %: Percent deviation for the trailing take profit.
DCA:
DCA stands for Dollar Cost Average. The idea is to open additional orders from the base order so as to improve risk management.
These additional orders are also called Safety Orders. The indicator can handle up to 9 safety orders.
The strategy will exit either from a take profit based on percentage from base order or from a total volume percentage (Configurable in the parameters).
The steps spacing (space between each step) and safety orders volume (order size) can both scale by adding a scale multiplier.
By choosing from the base strategy dropdown menu, the indicator will generate entry points.
1. BUY SELL:
-> Low timeframes spot trading, with simple buy and sell orders.
How it works:
The indicator used is a combination of QQE (Atr based trend following indicator) and RMA 100 trendline.
I think the QQE does a great job in low timeframes because it is not impacted by the noise.
The RMA which is the moving average used in the RSI, will help giving confirmation to the entry points.
How to use:
It is meant to be used as a reversal strategy, but you can add a TP or SL if you want.
When comparing to Buy & Hold, make sure to deactivate the "Short results in the backtest" setting.
2. TREND SCALPING
-> A strategy for low timeframes trading.
How it works:
The strategy creates high volatility entries filtered by a duo convergence of adaptive trendlines (Adaptive HULL MA using the chart's resolution, Adaptive Tilson T3 using 1H resolution) and a higher timeframe (1H) RSI filter (long threshold: 70, short threshold: 40, RSI length: 10).
How to use:
Must be used on charts with a resolution smaller than 1H. Recommended: from 1m to 30m.
Must NOT be used as reversal strategy. Use it with a take profit and stop loss, and DCA if you can.
Sample risk management settings:
3. Support/Resistance BREAKOUTS
-> Trade low timeframes pivot points breakouts.
How it works:
The indicator calculates the 100 previous bars swing high and low. Any break above high or below low will trigger an entry point.
The entry is however filtered by an Adaptive Tilson T3 Trendline, an ADX 30 minimum threshold and a minimum average volume threshold.
How to use:
I recommend to click "Reversal" Strategy and set a Takeprofit target.
Find the best timeframe between 1m and 30m using the backtest version.
Example here with BTCUSDTPERP on 15m:
4. AGGRESSIVE SCALPING
-> Lots of trades in low timeframes.
How it works:
Created using Cyato AI, Higher/Lower Highs and Lows and 2 HULLMA crosses as entries, and 2 Adaptive Tilson T3 as trendfilter, a 25 ADX threshold filter and a volume filter.
How to use:
Recommended Risk Management settings: Takeprofit, Stoploss and DCA (Safety orders).
Find which timeframe work the best from 30 min and below. Should not be used above 30 min since this is the resolution for the MTF Tilson.
How to create Alerts:
Click Add alert, then select the indicator, and choose the alert for your order.
Most used alerts are "LONG ENTRY", "SHORT ENTRY" and "ALL EXITS".
You will find a description of each alert in the default alert message.
To gain access to this paid indicator, please use the link below.

DCA CalculatorDollar Cost Averaging (DCA) is a strategy used to invest fixed amounts of money over given time intervals. It is typically used to grow an asset over time, while also reducing the risk that comes with volatility of the market.
This script was made to help make it easier to calculate Take Profit (%) when using Safety Orders on 3Commas. By using safety orders you can average down your initial investment which in turn brings down your Profit Target. A couple of the settings should look familiar if you've used 3Commas Bots before.
Input Settings
Bot Type: Select whether you are using a "Long" or "Short" bot.
Entry Price: Set this to your positions initial Entry Price.
Take Profit (%): Set this to the profit percent you are targeting.
Base Order Size: Order amount of your initial Entry.
Safety Order Size: Order amount of your first Safety Order.
Price Deviation (%): Step in percent from your initial order. This will be the deviation % of your first safety order
Safety Trades Count: Total number of safety orders to be used. Max value is currently 10.
Volume Scale: Volume of each additional safety order is multiplied by this value.
Step Scale: Step between each additional safety order is multiplied by this value.
Trading Fee (%): A fee is applied for each order that gets placed, then the total of those fees is added to the Take Profit (%). The trading fee depends on your exchange, but is typically between (0.1 to 0.15%).
Manual Safety Orders: For the manual safety orders, the checkbox will enable that specific safety order. You can set the "Entry Price" and "Order Size" of each one individually.

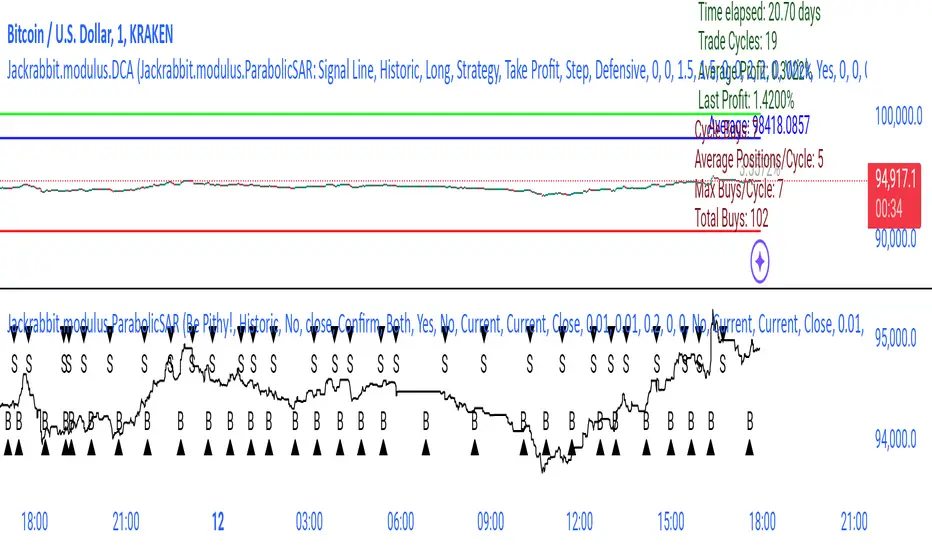
Jackrabbit.modulus.DCAThis is the Dollar Cost Averaging (DCA) for the Jackrabbit suite and modulus framework.
The blue line is the current average price of the asset.
The red line is the deviation boundary. Price action must be below this line for buys to be signaled.
The green line is the take profit. Price action must be above this line for a sell signal to be generated.
Here is a list of the settings:
Buy method: DCA or Strategy. DCA allows the module to decide buys based upon the methodology (step, price). Strategy added to the average on the basis of a buy signal from the strategy, but only when it is below the deviation and is the most organic of dollar cost averaging.
Sell Method. Take profit or Steategy. Take Profit sells the asset as soon as the price action crosses above the take profit line. Strategy sells on the basis of a sell signal, but only if it is above the take profit. Selling never occurs at a loss, with the only exception being the exit point.
Methodolgy: Step or Price. Stepping allows a fixed and uniform averaging ant percise intervals of deviation. Price is a very aggressive approach that will drive the average down on the basis of the difference between the average and the current price action. The price methodology is VERY high risk.
Take Profit, which describes the average profit percent of the combined positions.
Deviation, which describes the percent boundary for which price action must drop before additional assets are purchased.
Sideways Breaker: This algorithm breaks the sideways rut by forcing a purchase after X days, minimum 1 day.
Exit Position: Internal stop loss expressed in the number of buys.
It is important that when you establish your sell signal, ALL positions must be sold to ensure the average profit. If required, use a CLOSE ALL message provided by your platform. Also, any platform specific DCA or Safety Orders will cause losses as this script can not track their value. It is recommended that these features not be used.
The Jackrabbit modulus framework is a plug in play paradigm built to operate through TradingView's indicator on indicatior (IoI) functionality. As such, this script receives a signal line from the previous script in the IoI chain, and evaluates the buy/sell signals appropriate to the current analysis.
This script is by invitation only. To learn more about accessing this script, please see my signature or send me a PM. Thank you.
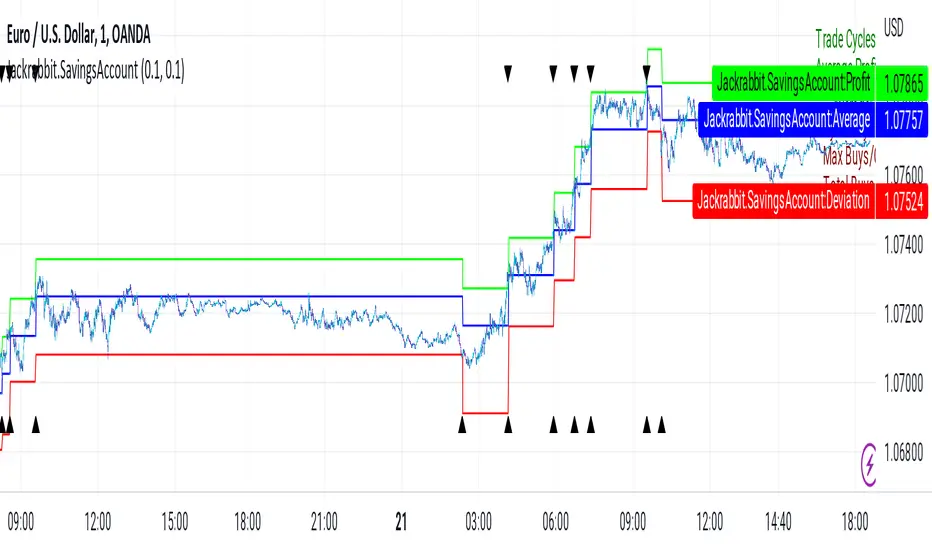
Jackrabbit.SavingsAccountThis is the Jackrabbit Savings Account. This script is designed to mimick a standard savings account and generate small amounts of profit of a daily basis. This script implements a form of dollar cost averageing (DCA) that uses a price deviation methodology.
Its primary principle is based upon my "failsafe" blueprint, which is tailored to people with little or no experience in cryptocurrencies.
This algorithm is NOT designed to win every trade, only profit from the average.
The blue line is the current average price of the asset.
The red line is the deviation boundary. Price action must be below this line for buys to be signaled.
The green line is the take profit. Price action must be above this line for a sell signal to be generated.
There are only two settings:
Take Profit, which describes the average profit percent of the combined positions, and
Deviation, which describes the percent boundary for which price action must drop before additional assets are purchased.
It is important that when you establish your sell signal, ALL positions must be sold to ensure the average profit. If required, use a CLOSE ALL message provided by your platform. Also, any platform specific DCA or Safety Orders will cause losses as this script can not track their value. It is recommended that these features not be used.
This is a standalone module and not compatible with other Jackrabbit modulus components.
This script is by invitation only. To learn more about accessing this script, please see my signature or send me a PM. Thank you.
msoro daily DCATool to estimate PnL of your investment if you put in a fixed $ amount daily into btc for past year. It takes input as 365 days which can be changed as per need.

BEST Dollar Cost AverageHello traders
This is an upgraded version of my Dollar Cost Average (Data Window) script
1 - What is Dollar-Cost Averaging ( DCA )?
Dollar-Cost Averaging is a strategy that allows an investor to buy the same dollar amount of investment at regular intervals. The purchases occur regardless of the asset's price.
I hope you're hungry because that one is a biggie and gave me a few headaches. Happy that it's getting out of my way finally and I can offer it
🔸 This indicator will analyze for the defined date range, how a dollar-cost average ( DCA ) method would have performed (green panel) versus investing all the hard earnt money at the beginning (orange panel)
=> green versus orange
2- What's on the menu today?
My indicator works with all asset classes and with the daily/weekly/monthly inputs.
⚠️⚠️⚠️ However, results are only visible on the DAILY timeframe chart
As always, let's review quickly the different fields so that you'll understand how to use it (and I won't get spammed with questions in DM ^^)
🔸 Use current resolution: if checked will use the resolution of the chart
🔸 The timeframe used for DCA: different timeframe to be used if Use current resolution is unchecked
🔸 Amount invested in your local currency: The amount in Fiat money that will be invested at each period selected above
🔸 Starting Date
🔸 Ending Date
🔹 The script screenshot shows a DCA with 100 USD invested daily from 01.01.2017 to 01.28.2020
3- Bonus (DATA WINDOW)
🔸 Please check this screenshot to understand what you're supposed to see: Data window
And a quick video that I did months ago explaining how we can use this data window effectively
4 - Specifications used
I got the idea from this website dcabtc.com and the result shown by this website and my indicator are very interesting in general and for your own trading
The formula used for the DCA calculation is the one from the Investopedia website.
Best regards and best of luck
Dave

Dollar Cost Average IndicatorRisk indicator to determine best time to enter (and exit) position based on EMAs. Both long term (default) and short term available.
