Dollar Cost Average (Data Window Edition)Hi everyone
Hope you had a nice weekend and you're all excited for the week to come. At least I am (thanks to a few coffee but that still counts !!!)
This indicator is inspired from Dollar-Cost-Average-Cost-Basis
EDUCATIONAL POST
The educational post is coming a bit later this afternoon explaining how to use the indicator so I would advise to follow me so that you'll get updated in real-time :) (shameless self-advertising)
1 - What is Dollar-Cost Averaging (DCA)?
Dollar-Cost Averaging is a strategy that allows an investor to buy the same dollar amount of an investment on regular intervals. The purchases occur regardless of the asset's price.
I hope you're hungry because that one is a biggie and gave me a few headaches. Happy that it's getting out of my way finally and I can offer it
This indicator will analyse for the defined date range, how a dollar cost average (DCA) method would have performed vs investing all the hard earnt money at the beginning
2- What's on the menu today ?
Please check this screenshot to understand what you're supposed to see : CLICK ME I'M A SCREENSHOT (I'll repeat this URL one more time below as I noticed some don't read the information on my description and then will come pinging me saying "sir me no understand your indicator, itz buggy sir"
(yes I finally thought about a way to share screenshots on TradingView, took me 4 weeks, I'm slow to understand things apparently)
My indicator works with all asset classes and with the daily/weekly/monthly timeframes
As always, let's review quickly the different fields so that you'll understand how to use it (and I won't get spammed with questions in DM ^^)
- Use current resolution : if checked will use the resolution of the chart
- Timeframe used for DCA : different timeframe to be used if Use current resolution is unchecked
- Amount invested in your local currency : The amount in Fiat money that will be invested at each period selected above
- Starting Date
- Ending Date
- Select a candle level for the desired timeframe : If you want to use the open or close of the selected period above. Might make a diffence when the timeframe is weekly or monthly
3 - Specifications used
I got the idea from this website dcabtc.com and the result shown by this website and my indicator are very interesting in general and for your own trading
The formula used for the DCA calculation is that one : Investopedia Dollar Cost Average
4 - How to interpret the results
"But sir which results ??"...... those ones : CLICK ME I'M A SCREENSHOT :) (strike #2 with the screenshot)
It will draw all the plots and will give you some nice data to analyze in the Data Window section of TradingView
I'm not completely satisfied with the tool yet but the results are very closed to the dcabtc website mentioned above
If you're trading a very bullish asset class (who said crypto ?), it's very interesting to see what a DCA strategy could bring in term of performance. But DCA is not magic, there is a time component which is the day/week/month you'll start to invest (those who invested in crypto beginning of 2018 in altcoins know what I'm talking about and ..............will hate me for this joke)
5 - What's next ?
As said, the educational post is coming next but not only.
Will probably post a strategy tomorrow using this indicator so that you can compare what's performing best between your trading and a dollar cost average method
I'll publish as a protected source this time a more advanced version of that one including DCA forecasts
6 - Suggested alternative (but I'll you doing it)
If you don't want to have this panel in the bottom with the plots and analyze the results in the data window, you can always create an infopanel like shown here Risk-Reward-InfoPanel/ and display all the data there
Hope you'll like it, like me, love it, love me, tip me :)
____________________________________________________________
Feel free to hit the thumbs up as it shows me that I'm not doing this for nothing and will motivate to deliver more quality content in the future. (Meaning... a few likes only = no indicators = Dave enjoying the beach)
- I'm an offically approved PineEditor/LUA/MT4 approved mentor on codementor. You can request a coaching with me if you want and I'll teach you how to build kick-ass indicators and strategies
Jump on a 1 to 1 coaching with me
- You can also hire for a custom dev of your indicator/strategy/bot/chrome extension/python
Dollarcostaverage

Dollar Cost Average [lorencip]This indicator shows the return of a dollar cost average strategy.
The 4 values in the output are:
the amount of the investment
the number of items purchased for that symbol
the total value of the items purchased
the result of the investment in percentage
This first version works with cryptocurrencies and currencies, it's not accurate for stocks (it "purchases" decimals of a share/stock).
Lorenzo Cipriani

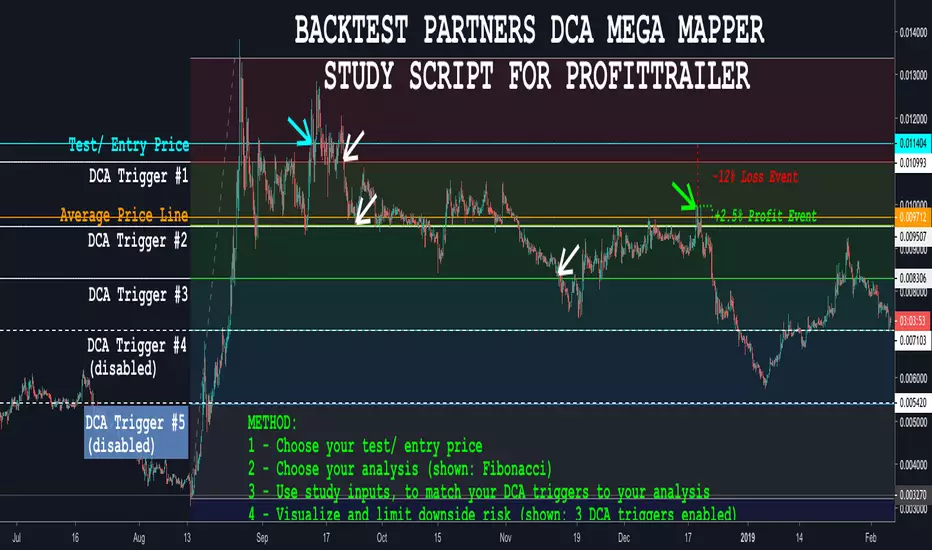
BACKTEST PARTNERS DCA MEGA MAPPER STUDY SCRIPT FOR PROFITTRAILERBacktest Partners Mega Mapper (BPMM) is an advanced DCA analysis script, allowing cryptocurrency traders to sync their ProfitTrailer trading bot buy levels, triggers and order sizes with their technical analysis charting results in TradingView.
For a complete functional demo, and to learn more about subscribing to this invite-only script, please visit us at backtest.partners
QFT Crypto Bottom Feeder v2I use this indicator for testing with alerts and Autoview for buy signals. There are no sell signals, so that is entirely up to you. The goal is to catch the bottoms of small swings buy layering in. You can adjust the base sensitivity as well as how far down it's looking to buy. The buy plots are absolute locations - so where they lie, is where the buy signal alert will fire. Autoview will attempt to place a trade at the time of the alert. The goal here is to buy under the base and sell on the way up or at the support level.
How you use this is entirely up to you. I just play around with these alert signals for testing profitability. If you use this for buying alerts, you're using them at your own risk.
The average base crack % is going to be the lowest layer shown, and the other layers will go up from there. There are 5 layers.
Example: Average Base Crack is 5%
Layer1 = 1% , Layer2 = 2%, Layer3 = 3%, layer 4 = 4%, layer 5 = 5%
Example2: Average Base Crack is 10%
Layer1 = 2%, layer2 = 4%, layer3 = 6%, layer4 = 8%, layer5 = 10%
