UP & DOWN VOLUMEIndicator draws UP & DOWN VOLUME for both NYSE and NASDAQ - just choose the appropriate exchange in settings.
DVOL

Exchange Down / Up Volume RatioI attended some workshop yesterday and I noticed that one of the presenters had an indicator titled 'price ratio' and had DVOL and UVOL as the inputs.
From some deduction, I see that it was basically looking at the ratio of down by up volume on the NYSE exchange; he had a few levels marked as well (which I've also marked on this indicator).
Seems like an interesting metric to consider, basically used to get a rough idea of the short term sentiment of the masses; allowing one to see when selling is outpacing buying in pure volume traded on an exchange.
I've added a few other exchanges to allow for quick switch between the majors with this info readily available on TradingView.
Supported inputs are: AMEX, NYSE, NASDAQ, ALL (must be in caps)
All is the sum of the NYSE, AMEX, and NASDAQ exchange volume.
The standard trading view disclaimer applies to this post -- please consult your own investment advisor before making investment decisions. This post is for observation only and has no warranty etc. www.tradingview.com
Best,
JM

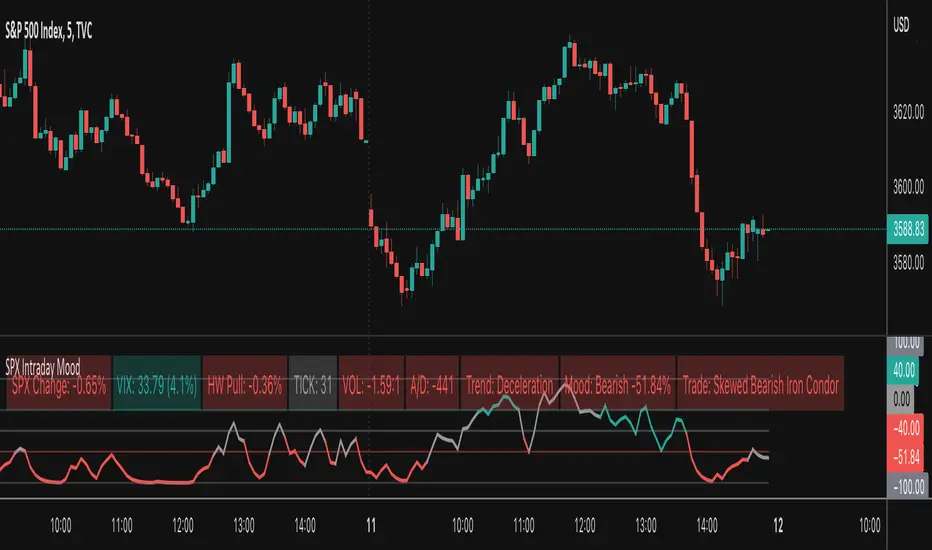
SPX Intraday Mood IndicatorThe SPX Intraday Mood Indicator tries to gauge the intraday market direction of the S&P 500 (SPX) by focusing on internal market data.
Based on the 0DTE Mood Indicator concept. Overall strength/weakness is converted into a directional Mood Percentage which can help with choosing a trade type.
Use at your own risk and discretion. Potential trade ideas offer no guarantees. Intraday Charts Only. Turn off extended hours data. Only works on SPX.
This first version is untested and I am only sharing it to gather feedback on its accuracy, use at your own risk.
UVOL DVOL Strength and Stagnant HistogramI liked the style of one of Noldo's scripts pertaining to Put/Call ratio so I adapted my existing UVol / DVol ratio script using his code from
I am also reducing the number of securities referenced to only Nasdaq which speeds up displaying
The yellow bars are meant to represent stagnant volume, with green / red representing strong up or down volume.
Note the indicator will display the same no matter which individual stock you are watching since it uses UVol and DVol from the whole Nasdaq exchange NOT the stock or security you are currently viewing.

UVOL / DVOL RatioPlots the NYSE, NASDAQ, AMEX UP Volume and DOWN Volume ratios as a histogram - and adds the index UVOL / DVOL ratios as a line graph.
DVOL is represented as negative - UVOL as positive. When either is above 2 its a good predictor of the day's outcome. At least - it tells you if the bulls or bears are winning the day.
Really simple to use / edit to your needs
Enjoy
