VAMA Volume Adjusted Moving Average FunctionThis indicator is a live analysis adaptation of Richard Arms' Volume Adjusted Moving Average coded as a single function. VAMA utilizes a period length that is based on volume increments rather than time. Settings are provided for using as a pair of fast and slow moving averages.
• SampleN - N volume bars used as sample to calculate average volume , 0 equals all bars.
• VAMA Source - Price used for volume weighted calculations.
• VAMA Length - Specified number of volume ratio buckets to be reached.
• VAMA VI Fct - Size of volume ratio buckets.
• VAMA Strict - Must meet desired volume requirements, even if number of bars has to exceed VAMA Length to do it.
Please see previous published example here for more details on VAMA's usage and inability to redraw the past on time based charts.
NOTICE: This is an example script and not meant to be used as an actual strategy. By using this script or any portion thereof, you acknowledge that you have read and understood that this is for research purposes only and I am not responsible for any financial losses you may incur by using this script!
Indicators and strategies

Funamental and financialsEarnings and Quarterly reporting and fundamental data at a glance.
A study of the financial data available by the "financial" functions in pinescript/tradingview
As far as I know, this script is unique. I found very few public examples of scripts using the fundamental data. and none that attempt to make the data available in a useful form
as an indicator / chart data. The only fitting category when publishing would be "trend analysis" We are going to look at the trend of the quarterly reports.
The intent is to create an indicator that instantly show the financial health of a company, and the trends in debt, cash and earnings
Normal settings displays all information on a per share basis, and should be viewed on a Daily chart
Percentage of market valuation can be used to compare fundamentals to current share price.
And actual to show the full numbers for verification with quarterly reporting and debuggging (actual is divided by 1.000.000 to keep numbers readable)
Credits to research study by Alex Orekhov (everget) for the Symbol Info Helper script
without it this would still be an unpublished mess, the use of textboxes allow me to remove many squiggly plot lines of fundamental data
Known problems and annoyances
1. Takes a long time to load. probably the amount of financial calls is the culprit. AFAIK not something i can to anything about in the script.
2. Textboxes crowd each other. dirty fix with hardcoded offsets. perhaps a few label offset options in the settings would do?
3. Only a faint idea of how to put text boxes on every quarter. Need time... (pun intended)
Have fun, and if you make significant improvements on this, please publish, or atleast leave a comment or message so I can consider adding it to this script.
© sjakk 2020-june-08

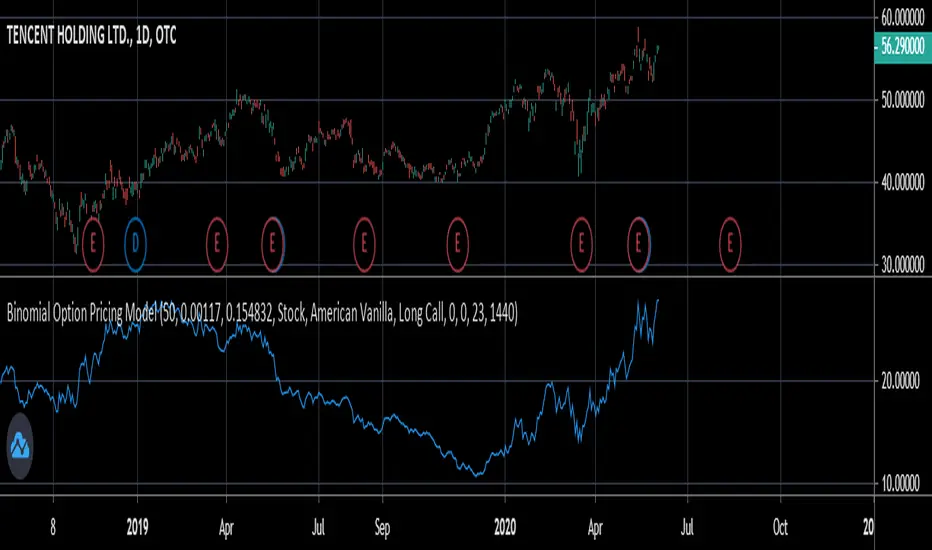
Binomial Option Pricing ModelA binomial option pricing model is an option pricing model that calculates an option's price using binomial trees. The BOPM method of calculating option prices is different from the Black-Scholes Model because it provides more flexibility in the type of options you want to price. The BOPM, unlike the BS model typically used for European style options, allows you to price options which have the ability to exercise early, such as American or Bermudan options. Although you can use the BOPM for any option style.
This specific model allows you to price both American and European vanilla options.
The way the BOPM calculates option prices is by:
First, dividing up the time until expiry into equal parts called steps. This specific model presented only uses 2 steps. For example, say you have an option with an expiry of 60 days, and your binomial tree has only two steps. Then each step will contain 30 days.
Second, the model will project the expected price of the underlying at the end of each step, called a node. The expected price is calculated by using the underlying's volatility and projecting what the price of the underlying would be if it were to rise and fall. This step is repeated until the terminal node, aka the end of the tree, is reached.
Third, once the terminal node's expected underlying prices are calculated, their expected option prices must be calculated.
Finally, after calculating the terminal option prices, backwards induction must be used to calculate the option prices at the previous nodes, until you reach Node 0, aka the current option price.
In order to use this model:
1st. Enter your option's strike price.
2nd. Enter the risk-free-rate of the currency the option is based in.
3rd. Enter the dividend yield of the underlying if it's a stock, or the foreign risk-free-rate if it's an FX option.
*For example, if you were trading an AAPL stock option, in the risk-free-rate box mentioned in step 2, you would enter the US risk-free-rate because AAPL options are traded in US dollars. In the dividend yield box mentioned in step 3, you would enter the stock's dividend yield, which for AAPL is 0.82.
*If you were, for example, trading an option on the EUR/JPY currency pair, the risk-free-rate mentioned in step 2, would be the Japanese risk-free-rate. Then in the the dividend yield box from step 3, you'd input the Eurozone risk-free-rate.
*If you were trading an options on futures contract, the risk-free-rate mentioned in step 2, would be the risk-free-rate for whatever currency the futures contract is denominated in. For example EUR futures are denominated in USD, so you would input the US risk-free-rate. Meanwhile, something like FTSE futures are denominated in GBP, so you would input the British risk-free-rate. As for the dividend yield box mentioned in step 3, for all options on futures, enter 0.
4th. Pick what type of underlying the option is based on: stock, FX, or futures.
5th. Pick the style of option: American or European.
6th. Pick the type of option: Long Call or Long Put.
7th. Input your time until expiry. You can express this in terms of days, hours, and minutes.
8th. Lastly, input your chart time-frame in term of minutes. For example, if you're using the 1 min time-frame enter 1, 4hr time-frame enter 480, daily time-frame enter 1440.
*Disclaimer, because this particular model only uses 2 steps, it won't work on stocks with high prices (over $100). If you want to use this on stocks with prices greater than $100, you would need to add more steps to the code, shown below. The model in its current form should work for stocks below $100.
Bayesian BBSMA OscillatorSometime ago (very long ago), one of my tinkering project was to do a spam or ham classification type app to filter news I'd wanna read. So I built myself a Naive Bayes Classifier to feed me my relevant articles. It worked great, I can cut through the noise.
The hassle was I needed to manually train it to understand what I wanna read. I trained it using 50 articles and to my surprise, it's enough.
Complexity Theory
I've been reading a book called The Road to Ruin by Jim Rickards. He described how he got to his conclusion of how the stock market works by using Complexity Theory. Bill Williams would agree. Jim tells us that by using just enough data, we calculate the probability of an event to occur. We can't say for sure when but we know it's coming. This was my light bulb moment.
While Jim talks much about Bayesian Inference in which a probability of an event can always be updated as more evidence comes to light, I had my eyes set on binary probabilities of when prices are going up and down.
Assumptions
These are my assumptions:
Prices breaking up a Bollinger basis line will have fuel to go up even higher
Prices will go down when prices have broken up a Bollinger upper band
Scalping is the main method so we should use a lower period Moving Average (MA)
When prices are above MA, it's likelier a correction to the downside is imminent
When prices are below MA, it's likelier a correction to the upside is imminent
Optimize parameters for 1 hour timeframe which will give us time to react while still having more opportunities to trade
Building Blocks
Jim Rickards started with limited data (events) while in technical trading, data are plentiful. I decided to classify 2 events which are:
Next candles would be breaking up
Next candles would be breaking down
Key facts:
We won't know for sure when prices are going to break
We won't know for sure how much the prices movements are going to be
Formulas
Breaking up:
Pr(Up|Indicator) = Pr(Indicator|Up) * Pr(Up) / Pr(Indicator|Up) * Pr(Up) + Pr(Indicator|Down) * Pr(Down)
Breaking down:
Pr(Down|Indicator) = Pr(Indicator|Down) * Pr(Down) / Pr(Indicator|Down) * Pr(Down) + Pr(Indicator|Up) * Pr(Up)
Reading The Oscillator
Green is the probability of prices breaking up
Red is the probability of prices breaking down
When either green or red is flatlining ceiling, immediately on the next candle when the probability decreases go short or long based on which direction you're observing - Strong Signal
When either green or red is flatlining ceiling, take no action while it's ceiled
Usually when either green or red is flatlining bottom, the next candle when the probability increases, immediately take a short long position based on the direction you're observing - Weak Signal
When either green or red is flatlining bottom, take no action while it's bottomed
Alerts
Use Once per Bar option when generating alerts.

BTC difficulty adjustmentsDraws background columns indicating BTC difficulty adjustments
Green = positive adjustments
Red = negative adjustments
Use Threshold mode and Threshold to look for adjustments larger or equal to Threshold value
Use on DAILY timeframe

Time Range StatisticsA good amount of users requested a text box showing various price statistics, the following script returns various of these stats in a user-selected range, and include classical ones such as a central tendency measurement (mean), dispersion (normalized range) and percent change, but also include less common statistics such as average traded volume and number of gaps. The script also calculates the correlation between the closing price and another user-selected instrument.
The script is currently the longest one I ever made and took some efforts, as I wasn't satisfied with the statistics to be originally included. Big thx to Gael for the enormous feedback and the idea of the normalized range, to user @Cookiecrush for the feedback ( without ya I would have posted something bad you know umu ? ), and Lulidolce for the support, friendship is magic!
Selected Range
The setting Start determine the bar at which the range starts, while End determine at which bar the range end. To help you select these values, the current bar number (bar index) is displayed at the right of the indicator title in blue.
The setting evaluate to last bar will use a range starting at Start and ending at the last bar, as such you can use a full range by using Start = 0 and select evaluate to last bar
The range is highlighted by an area on the chart. By default Start = 9000 and End = 10000, you might not have this amount of data in your chart, as such use the displayed bar index to select Start and End, then set the settings as default.
Displayed Statistics
The statistics panel is displayed on the right side of the last bar, the panel has 3 sections, a title section who shows the symbol ticker, timeframe, and overall trends represented by a chart emoji, the overall trends are determined by comparing the number of higher highs with the number of lower low.
Below are displayed the date ranges with time format: year/month/day/hour:minute.
The second section shows the general statistics. The first one is the mean, also represented by the orange line in the chart, the blue line displayed represent the highest price value in the range, while the red one represents the lowest price value.
The second stat is the normalized range, and determine how spread is the price in the user-selected range, why not the standard deviation? Because the standard deviation might return results varying widely depending on the scale of the closing price, you could get measures such as 0.0156 or 16 or even 56 depending on the instrument, as such using a normalized range can be more appropriate as it lays in a range of (0,1). Lower values indicate a low degree of price variation. Note that I still want to find another measure in the future.
The percentage change (or relative change) indicates at which percentage the price has increased or decreased, and is calculated by subtracting the closing at bar Start with the price at bar End , divided by the price at bar End , the result is then multiplied by 100.
The average traded volume calculate the mean of the volume in the selected range, I used the same format used by the original volume indicator for clarity.
Finally, the last stats of the section is the number of gaps, this stat is by default hidden. An up gap is detected when the open price is superior to the previous high, while a down gap is detected when the open price is inferior to the previous low, this allow to only retain significant gaps.
The last section of the indicator panel shows the correlation between the closing price and another instrument, by default GOOG, this correlation is also calculated within the user-selected range. Positive values indicate a positive relationship, that is the two instruments tend to move in the same direction. Negative values indicate a negative relationship, both instruments tend to move in a direction opposite to each other. Values closer to 1 or -1 indicate a stronger relationship, while values closer to 0 indicate no relationship.
In Summary
The script shows various stats, each calculated within a user-selected range, in general one would be more interested in how these stats might evolve with time, but checking them in a custom range can be quite interesting.
Thx for reading. umu

ATR Based Trendlines - JDThis script draws trendlines from the pivot points in the price chart.
The angle of the trendlines is determined by (a percentage of) the atr.
The angle follows the change in price, dictated by the atr at the moment where the pivot point is detected.
The atr percentage determines if the trendline follows the rate of change of the atr or a fraction ( value < 100) or a multiple ( value > 100) of that
JD.
#NotTradingAdvice #DYOR
Disclaimer.
I AM NOT A FINANCIAL ADVISOR.
THESE IDEAS ARE NOT ADVICE AND ARE FOR EDUCATION PURPOSES ONLY.
ALWAYS DO YOUR OWN RESEARCH!

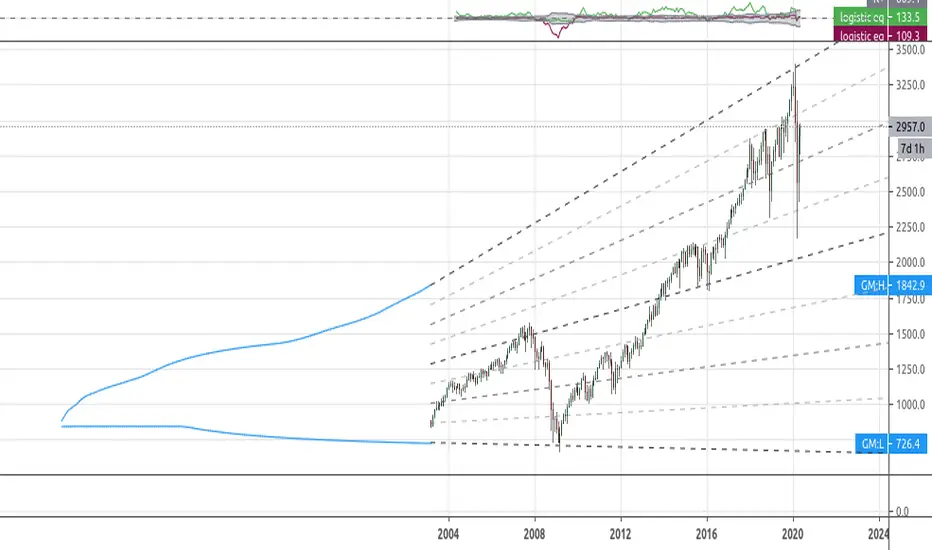
[RS]Simplistic Automatic Growth ModelsExperimental:
Automatic growth model generated from history..
note: you may need to scroll back to 1st bar to load data.
Revolution Volatility Bands With Range Contraction Signal VIIAlso one of my favorite indicators. Very simple and easy to use. Essentially volatility bands with a technical analysis pattern, the triangle/wedge, which I have called "contraction signal". Put simply: When price is written in blue, volatility overall is falling. When the outer bands start to fatten up in blue, a contraction signal is forming. Works with any length of your choosing.

Reminder Message (with color picker) - ApopheniaPaysThis is a very simple script. It displays a message above the latest price. I coded it because I need a constant reminder to keep me from overtrading.
You can customize several options:
- The message text
- How high above the latest price the message is displayed
- How often it is displayed. 1=display constantly, 2=only show it during every other period, 3=only show it every 3rd new period, etc. So, for example, if you are on the 15 minute chart, and set a frequency of 3, it will show it for the first 15 minutes out of every 45.
- Color and lightness. This can be used as an example of how to add a color selection input to your own scripts.

Mawreez' RSI Divergence DetectorThe idea behind this indicator is to have an expression for the amount of divergence on a given chart at every point in time . To achieve this, it adds up the magnitudes any valid divergence of any kind; bullish, bearish or their hidden variants. Where a valid divergence consists of a line on the source series (almost always the closing price), and a line on an oscillator (here: the RSI). The slopes of said lines must have opposite signs, that is to say, one line must be sloping up while the other slopes down. Said lines may not cross their respective series.
The length of the RSI is configurable (default length: 14). The lengths of the divergences are configurable (default: minimum length 3 and maximum length 28 - the latter being twice the default length of the RSI).
This indicator will detect divergences which are still building up. Be duly warned: upcoming divergences may still get invalidated. Another case that one should be very mindful of is that an upcoming divergence may still increase in magnitude before it plays out. Possibly over several more timesteps, there may even be entire additional drives.
The value of this indicator indeed reflects the magnitude of divergence on a chart. However, there is no reason to think the magnitude of a divergence affects the likelihood of said divergence playing out.
The color of the indicator indicates the kind of divergence. The default colors are
green for bullish divergence,
maroon (dark red) for bearish divergence,
lime/light green for hidden bullish divergence,
dark pink for hidden bearish divergence.
Please let me know if you would like to see a version of this indicator that plots both the RSI and this histogram. I will do this for personal use, but I am being a bit of a purist with this publication.
In fact, please don't hesitate to make any comment or to give any kind of suggestion.

Correlation Cycle, CorrelationAngle, Market State - John EhlersHot off the press, I present this "Correlation Cycle, CorrelationAngle, and Market State" multicator employing PSv4.0, originally formulated by Dr. John Ehlers for TASC - June 2020 Traders Tips. Basically it's an all-in-one combination of three Ehlers' indicators. This power packed triplet indicator, being less than a 100 line implementation at initial release, is a heavily modified version of the original indicator using novel techniques that surpass John Ehlers' original intended design.
This is also a profound script in numerous ways. First of all, these three indicators are directly from the illustrious mastermind himself Dr. John Ehlers. Secondarily, this is my "50th" script published on TV, which makes it even more significant. I'm especially proud of this script to "degrees" of imagination I once didn't know was theoretically possible in code. My intellect has once again been mathemagically unlocked pondering new innovations with this code revelation. Thirdly, this PSv4.0 script shows the empowering beauty and elegance of hacking the stock markets with TV's ultra utilitarian Pine Editor(PE) in a common browser! Some of you may be wondering if I worked on this for days... nope! This only took a few hours, followed by writing this description for another hour plus.
I have created many of Ehlers' indicators in PE, a few of which I have published in my profile, but I wanted to show how programming with Pine Script can be an artistic form of craftsmanship and poetry. None of this would be possible without the ingeniously minded Tradingview staff revolutionizing algorithmic trading at it's finest. If you should ever encounter them by chance, ponder humbly thanking these computing wizards for their diligence and dedication. They are providing, and shall award to us members, some of the most fascinating conceptualized tech imaginable in the coming future. I can assure you, much, much more is yet to be unveiled for us TV members/enthusiasts. Thank you TV and all you offer to this community.
As always, I have included advanced Pine programming techniques that conform to proper "Pine Etiquette" by example. There are so many Pine mastery techniques included, I don't have an abundance of time to elaborate on all of them. For those of you are code savvy, you may have notice I only used one "for" loop for increased server efficiency, instead of the two "for" loops in the original formulation. For those of you who are newcomers to Pine Script, this code release may also help you comprehend the immense "Power of Pine" by employing advanced programming techniques while exhibiting code utilization in a most effective manner. This is commonly what my dense intricate code looks like behind the veil. If you are wondering why there is hardly any notes, that's because the notation is primarily in the variable naming.
Features List Includes:
Dark Background - Easily disabled in indicator Settings->Style for "Light" charts or with Pine commenting
AND a few more... Why list them, when you have the source code!
The comments section below is solely just for commenting and other remarks, ideas, compliments, etc... regarding only this indicator, not others. When available time provides itself, I will consider your inquiries, thoughts, and concepts presented below in the comments section, should you have any questions or comments regarding this indicator. When my indicators achieve more prevalent use by TV members, I may implement more ideas when they present themselves as worthy additions. As always, "Like" it if you simply just like it with a proper thumbs up, and also return to my scripts list occasionally for additional postings. Have a profitable future everyone!


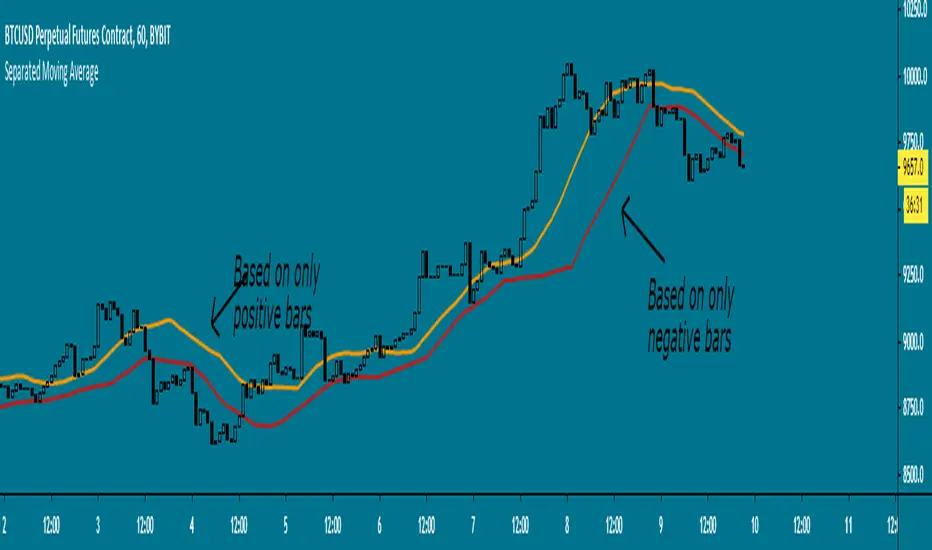
Separated Moving Average - evoHere are two moving averages, one based on positive candles and the other based on negative candles. If the current bar is positive, the negative MA will use its last known negative bar for the calculation. The default setting uses Heikin Ashi to smooth the candles with the trend, you can turn this off if you want in inputs.
Let me know if you find it useful :)
RedK_Supply/Demand Volume Viewer v1Background
============
VolumeViewer is a volume indicator, that offers a simple way to estimate the movement and balance (or lack of) of supply & demand volume based on the shape of the price bar. i put this together few years ago and i have a version of this published for another platform under different names (Directional Volume, BetterVolume) in case you come across them
what is V.Viewer
=====================
The idea here is to find a "simple proxy" for estimating the demand or supply portions of a volume bar - these 2 forces have the potential to affect the current price trend so we want an easy way to track them - or to understand if a stock is in accumulation or distribution - we want to do this without having access to Level II or bid/ask data, and without having to get into the complexity of exploring the lower timeframe price & volume data
- to achieve that, we depend on a simple assumption, that the volume associated with an up move is "demand" and the volume associated with a down move is "Supply". so we basically extrapolate these supply and demand values based on how the bar looks like - a full "green" price bar / candle will be considered 100% demand, and a full "red" price bar will be considered 100% supply - a bar that opens and closes at the same level will be 50/50 split between supply & demand.
- you may say this is a "too simple" of an assumption to make, but believe me, it works :) at least at the basic scenario we need here: i'm just exploring the volume movement and finding key levels - and it provides a good improvement compared to the classic way we see volume on a chart - which is still available here in VolumeViewer.
in all cases, i consider this to be work in progress, so i'd welcome any ideas to improve (without getting too complicated) - there's already a host of great volume-based indicators that will do the multi timeframe drill down, but that's not my scope here.
Technical Jargon & calculation
===========================
1. first we calculate a score % for the volume portion that is considered demand based on the bar shape
skip this part if it sounds too technical => if you're into coding indicators, you would probably know there are couple of different concepts for that algorithm - for example, the one used in Balance Of Power formula - which i'm a big fan of - but the one i use here is different. (how?) this is my own, ant it simply applies double weight for the "wick" parts of a price bar compared to the "body of the bar" -- i did some side-by-side comparison in past and decided this one works better. you can change it in the code if you like
2. after calculating the Bull vs Bears portion of volume, we take a moving average of both for the length you set, to come up with what we consider to be the Demand vs Supply - as usual, i use a weighted moving average (WMA) here.
3. the balance or net volume between these 2 lines is calculated, then we apply a final smoothing and that's the main plot we will get
4. being a very visual person, i did my best to build up the visuals in the correct order - then also to ensure the "study title" bar is properly organized and is simple and useful (Full Volume, Supply, Demand, Net Volume).
- i wish there was a way in Pine to hide a value that i still need to visually plot but don't want it showing its value on the study title bar, but couldn't find it. so the last plot value is repeated twice.
How to use
===========
- V.Viewer is set up to show the simplified view by default for simplicity. so when you first add it to a chart, you will get only the supply vs demand view you can see in the middle pane in the above chart
- Optional / detailed mode: go into the settings, and expose all other plots, you will be able to add the classic volume histogram, and the Supply / Demand lines - note these 2 lines will be overlay-ed on top of each other - this provides an easy way to see who is in control - especially if you change the display of these 2 lines into "area" style. This is what is showing in the lower pane in the above chart.
** Exploring Key Price Levels
- the premise is, at spots where there's big lack of balance, that's where to expect to find key price levels (support / resistance) and these price levels will come into play in future so can be used to set entry / exit targets for our trades - see the example in the AAPL chart where you can easily locate these "balance or reversal levels" using the tops/bottoms/zero-crossings from the Net Volume line
** Use for longer-term Price Analysis
- we can also use this simple indicator to gain more insights (at a high level) of the price in terms of accumulation vs distribution and if the sellers or buyers are in control - for example, in the above AAPL chart, V.Viewer tells us that buyers have been in control since October 19 - even during the recent drop, demand continued to be in play - compare that to DIS chart below for the same period, where it shows that the market was dumping DIS thru the weakness. DIS was bleeding red most of the time
Final thoughts
=============
- V.Viewer is an attempt to enhance the way we see and use Volume by leveraging the shape of the price bar to estimate volume supply & demand - and the Net between the 2
- it will work for stocks and other instruments as long as there's volume data
- note that V.Viewer does not track trend. each bar is taken in isolation of prior bars - the price may be going down and V.Viewer is showing supply going up (absorption scenario?) - so i suggest you do not use it to make decisions without consulting other trend / momentum indicators - of course this is a possible improvement idea, or can be implemented in another indicator, add in trend somehow, or maybe think of making this a +100 / -100 Oscillator .. feel free to play with these thoughts
- all thoughts welcome - if this is useful to you in your trading, please share with other trades here to learn from each other
- the code is commented - please feel free to use it as you like, or build things on top of it - but please continue to credit the author of this code :)
good luck!
-

Fancy Bollinger Bands [BigBitsIO]This script is for a Bollinger Band type indicator with as many features as I can possibly fit into a Bollinger Band type indicator.
Features:
- A single custom moving average serving as the middle band.
- Standard MA inputs.
- MA type.
- MA period.
- MA price.
- MA resolution (time frame).
- Visibility toggle.
- MA Candle Type
- Fancy MA inputs.
- Toggle to show only candles included in the MA calculation ("Highlight inclusion") or display entire MA history.
- Toggle to show a ghost trail when Highlight inclusion is toggled on. Displays a shaded version of past MA history before the inclusion period (as seen on snapshot).
- Toggle to show forecast values for the MA.
- Other inputs related to forecasting:
- Forecast bias. (Neutral forecasts MA if the current price remains the same.)
- Forecast period.
- Forecast magnitude.
- Toggle showing details on the screen
- Toggle the visibility of the fill between the upper and lower bands.
- Toggle to use ATR instead of the standard deviation to calculate the location of the upper and lower bands.
- Custom input for the ATR period.
A couple of quick notes. The label will only show up if toggled on, and will always show above the highest of either the candle high or upper band. The fill colors are based on the level of %B currently on the indicator. Higher levels are green, and brighter green, while lower levels are red and brighter red. The fill is lighter in shadow areas to reflect their status as not being included in the middle band calculation.
*** DISCLAIMER: For educational and entertainment purposes only. Nothing in this content should be interpreted as financial advice or a recommendation to buy or sell any sort of security or investment including all types of crypto. DYOR, TYOB. ***

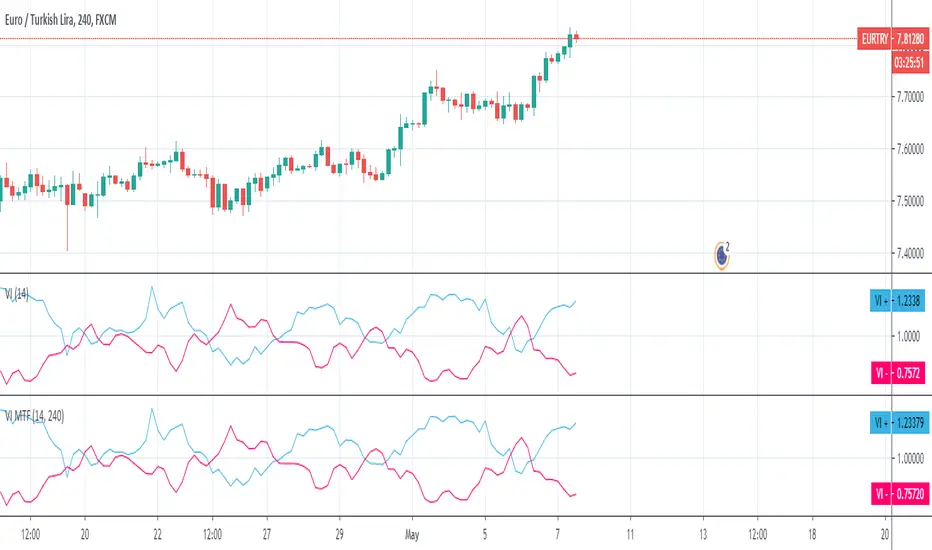
Vortex MTFUnderstanding Vortex Indicator (VI)
The vortex indicator was first developed by Etienne Botes and Douglas Siepman who introduced the concept in the January 2010 edition of “Technical Analysis of Stocks & Commodities.” The vortex indicator is based on two trendlines: VI+ and VI-.
What is the Vortex Indicator (VI)?
A vortex indicator (VI) is an indicator composed of two lines - an uptrend line (VI+) and a downtrend line (VI-). These lines are typically colored green and red respectively. A vortex indicator is used to spot trend reversals and confirm current trends.
Vortex Indicator Calculations
The calculation for the indicator is divided into four parts.
1. True range (TR) is the greatest of:
Current high minus current low
Current high minus previous close
Current low minus previous close
2. Uptrend and downtrend movement:
VM+ = Absolute value of current high minus prior low
VM- = Absolute value of current low minus prior high
3. Parameter length (n)
Decide on a parameter length (between 14 and 30 days is common)
Sum the last n period’s true range, VM+ and VM-:
Sum of the last n periods’ true range = SUM TRn
Sum of the last n periods’ VM+ = SUM VMn+
Sum of the last n periods’ VM- = SUM VMn−
4. Create the trendlines VI+ and VI-
SUM VMn+/SUM TRn = VIn+
SUM VMn-/SUM TRn = VIn−
Repeating this process daily forms the VI+ and VI- trendlines.
The traditional application of using VI- and VI+ crossovers can result in a number of false trade signals when price action is choppy. Increase the number of periods used in the indicator to reduce this, for example, using 25 periods instead of 14.
What is MTF?
Multiple Time Frame Analysis is the technique of analyzing several time frames of the same asset before entering a trade. This type of analysis is best done using a top-down approach, i.e. starting at a higher time frame and working your way down, via several lower time frames, until the execution time frame is reached where a trade could be entered. Traders who use this technique usually look at 3 or 4 different time frames to identify the general trend and find the best entries. They minimize their risk and improve the odds of success simply by taking the bigger picture into account. It can easily be combined with any trading strategy.
Time frames are usually several times apart. For example a day trader who trades hourly charts, could analyse the weekly (high time frame), the daily (7 times smaller), the 4 hour (6 times smaller) and finally the hourly time frame (execution time frame, 4 times smaller). TradingView has a chart layout feature with multiple charts per layout, so you can analyse an asset on multiple time frames under one tab in your browser.
Summary
With MTF, you can see the Vortex indicator values for a specific time period without changing the graph time period.
Stochastic Heat MapA series of 28 stochastic oscillators plotted horizontally and stacked vertically from bottom to top as the oscillator background.
Each oscillator has been interpreted and the value has been used to colour the lines in.
Lower lines are shorter term stochastics and higher lines are longer term stochastics.
The average of the 28 stochastics has been taken and then used to plot the fast oscillator line, which also has a slow oscillator line to follow.
The oscillator line can be used to colour in the candles.
Inputs:
MA: multiple smoothing methods
Theme: multiple colours
Increment: stochastic length start and increments
Smooth Fast: smooth fast length
Smooth Slow: smooth slow length
Paint Bars: colour candles
Waves: toggle method to weight/increment stochastics
Heat map shows momentum extremes:

Bar Balance [LucF]Bar Balance extracts the number of up, down and neutral intrabars contained in each chart bar, revealing information on the strength of price movement. It can display stacked columns representing raw up/down/neutral intrabar counts, or an up/down balance line which can be calculated and visualized in many different ways.
WARNING: This is an analysis tool that works on historical bars only. It does not show any realtime information, and thus cannot be used to issue alerts or for automated trading. When realtime bars elapse, the indicator will require a browser refresh, a change to its Inputs or to the chart's timeframe/symbol to recalculate and display information on those elapsed bars. Once a trader understands this, the indicator can be used advantageously to make discretionary trading decisions.
Traders used to work with my Delta Volume Columns Pro will feel right at home in this indicator's Inputs . It has lots of options, allowing it to be used in many different ways. If you value the bar balance information this indicator mines, I hope you will find the time required to master the use of Bar Balance well worth the investment.
█ OVERVIEW
The indicator has two modes: Columns and Line .
Columns
• In Columns mode you can display stacked Up/Down/Neutral columns.
• The "Up" section represents the count of intrabars where `close > open`, "Down" where `close < open` and "Neutral" where `close = open`.
• The Up section always appears above the centerline, the Down section below. The Neutral section overlaps the centerline, split halfway above and below it.
The Up and Down sections start where the Neutral section ends, when there is one.
• The Up and Down sections can be colored independently using 7 different methods.
• The signal line plotted in Line mode can also be displayed in Columns mode.
Line
• Displays a single balance line using a zero centerline.
• A variable number of independent methods can be used to calculate the line (6), determine its color (5), and color the fill (5).
You can thus evaluate the state of 3 different components with this single line.
• A "Divergence Levels" feature will use the line to automatically draw expanding levels on divergence events.
Features available in both modes
• The color of all components can be selected from 15 base colors, with 16 gradient levels used for each base color in the indicator's gradients.
• A zero line can show a 6-state aggregate value of the three main volume balance modes.
• The background can be colored using any of 5 different methods.
• Chart bars can be colored using 5 different methods.
• Divergence and large neutral count ratio events can be shown in either Columns or Line mode, calculated in one of 4 different methods.
• Markers on 6 different conditions can be displayed.
█ CONCEPTS
Intrabar inspection
Intrabar inspection means the indicator looks at lower timeframe bars ( intrabars ) making up a given chart bar to gather its information. If your chart is on a 1-hour timeframe and the intrabar resolution determined by the indicator is 5 minutes, then 12 intrabars will be analyzed for each chart bar and the count of up/down/neutral intrabars among those will be tallied.
Bar Balances and calculation methods
The indicator uses a variety of methods to evaluate bar balance and to derive other calculations from them:
1. Balance on Bar : Uses the relative importance of instant Up and Down counts on the bar.
2. Balance Averages : Uses the difference between the EMAs of Up and Down counts.
3. Balance Momentum : Starts by calculating, separately for both Up and Down counts, the difference between the same EMAs used in Balance Averages and an SMA of double the period used for the EMAs. These differences are then aggregated and finally, a bounded momentum of that aggregate is calculated using RSI.
4. Markers Bias : It sums the bull/bear occurrences of the four previous markers over a user-defined period (the default is 14).
5. Combined Balances : This is the aggregate of the instant bull/bear bias of the three main bar balances.
6. Dual Up/Down Averages : This is a display mode showing the EMA calculated for each of the Up and Down counts.
Interpretation of neutral intrabars
What do neutral intrabars mean? When price does not change during a bar, it can be because there is simply no interest in the market, or because of a perfect balance between buyers and sellers. The latter being more improbable, Bar Balance assumes that neutral bars reveal a lack of interest, which entails uncertainty. That is the reason why the option is provided to interpret ratios of neutral intrabars greater than 50% as divergences. It is also the rationale behind the option to dampen signal lines on the inverse ratio of neutral intrabars, so that zero intrabars do not affect the signal, and progressively larger proportions of neutral intrabars will reduce the signal's amplitude, as the balance calcs using the up/down counts lose significance. The impact of the dampening will vary with markets. Weaker markets such as cryptos will often contain greater numbers of neutral intrabars, so dampening the Line in that sector will have a greater impact than in more liquid markets.
█ FEATURES
1 — Columns
• While the size of the Up/Down columns always represents their respective importance on the bar, their coloring mode is independent. The default setup uses a standard coloring mode where the Up/Down columns over/under the zero line are always in the bull/bear color with a higher intensity for the winning side. Six other coloring modes allow you to pack more information in the columns. When choosing to color the top columns using a bull/bear gradient on Balance Averages, for example, you will end up with bull/bear colored tops. In order for the color of the bottom columns to continue to show the instant bar balance, you can then choose the "Up/Down Ratio on Bar — Dual Solid Colors" coloring mode to make those bars the color of the winning side for that bar.
• Line mode shows only the line, but Columns mode allows displaying the line along with it. If the scale of the line is different than that of the scale of the columns, the line will often appear flat. Traders may find even a flat line useful as its bull/bear colors will be easily distinguishable.
2 — Line
• The default setup for Line mode uses a calculation on "Balance Momentum", with a fill on the longer-term "Balance Averages" and a line color based on the "Markers Bias". With the background set on "Line vs Divergence Levels" and the zero line on the hard-coded "Combined Bar Balances", you have access to five distinct sources of information at a glance, to which you can add divergences, divergences levels and chart bar coloring. This provides powerful potential in displaying bar balance information.
• When no columns are displayed, Line mode can show the full scale of whichever line you choose to calculate because the columns' scale no longer interferes with the line's scale.
• Note that when "Balance on Bar" is selected, the Neutral count is also displayed as a ratio of the balance line. This is the only instance where the Neutral count is displayed in Line mode.
• The "Dual Up/Down Averages" is an exception as it displays two lines: one average for the Up counts and another for the Down counts. This mode will be most useful when Columns are also displayed, as it provides a reference for the top and bottom columns.
3 — Zero Line
The zero line can be colored using two methods, both based on the Combined Balances, i.e., the aggregate of the instant bull/bear bias of the three main bar balances.
• In "Six-state Dual Color Gradient" mode, a dot appears on every bar. Its color reflects the bull/bear state of the Combined Balances, and the dot's brightness reflects the tally of balance biases.
• In "Dual Solid Colors (All Bull/All Bear Only)" a dot only appears when all three balances are either bullish or bearish. The resulting pattern is identical to that of Marker 1.
4 — Divergences
• Divergences are displayed as a small circle at the top of the scale. Four different types of divergence events can be detected. Divergences occur whenever the bull/bear bias of the method used diverges with the bar's price direction.
• An option allows you to include in divergence events instances where the count of neutral intrabars exceeds 50% of the total intrabar count.
• The divergence levels are dynamic levels that automatically build from the line's values on divergence events. On consecutive divergences, the levels will expand, creating a channel. This implementation of the divergence levels corresponds to my view that divergences indicate anomalies, hesitations, points of uncertainty if you will. It excludes any association of a pre-determined bullish/bearish bias to divergences. Accordingly, the levels merely take note of divergence events and mark those points in time with levels. Traders then have a reference point from which they can evaluate further movement. The bull/bear/neutral colors used to plot the levels are also congruent with this view in that they are determined by price's position relative to the levels, which is how I think divergences can be put to the most effective use.
5 — Background
• The background can show a bull/bear gradient on four different calculations. You can adjust its brightness to make its visual importance proportional to how you use it in your analysis.
6 — Chart bars
• Chart bars can be colored using five different methods.
• You have the option of emptying the body of bars where volume does not increase, as does my TLD indicator, the idea behind this being that movement on bars where volume does not increase is less relevant.
7 — Intrabar Resolution
You can choose between three modes. Two of them are automatic and one is manual:
a) Fast, Longer history, Auto-Steps (~12 intrabars) : Optimized for speed and deeper history. Uses an average minimum of 12 intrabars.
b) More Precise, Shorter History Auto-Steps (~24 intrabars) : Uses finer intrabar resolution. It is slower and provides less history. Uses an average minimum of 24 intrabars.
c) Fixed : Uses the fixed resolution of your choice.
Auto-Steps calculations vary for 24/7 and conventional markets in order to achieve the proper target of minimum intrabars.
You can choose to view the intrabar resolution currently used to calculate delta volume. It is the default.
The proper selection of the intrabar resolution is important. It must achieve maximal granularity to produce precise results while not unduly slowing down calculations, or worse, causing runtime errors.
8 — Markers
Six markers are available:
1. Combined Balances Agreement : All three Bar Balances are either bullish or bearish.
2. Up or Down % Agrees With Bar : An up marker will appear when the percentage of up intrabars in an up chart bar is greater than the specified percentage. Conditions mirror to down bars.
3. Divergence confirmations By Price : One of the four types of balance calculations can be used to detect divergences with price. Confirmations occur when the bar following the divergence confirms the balance bias. Note that the divergence events used here do not include neutral intrabar events.
4. Balance Transitions : Bull/bear transitions of the selected balance.
5. Markers Bias Transitions : Bull/bear transitions of the Markers Bias.
6. Divergence Confirmations By Line : Marks points where the line first breaches a divergence level.
Markers appear when the condition is detected, without delay. Since nothing is plotted in realtime, markers do not appear on the realtime bar.
9 — Settings
• Two modes can be selected to dampen the line on the ratio of neutral intrabars.
• A distinct weight can be attributed to the count of the latter half of intrabars, on the assumption that later intrabars may be more important in determining the outcome of chart bars.
• Allows control over the periods of the different moving averages used in calculations.
• The default periods used for the various calculations define the following hierarchy from slow to fast:
Balance Averages: 50,
Balance Momentum: 20,
Dual Up/Down Averages: 20,
Marker Bias: 10.
█ LIMITATIONS
• This script uses a special characteristic of the `security()` function allowing the inspection of intrabars—which is not officially supported by TradingView.
• The method used does not work on the realtime bar—only on historical bars.
• The indicator only works on some chart resolutions: 3, 5, 10, 15 and 30 minutes, 1, 2, 4, 6, and 12 hours, 1 day, 1 week and 1 month. The script’s code can be modified to run on other resolutions, but chart resolutions must be divisible by the lower resolution used for intrabars and the stepping mechanism could require adaptation.
• When using the "Line vs Divergence Levels — Dual Color Gradient" color mode to fill the line, background or chart bars, keep in mind that a line calculation mode must be defined for it to work, as it determines gradients on the movement of the line relative to divergence levels. If the line is hidden, it will not work.
• When the difference between the chart’s resolution and the intrabar resolution is too great, runtime errors will occur. The Auto-Steps selection mechanisms should avoid this.
• Alerts do not work reliably when `security()` is used at intrabar resolutions. Accordingly, no alerts are configured in the indicator.
• The color model used in the indicator provides for fancy visuals that come at a price; when you change values in Inputs , it can take 20 seconds for the changes to materialize. Luckily, once your color setup is complete, the color model does not have a large performance impact, as in normal operation the `security()` calls will become the most important factor in determining response time. Also, once in a while a runtime error will occur when you change inputs. Just making another change will usually bring the indicator back up.
█ RAMBLINGS
Is this thing useful?
I'll let you decide. Bar Balance acts somewhat like an X-Ray on bars. The intrabars it analyzes are no secret; one can simply change the chart's resolution to see the same intrabars the indicator uses. What the indicator brings to traders is the precise count of up/down/neutral intrabars and, more importantly, the calculations it derives from them to present the information in a way that can make it easier to use in trading decisions.
How reliable is Bar Balance information?
By the same token that an up bar does not guarantee that more up bars will follow, future price movements cannot be inferred from the mere count of up/down/neutral intrabars. Price movement during any chart bar for which, let's say, 12 intrabars are analyzed, could be due to only one of those intrabars. One can thus easily see how only relying on bar balance information could be very misleading. The rationale behind Bar Balance is that when the information mined for multiple chart bars is aggregated, it can provide insight into the history behind chart bars, and thus some bias as to the strength of movements. An up chart bar where 11/12 intrabars are also up is assumed to be stronger than the same up bar where only 2/12 intrabars are up. This logic is not bulletproof, and sometimes Bar Balance will stray. Also, keep in mind that balance lines do not represent price momentum as RSI would. Bar Balance calculations have no idea where price is. Their perspective, like that of any historian, is very limited, constrained that it is to the narrow universe of up/down/neutral intrabar counts. You will thus see instances where price is moving up while Balance Momentum, for example, is moving down. When Bar Balance performs as intended, this indicates that the rally is weakening, which does necessarily imply that price will reverse. Occasionally, price will merrily continue to advance on weakening strength.
Divergences
Most of the divergence detection methods used here rely on a difference between the bias of a calculation involving a multi-bar average and a given bar's price direction. When using "Bar Balance on Bar" however, only the bar's balance and price movement are used. This is the default mode.
As usual, divergences are points of interest because they reveal imbalances, which may or may not become turning points. I do not share the overwhelming enthusiasm traders have for the purported ability of bullish/bearish divergences to indicate imminent reversals.
Superfluity
In "The Bed of Procrustes", Nassim Nicholas Taleb writes: To bankrupt a fool, give him information . Bar Balance can display lots of information. While learning to use a new indicator inevitably requires an adaptation period where we put it through its paces and try out all its options, once you have become used to Bar Balance and decide to adopt it, rigorously eliminate the components you don't use and configure the remaining ones so their visual prominence reflects their relative importance in your analysis. I tried to provide flexible options for traders to control this indicator's visuals for that exact reason—not for window dressing.
█ NOTES
For traders
• To avoid misleading traders who don't read script descriptions, the indicator shows nothing in the realtime bar.
• The Data Window shows key values for the indicator.
• All gradients used in this indicator determine their brightness intensities using advances/declines in the signal—not their relative position in a fixed scale.
• Note that because of the way gradients are optimized internally, changing their brightness will sometimes require bringing down the value a few steps before you see an impact.
• Because this indicator does not use volume, it will work on all markets.
For coders
• For those interested in gradients, this script uses an advanced version of the Advance/Decline gradient function from the PineCoders Color Gradient (16 colors) Framework . It allows more precise control over the range, steps and min/max values of the gradients.
• I use the PineCoders Coding Conventions for Pine to write my scripts.
• I used functions modified from the PineCoders MTF Selection Framework for the selection of timeframes.
█ THANKS TO:
— alexgrover who helped me think through the dampening method used to attenuate signal lines on high ratios of neutral intrabars.
— A guy called Kuan who commented on a Backtest Rookies presentation of their Volume Profile indicator . The technique I use to inspect intrabars is derived from Kuan's code.
— theheirophant , my partner in the exploration of the sometimes weird abysses of `security()`’s behavior at intrabar resolutions.
— midtownsk8rguy , my brilliant companion in mining the depths of Pine graphics. He is also the co-author of the PineCoders Color Gradient Frameworks .

Pivot Point SupertrendHello All,
There are many types of SuperTrend around. Recently I thought about a Supertrend based on Pivot Points then I wrote "Pivot Point SuperTrend" script. It looks it has better performance on keeping you in the trend more.
The idea is behind this script is finding pivot point, calculating average of them and like in supertrend creating higher/lower bands by ATR. As you can see in the algorithm the script gives weigth to past pivot points, this is done for smoothing it a bit.
As I wrote above it may keep you in the trend more, lets see an example:
As an option the script can show main center line and I realized that when you are in a position, this line can be used as early exit points. (maybe half of the position size)
While using Pivot Points, I added support resistance lines by using Pivot Point, as an option the script can show S/R lines:
And also it can show Pivot Points:
When you changed Pivot Point Period you can see its reaction, in following example PP period is 4 (default value is 2). Smaller PP periods more sensitive trendlines.
Alerts added for Buy/Sell entries and Trend Reversals. (when you set alerts use the option " Once Per Bar Close ")
ENJOY!

Yield Curve Percent Inverted**************************************************************************************************
Yield Curve Percent Inverted Indicator
This indicator will check all fifty-five Treasury Bond Yield spreads - every combination from
1-month up to 30-year - and then graph the percentage of spreads which are inverted.
Yield curve inversion occurs when the longer-duration bond pays a lower yield than the shorter-
duration bond. Longer-dated bonds normally pay a higher yield because the investor's money is
committed for a longer period of time. Inversion occurs when investors have little confidence
in the near-term economy and demand higher rates for short-term investments.
Historically, a few months ahead of a recession this percent-inverted value will spike up into
the 60%-70% range - you can see this behavior in 1989, 2000, 2007, and 2019. (Note that there
is no data available on Trading View prior to 1987.)
**************************************************************************************************

Gap Filling Strategy Gaps are market prices structures that appear frequently in the stock market, and can be detected when the opening price is different from the previous closing price, this is why gaps are also called "opening price jumps". While gaps can occur frequently, some of them are more significant than others, and can be observed when looking at a long term chart.
The following strategy is based on the exploitation of significant gaps occurring during a new session, and posses various options that can return a wide variety of results.
Type Of Gaps And Occurence
I'am not a professional when it comes to gaps, but as you know the stock market close for the day, however it is still possible to place orders, your broker will hold them until the market open back. Once the market reopen the broker execute the pending orders, and when many orders where pending the market register really high volume and the price might differ from the precedent close.
Gaps are generally broken down into four types:
Common : Gaps occurring within a certain price range, mostly occurs during ranging markets.
Break Away : Gaps breaking a support and resistance, making a new higher high/lower low.
Runaway : Gaps occurring within a trend, followed by a continuation of the trend.
Exhaustion : Gaps occurring at the end of a trend, followed by a reversal.
As said before, some gaps are more significant than others, the significance of a gap can be determined by comparing the opening price with the previous high/low price and by looking at volume. Significant up gaps will have an opening price greater than the previous high, while significant down gap will have an opening price lower than the previous low with both high volume accompanying them.
After a gap, when the price go back to the point previous to the gap we say that it has been "filled", this characteristic is what will be exploited in this strategy.
Strategy Rules & Logic
In this strategy, the significance of a gap is determined by the position of the opening price relative to the previous high/low and make sure the bar following the gap don't fill it.
When the setting invert is set to false the strategy interpret the detected gaps as being exhaustion gaps, therefore when an up gap occur a short position is opened, when a down gap occur a long position is opened. When invert is set to true gaps are considered to be runaway or break away gaps, therefore the contrary positions are opened. Positions are exited when the gap has been filled, which in the chart is show'n when the price cross the red level who act as either a take profit (invert = false) or as a stop loss (invert = true).
There are various closing conditions available that the user can select from the "close when" setting.
New Session : This option close all previous positions when the market is in a new session.
New Gap : This option close all previous position when a new gap has been detected.
Reverse Position : This option close all previous position when a contrary position to the current one is opened. This option would reduce the number of trades.
Testing On Some Stocks
The analysis will be tested in different tech stocks with a main TF of 15 minutes with no spread and commissions applied. Default settings will be used. We'll be making our first analysis using AMD, who has recently formed a full reverse HS pattern, where the neckline has been crossed by the price. (by the way i have a bad feeling about it, hey ! feeling filling ! Lame jokes!)
Profit: $ -12.22
Trades: 272
Profitability: 65.07 %
We can see negative results, with an heavily decreasing balance. Using invert would return positive results.
We will now test the strategy on NVDA, the company is one of the biggest when it comes to the Gpu market.
Profit: $ -215.54
Trades: 297
Profitability: 60.27 %
Not better, using invert would of course create better results. Like AMD the balance is heavily decreasing.
Finally we will test the strategy on Seagate technology, a company mostly known for their mechanical hard drives.
Profit: $ -4.32
Trades: 261
Profitability: 65.9 %
Here the balance does not appear so heavily decreasing and even managed to reach back the initial balance before going down again.
Summary
A strategy based on gap filling has been briefly introduced and tested with 3 tech stocks. The results show that using invert option might be better. The advantage of this strategy against ones using technical indicators is that this one does not heavily depend on user settings, which make it way more efficient, this a big advantage of patterns based strategies.
Thx to LucF for helping with the "process_orders_on_close" element, since i had to use closing price i had to remove it tho, was afraid results would differ even more from a more realistic backtest. And thx for those who continuously support me, more cool stuff is coming up.
Thx for reading and i hope you'll have learned something new today !

SPY Expected Move by VIXThis indicator shows 1 and 2 standard deviation price move from the VWAP based on VIX. Implied Volatility (IV) is being used extensively in the Option world to project the Expected Move for the underlying instrument. VIX is used as a proxy for SPY's IV for 30 days.
This indicator is meaningful only for SPY but can be used in any other instrument which has a strong correlation to SPY.
