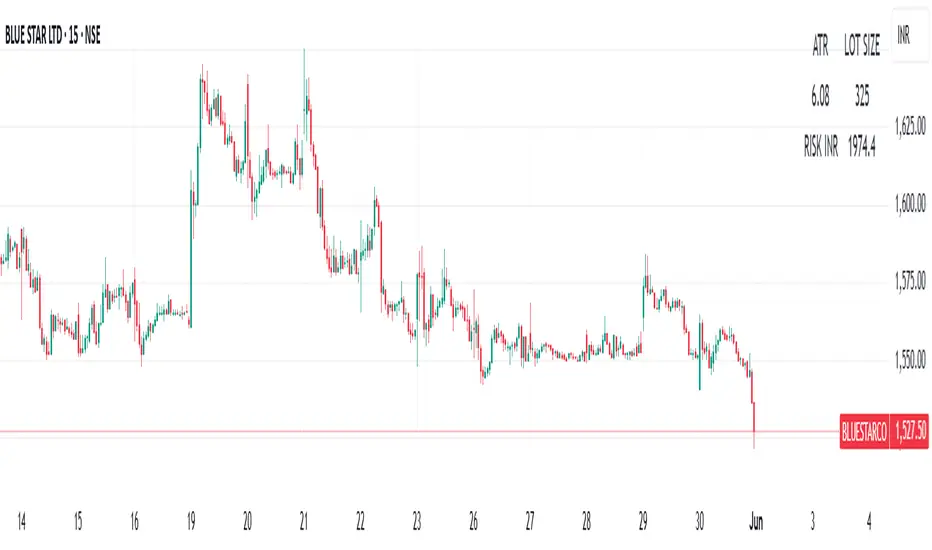
ATR | LOTSIZE | Risk (Futures)This Pine Script is a futures-specific trading utility designed to help F\&O (Futures and Options) traders quickly assess the volatility and position sizing for any selected stock on the chart — even if it's not a futures chart.
What the Script Does:
* Automatically detects the futures symbol for the underlying equity using a dynamic mapping system.
* Calculates the ATR (Average True Range) of the futures contract using either SMA or EMA.
* Fetches the Lot Size (Point Value) of the futures instrument.
* Computes risk per lot by multiplying ATR with lot size (Risk = ATR × Lot Size).
* Displays all 3 values — ATR, Lot Size, and Risk in INR — in a compact table on the chart.
Why This Is Useful for F\&O Traders:
* ✅ Quick Risk Assessment: Helps traders understand how much is at risk per lot without switching to the actual futures chart.
* ✅ Position Sizing: Provides data to calculate how many lots to trade based on a defined risk per trade.
* ✅ Volatility Awareness:ATR gives insights into how much the stock typically moves, guiding stop-loss and target placements.
* ✅ Efficient Workflow:No need to load separate futures charts or lookup lot sizes manually — saves time and reduces error.
This tool is ideal for discretionary and systematic traders who want risk and volatility context for every trade, especially in the NSE Futures & Options segment.
Educational
Random State Machine Strategy📌 Random State Machine Strategy (Educational)
This strategy showcases a randomized entry model driven by a finite state machine, integrated with user-defined exit controls and a full-featured moving average filter.
🧠 Trade Entry Logic
Entries occur only when:
A random trigger occurs (~5% probability per bar)
The state machine accepts a new transition (sm.step())
Price is:
Above the selected MA for long entries
Below the selected MA for short entries
This ensures that entries are both stochastically driven and trend-aligned, avoiding frequent or arbitrary trades.
⚙️ How It Works
Randomized Triggers
A pseudo-random generator (seeded with time and volume) attempts to trigger state transitions.
Finite State Machine
Transitions are managed using the StateMachine from robbatt/lib_statemachine — credit to @robbatt for the modular FSM design.
Controlled Reset
The state machine resets every N bars (default: 100) if at least two transitions have occurred. This prevents stale or locked states.
Backtest Range
Define a specific test window using Start and End Date inputs.
Risk & Exits
Specify risk in points and a target risk/reward ratio. TP is auto-computed. Timed and MA-based exits can be toggled.
🧪 How to Use
Enable Long or Short trades
Choose your Moving Average type and length
Set Risk per trade and R/R ratio
Toggle TP/SL, timed exit, or MA cross exit
Adjust the State Reset Interval to suit your signal frequency
📘 Notes
Educational use only — not financial advice
Random logic is used to model structure, not predict movement
Thanks to @robbatt for the lib_statemachine integration

Volume pressure by GSK-VIZAG-AP-INDIA🔍 Volume Pressure by GSK-VIZAG-AP-INDIA
🧠 Overview
“Volume Pressure” is a multi-timeframe, real-time table-based volume analysis tool designed to give traders a clear and immediate view of buying and selling pressure across custom-selected timeframes. By breaking down buy volume, sell volume, total volume, and their percentages, this indicator helps traders identify demand/supply imbalances and volume momentum in the market.
🎯 Purpose / Trading Use Case
This indicator is ideal for intraday and short-term traders who want to:
Spot aggressive buying or selling activity
Track volume dynamics across multiple timeframes *1 min time frame will give best results*
Use volume pressure as a confirming tool alongside price action or trend-based systems
It helps determine when large buying/selling activity is occurring and whether such behavior is consistent across timeframes—a strong signal of institutional interest or volume-driven trend shifts.
🧩 Key Features & Logic
Real-Time Table Display: A clean, dynamic table showing:
Buy Volume
Sell Volume
Total Volume
Buy % of total volume
Sell % of total volume
Multi-Time frame Analysis: Supports 8 user-selectable custom time frames from 1 to 240 minutes, giving flexibility to analyze volume pressure at various granularities.
Color-Coded Volume Bias:
Green for dominant Buy pressure
Red for dominant Sell pressure
Yellow for Neutral
Intensity-based blinking for extreme values (over 70%)
Dynamic Data Calculation:
Uses volume * (close > open) logic to estimate buy vs sell volumes bar-by-bar, then aggregates by timeframe.
⚙️ User Inputs & Settings
Timeframe Selectors (TF1 to TF8): Choose any 8 timeframes you want to monitor volume pressure across.
Text & Color Settings:
Customize text colors for Buy, Sell, Total volumes
Choose Buy/Sell bias colors
Enable/disable blinking for visual emphasis on extremes
Table Appearance:
Set header color, metric background, and text size
Table positioning: top-right, bottom-right, etc.
Blinking Highlight Toggle: Enable this to visually highlight when Buy/Sell % exceeds 70%—a sign of strong pressure.
📊 Visual Elements Explained
The table has 6 rows and 10 columns:
Row 0: Headers for Today and TF1 to TF8
Rows 1–3: Absolute values (Buy Vol, Sell Vol, Total Vol)
Rows 4–5: Relative percentages (Buy %, Sell %), with dynamic background color
First column shows the metric names (e.g., “Buy Vol”)
Cells blink using alternate background colors if volume pressure crosses thresholds
💡 How to Use It Effectively
Use Buy/Sell % rows to confirm potential breakout trades or identify volume exhaustion zones
Look for multi-timeframe confluence: If 5 or more TFs show >70% Buy pressure, buyers are in control
Combine with price action (e.g., breakouts, reversals) to increase conviction
Suitable for equities, indices, futures, crypto, especially on lower timeframes (1m to 15m)
🏆 What Makes It Unique
Table-based MTF Volume Pressure Display: Most indicators only show volume as bars or histograms; this script summarizes and color-codes volume bias across timeframes in a tabular format.
Customization-friendly: Full control over colors, themes, and timeframes
Blinking Alerts: Rare visual feature to capture user attention during extreme pressure
Designed with performance and readability in mind—even for fast-paced scalping environments.
🚨 Alerts / Extras
While this script doesn’t include TradingView alert functions directly, the visual blinking serves as a strong real-time alert mechanism.
Future versions may include built-in alert conditions for buy/sell bias thresholds.
🔬 Technical Concepts Used
Volume Dissection using close > open logic (to estimate buyer vs seller pressure)
Simple aggregation of volume over custom timeframes
Table plotting using Pine Script table.new, table.cell
Dynamic color logic for bias identification
Custom blinking logic using na(bar_index % 2 == 0 ? colorA : colorB)
⚠️ Disclaimer
This indicator is a tool for analysis, not financial advice. Always backtest and validate strategies before using any indicator for live trading. Past performance is not indicative of future results. Use at your own risk and apply proper risk management.
✍️ Author & Signature
Indicator Name: Volume Pressure
Author: GSK-VIZAG-AP-INDIA
TradingView Username: prowelltraders

Bullish Bearish Signal with EMA Color + LabelsThis script generates clear BUY and SELL signals based on a combination of trend direction, momentum, and confirmation from multiple indicators. It is intended to help traders identify strong bullish or bearish conditions using commonly trusted tools: EMA 200, MACD, and RSI.
🔍 How it works:
The strategy combines three key elements:
EMA 200 Trend Filter
Identifies the long-term trend:
Price above EMA200 → Bullish trend bias
Price below EMA200 → Bearish trend bias
The EMA line is color-coded:
🔵 Blue for bullish
🔴 Red for bearish
⚪ Gray for neutral/unclear
MACD Crossover
Detects shifts in market momentum:
Bullish: MACD line crosses above signal line
Bearish: MACD line crosses below signal line
RSI Confirmation
Adds an extra layer of confirmation:
Bullish: RSI is above its signal line
Bearish: RSI is below its signal line
✅ Signal Logic:
BUY Signal appears when:
Price > EMA200
MACD crosses up
RSI > its signal line
SELL Signal appears when:
Price < EMA200
MACD crosses down
RSI < its signal line
Labels will appear on the chart to highlight these events.
🔔 Alerts:
The script includes alerts for both Buy and Sell conditions, so you can be notified in real-time when they occur.
📈 How to Use:
Best used in trending markets.
Recommended for higher timeframes (1H and above).
May be combined with other tools such as support/resistance or candlestick analysis.
⚠️ Disclaimer: This script is intended for educational purposes only and does not constitute financial advice or a trading recommendation.

Multi-Indicator Trend-Following Strategy v6Multi-Indicator Trend-Following Strategy v6
This strategy uses a combination of technical indicators to identify potential trend-following trade entries and exits. It is intended for educational and research purposes.
How it works:
Moving Averages (EMA): Entry signals are generated on crossovers between a fast and slow exponential moving average.
RSI Filter: Confirms momentum with a threshold above/below 50 for long/short entries.
Volume Confirmation: Requires volume to exceed a moving average multiplied by a user-defined factor.
ATR-Based Risk Management: Stop loss and take profit levels are calculated using the Average True Range (ATR), allowing for dynamic risk control based on market volatility.
Customizable Inputs:
Fast/Slow MA lengths
RSI length and levels
MACD settings (used in calculation, not directly in signal)
Volume MA and multiplier
ATR period and multipliers for stop loss and take profit
Notes:
This strategy does not guarantee future results.
It is provided for analysis and backtesting only.
Alerts are available for buy/sell conditions.
Feel free to adjust parameters to explore different market conditions and asset classes.

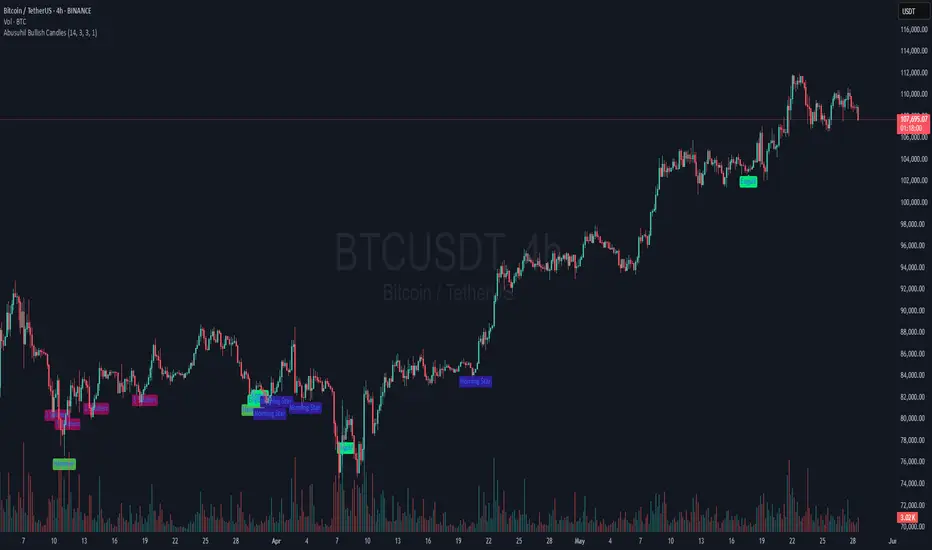
Abusuhil Bullish Candles (Label + Table)Abusuhil Bullish Candles is a pattern recognition indicator designed to identify key bullish reversal candlestick formations including Hammer, Bullish Engulfing, Morning Star, Piercing Line, Three White Soldiers, and Three Inside Up.
The script includes optional filters such as Stochastic and Volume Confirmation, providing more precise signal detection.
Each pattern and filter is fully customizable via settings. Alerts are also included to support active trading workflows.
This script was written originally and does not copy open-source indicators. It's ideal for traders seeking visual clarity on bullish opportunities with professional-grade logic.
مؤشر الشموع الصعودية هو مؤشر احترافي يكتشف أبرز نماذج الانعكاس الصعودي في الشموع اليابانية مثل: Hammer، Bullish Engulfing، Morning Star، Piercing Line، Three White Soldiers، و Three Inside Up.
يوفر المؤشر فلاتر إضافية مثل فلتر Stochastic وفلتر الفوليوم لتعزيز دقة الإشارات. جميع الإعدادات قابلة للتعديل بما يتناسب مع احتياج كل متداول.
يحتوي المؤشر أيضًا على تنبيهات تلقائية لدعم استراتيجيات التداول اللحظي. تمت برمجة المؤشر من الصفر ويعتمد على منطق خاص غير منسوخ من سكربتات مفتوحة المصدر.
--------------------------------------------------------------------------------------------------------------------
🇸🇦 التحديثات – النسخة الجديدة (Abusuhil Bullish Candles)
✅ تم تغيير الملصقات بشكل أوضح: باستخدام دوائر ملونة أسفل الشموع بدلًا من المربعات لتفادي التراكب.
🟦 إضافة جدول تفاعلي على الشارت يعرض أسماء النماذج وألوانها المخصصة.
🎨 إمكانية تغيير ألوان كل نموذج من الإعدادات حسب رغبة المستخدم.
🧩 تفعيل/تعطيل كل نموذج على حدة من خلال إعدادات منفصلة.
🔔 إضافة تنبيه احترافي واحد يتم تفعيله عند تحقق أي نموذج نشط من النماذج المحددة.
📋 توافق كامل مع سياسة TradingView:
لا يحتوي على أكواد منسوخة أو مبنية على مؤشرات داخلية.
لا تكرار للوظائف أو العناوين.
وصف واضح مع تحكم كامل للمستخدم.
🇬🇧 Updates – Latest Version (Abusuhil Bullish Candles)
✅ Clearer Signal Labels: Now uses colored circles under candles instead of labels to avoid overlapping.
🟦 Interactive Table showing pattern names and user-defined colors.
🎨 Customizable colors for each candlestick pattern from the settings menu.
🧩 Toggle each pattern independently using dedicated checkboxes.
🔔 Single professional alert condition that triggers only when any enabled pattern is detected.
📋 Fully compliant with TradingView's publishing policy:
No reused or built-in indicator code.
No duplicated logic or misleading titles.
Clean and modular design with full user customization.

NoNoiseMA & SlopeHappy trade,
This is a noise-reduced moving average — let's call it the No-Noise MA. A MA where false breakout price action should have little to no impact, while the main trend remains fully represented. In comparison to previous MAs this one's trend appear more linear, and sideways price actions becomes easier to detect thanks to it's unique two filter stages.
In short, the No-Noise-MA (Noise-Reduced Moving Average) is calculated as the cumulative sum of the slopes derived from the center line of the last x pivot points. Let’s break it down step by step:
Pivot Detection:
A pivot algorithm (an adapted variant of the Bilson-Gann-Count method) identifies consecutive pivot points (high, low, high, low, etc.) in the close price series. Let's call this set of Pivots S.
Center Line Calculation:
Out of the set S the last x pivots are used to compute a center line (linear regression line). Always when a new pivot is confirmed, the oldest pivot in the queue is removed, and the new pivot is added.
Slope Extraction:
The center line is defined by its equation shown in the image below
Image 1
Cumulative Slope Sum:
As shown in the image 1 the slope is a series with values around zero. The No-Noise-MA is then just the cumulative sum of the slope series and a correction term. A correction term is needed otherwise the No-Noise-MA would run away over time from the original close price. The correction term is just the deviation between close price and cumulative slope sum multiply with a factor around 0.01 added to the No-Noise-MA.
Noise Reduction:
The goal of noise reduction is done by two filter stages. First Filter is the reduction of the input values. As shown above not all bars close prices are use, instead it uses just the pivot points delivered by the Bilson-Gann-Count method. Favorable the Bilson-Gann-Count method delivers the Pivot points in most cases much faster as other Pivot methods. Already after two bars a new Pivot is confirmed. This takes out all ups and downs between two consecutive Pivots. This first filter stage is legit because all price action in between is hedged by the Pivots.
The second filter stage is the done by the length of the center line. As more pivots are used to calculate the center line as smoother the slope becomes. Out liners just gets less impact if the base is bigger. So the number of involved Pivots has the same meaning as the lengths in any other MA.
Comparison with usual MAs:
For a comparison with other MAs this script also calculate the average lengths of the center line, shown in the upper right chart. So choose for example SMA and set the length parameter to the average length of the center line. As shown in the following image 2.
Image 2
This way both MAs have the same data base and can be objectively compared.
Trend detection:
The slope of the center line can be used for trend confirmation. A slope bigger then zero is an up trend while a slope smaller then zero is a down trend. And side way price action is indicated when the slope is around zero within a certain threshold.
Image 3
One hint should be mentioned here. The side way section gets indicated much later. About the number of bars as the center line is long. Before that there are just up or down trend predicted. In the image 2 you see the slope is firstly tin and as more bars past by the slope becomes more thick. This should indicate the point where no side way predictions will happens anymore.
Variation of calculation
In the settings menu you can find the setting "Include last close to center line". With this activated the center line is calculated with the last pivots and the last close price. The last close price is assumed as a pivot too. This gives the slope a more early reaction to volatile price action. But also brings back some noise.

Abusuhil Bullish CandlesAbusuhil Bullish Candles is a pattern recognition indicator designed to identify key bullish reversal candlestick formations including Hammer, Bullish Engulfing, Morning Star, Piercing Line, Three White Soldiers, and Three Inside Up.
The script includes optional filters such as Stochastic and Volume Confirmation, providing more precise signal detection.
Each pattern and filter is fully customizable via settings. Alerts are also included to support active trading workflows.
This script was written originally and does not copy open-source indicators. It's ideal for traders seeking visual clarity on bullish opportunities with professional-grade logic.
مؤشر الشموع الصعودية هو مؤشر احترافي يكتشف أبرز نماذج الانعكاس الصعودي في الشموع اليابانية مثل: Hammer، Bullish Engulfing، Morning Star، Piercing Line، Three White Soldiers، و Three Inside Up.
يوفر المؤشر فلاتر إضافية مثل فلتر Stochastic وفلتر الفوليوم لتعزيز دقة الإشارات. جميع الإعدادات قابلة للتعديل بما يتناسب مع احتياج كل متداول.
يحتوي المؤشر أيضًا على تنبيهات تلقائية لدعم استراتيجيات التداول اللحظي. تمت برمجة المؤشر من الصفر ويعتمد على منطق خاص غير منسوخ من سكربتات مفتوحة المصدر.
SD Median NUPL-Z🧠 Overview
SD Median NUPL-Z is a trend-following indicator that leverages a normalized version of Bitcoin’s Net Unrealized Profit/Loss (NUPL) metric, filtered through a median-based volatility band. Unlike traditional NUPL which is often used to spot extremes, this indicator is designed to identify sustained directional trends — entering only when both on-chain momentum and price structure align.
🧩 Key Features
Z-Scored NUPL Trend Engine: Normalizes NUPL using rolling mean and standard deviation to create a smoothed trend signal.
Price Structure Filter: Implements a median-based price band to avoid false entries during short-term volatility.
Custom Thresholds: User-defined thresholds determine when the trend signal is strong enough to justify a long or short directional bias.
Directional Candle Coloring: Reinforces current trend regime visually with aqua (bullish) and red (bearish) plots and candles.
Optimized for BTC: Uses Bitcoin’s Market Cap and Realized Cap to construct the NUPL input.
🔍 How It Works
On-Chain Core: NUPL is calculated as the percentage of unrealized profit in the market: (Market Cap - Realized Cap) / Market Cap * 100.
Z-Score Transformation: The raw NUPL value is normalized using a rolling average and standard deviation over a set window (default 134 days), producing the NUPL-Z series.
Median-Based Price Filter: A rolling 50th percentile (median) of price is used alongside its own standard deviation to create upper and lower bounds.
These bounds define a "volatility corridor" around price; the trend signal is only acted upon if price confirms by staying outside these bands.
Signal Logic:
A Long signal is triggered when NUPL-Z rises above the long threshold and price is not below the lower band.
A Short signal is triggered when NUPL-Z falls below the short threshold.
State Variable (CD): Tracks the current market regime, used to control plotting and color changes.
🔁 Use Cases & Applications
Momentum-Based Trend Following: Helps traders align with directional moves backed by both on-chain sentiment and supportive price structure.
Filtered Entry Timing: Reduces premature or noise-based entries by requiring price confirmation before committing to NUPL-based signals.
Best Suited for BTC: This tool is designed specifically around Bitcoin’s on-chain metrics and is not intended for altcoins or low-volume assets.
✅ Conclusion
SD Median NUPL-Z repurposes a traditionally cyclical valuation tool into a modern trend-following signal by combining statistical normalization with dynamic price structure filtering. It offers a more robust way to participate in high-conviction directional trends, reducing the likelihood of entering during short-lived counter moves.
⚠️ Disclaimer
The content provided by this indicator is for educational and informational purposes only. Nothing herein constitutes financial or investment advice. Trading and investing involve risk, including the potential loss of capital. Always backtest and apply risk management suited to your strategy.

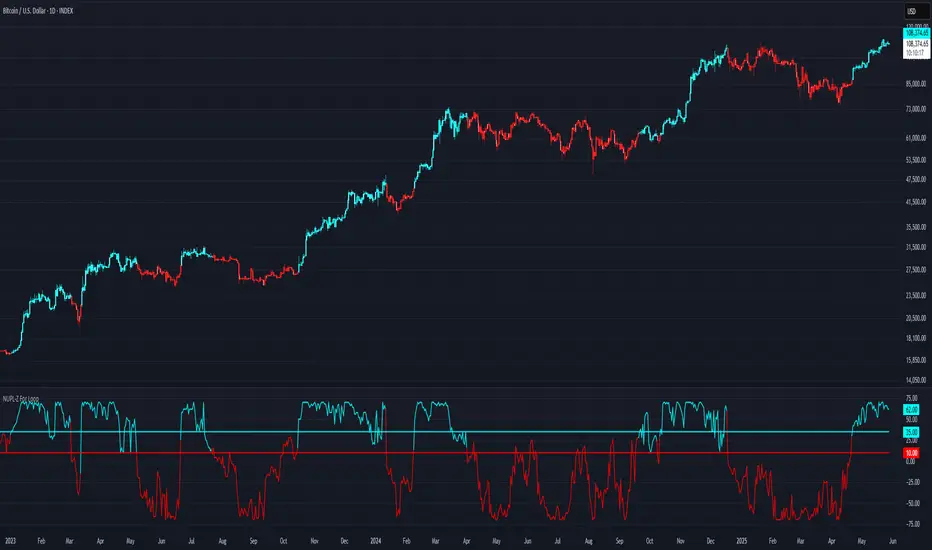
NUPL-Z For Loop🧠 Overview
NUPL-Z For Loop is a trend-following indicator built on Bitcoin’s on-chain Net Unrealized Profit/Loss (NUPL) metric. It uses a Z-scored transformation of NUPL and a custom loop-based scoring system to measure the consistency of directional movement. Rather than identifying tops and bottoms, this tool is designed to track sustained trends and filter out short-term noise, making it ideal for momentum-aligned strategies.
🧩 Key Features
Loop-Based Trend Logic: Assesses trend strength by summing the number of upward vs. downward moves in Z-scored NUPL across a custom lookback.
Z-Score Normalization: Applies long-term statistical normalization to NUPL to emphasize deviation from average behavior over time.
Threshold-Based Regime Shifts: Custom input thresholds define when trend strength is significant enough to trigger long or short signals.
Directional Market State Tracking: Internally tracks bullish, bearish, or neutral conditions to guide trend entries.
BTC-Focused On-Chain Analysis: Tailored specifically for Bitcoin using Market Cap and Realized Cap inputs.
🔍 How It Works
NUPL Calculation: Derived as the percentage of net unrealized profit relative to market cap: (MC - RMC) / MC * 100.
Z-Scoring: NUPL is normalized using a rolling mean and standard deviation over a long window (default 1300 days) to create a smoothed trend signal.
Directional Loop: A custom loop iterates from the start_loop to the end_loop, comparing the current Z-score to past values.
Each instance where NUPL_Z > NUPL_Z adds +1 to the score; otherwise, it subtracts -1.
This cumulative score reflects how consistently NUPL-Z has been trending.
Signal Logic:
Long signal when loop score exceeds long_threshold.
Short signal when score falls below short_threshold.
CD State Engine: Maintains the current trend regime (1 for long, -1 for short), which drives plot coloring and overlays.
🔁 Use Cases & Applications
Momentum Trend Filter: Detects and confirms sustained directional strength in BTC’s profit/loss positioning.
Noise Suppression: Avoids reactive signals from one-off spikes or dips in NUPL by requiring a consistent trend before confirming bias.
Best Suited for BTC: Designed specifically for Bitcoin’s price and on-chain structure, using its unique NUPL dynamics.
✅ Conclusion
NUPL-Z For Loop transforms a traditionally mean-reverting indicator into a trend-following signal engine. By scoring the consistency of movement in normalized NUPL, this tool identifies trend strength rather than reversal potential — providing more reliable context for momentum-aligned trades on Bitcoin.
⚠️ Disclaimer
The content provided by this indicator is for educational and informational purposes only. Nothing herein constitutes financial or investment advice. Trading and investing involve risk, including the potential loss of capital. Always backtest and apply risk management suited to your strategy.
MVRV-Z For Loop🧠 Overview
MVRV-Z For Loop is a trend-following indicator that applies a custom directional for-loop logic to the MVRV Z-score. By evaluating the number of consecutive Z-score improvements or deteriorations over time, it identifies sustained directional pressure in Bitcoin’s on-chain trend — helping traders align with prevailing market strength rather than reacting to single-point extremes.
🧩 Key Features
Loop-Based Trend Filter: Applies a running comparison loop to assess whether MVRV-Z has been consistently strengthening or weakening.
Directional Scoring System: Each upward movement contributes positively, and each downward movement negatively, producing a cumulative trend score.
Z-Scored MVRV: Leverages on-chain valuation via the Market Cap to Realized Cap ratio, normalized using a long-term rolling average and standard deviation.
Custom Thresholds: User-defined thresholds for long and short signals based on trend score magnitude.
Dynamic Candle Coloring: Visually reinforces trend state with aqua for bullish and red for bearish environments.
🔍 How It Works
Z-score Transformation: The MVRV ratio is normalized over a long lookback (default 1050 days), creating a standardized valuation signal.
For-Loop Engine: A directional loop compares the current MVRV-Z value to previous values within a defined range (start to end).
If today’s value is higher than ma , it adds +1 to the score; otherwise, it subtracts -1.
This loop effectively measures momentum consistency rather than magnitude alone.
Signal Logic:
A Long signal is triggered when the cumulative trend score exceeds the long_threshold.
A Short signal is triggered when the score drops below the short_threshold.
State Variable (CD): Tracks the market regime (1 = long, -1 = short), updating only when a valid condition is met.
🔁 Use Cases & Applications
Trend Confirmation Tool: Helps traders assess whether a directional move has been sustained over time before committing.
Momentum Alignment: Filters out short-term noise by scoring consistency in MVRV-Z movement rather than relying on single-bar reversals.
Best Suited for BTC: This indicator is specifically built using Bitcoin’s Market Cap and Realized Cap metrics, making it ideal for BTC trend tracking.
✅ Conclusion
MVRV-Z For Loop transforms the traditional MVRV Z-score into a trend-following signal using a cumulative scoring approach. It excels in highlighting sustained directional strength and avoids premature entries during valuation whipsaws. This makes it a strong tool for traders looking to stay on the right side of the trend without overreacting to short-term fluctuations.
⚠️ Disclaimer
The content provided by this indicator is for educational and informational purposes only. Nothing herein constitutes financial or investment advice. Trading and investing involve risk, including the potential loss of capital. Always backtest and apply risk management suited to your strategy.

SD Median MVRV-Z🧠 Overview
SD Median MVRV-Z is a trend-following indicator that uses on-chain valuation signals as a supportive filter. It blends the momentum of the MVRV Z-score with a dynamic median-based price structure to provide cleaner, more reliable directional signals. This tool is designed to identify when price and trend align with favorable broader context — not to pinpoint overbought or oversold extremes.
🧩 Key Features
Trend-Following Core: Signals are built around directional strength, not reversion.
MVRV Z-Score Momentum: Utilizes the statistical momentum of Market Cap vs Realized Cap as a macro trend driver.
Rolling Median Filter: Applies a price-based condition to ensure trend signals are not triggered during short-term counter-moves or noise.
Threshold Customization: Input controls allow traders to define the strength required to trigger long or short signals.
Dynamic Visualization: Candle coloring and filled zones provide instant feedback on current market regime.
🔍 How It Works
Trend Signal: The MVRV ratio is normalized via Z-scoring to produce a momentum-like signal based on how far current valuation deviates from its rolling average.
Price Filter: A rolling median and standard deviation of price define an upper and lower band. These serve to filter out MVRV-Z signals that occur when price is moving against the perceived direction.
Signal Logic:
Long signal = MVRV-Z above threshold and price is not in the lower volatility band.
Short signal = MVRV-Z below threshold, regardless of price band (more aggressive condition).
Directional Engine (CD): Encodes the market regime state (1 for long, -1 for short, 0 for neutral), and drives all visual outputs.
🔁 Use Cases & Applications
Momentum Confirmation: Identify when on-chain momentum and price structure both confirm a trend direction.
Reduced Whipsawing: Filter out weak or conflicting trend signals that would otherwise lead to false entries.
Best Suited for BTC: This indicator is specifically tailored for Bitcoin, using BTC’s Market Cap and Realized Cap data from on-chain sources.
✅ Conclusion
SD Median MVRV-Z is a trend-centric tool that ensures directional conviction by requiring agreement between price structure and underlying market momentum. It is not meant to detect tops or bottoms, but instead to help traders participate in sustainable moves with greater confidence.
⚠️ Disclaimer
The content provided by this indicator is for educational and informational purposes only. Nothing herein constitutes financial or investment advice. Trading and investing involve risk, including the potential loss of capital. Always backtest and apply risk management suited to your strategy.

RSI Buy Sell Signals[RanaAlgo]Overview
This Premium RSI with Enhanced Signals builds upon the classic Relative Strength Index by incorporating multiple confirmation filters and visual enhancements to improve signal reliability. The indicator goes beyond basic overbought/oversold levels by adding volume confirmation, trend alignment, and peak detection logic.
Key Features
Enhanced Signal Detection
Peak Strength Filter: Requires RSI movements to meet minimum strength criteria (configurable from 1-5 bars)
Volume Confirmation: Optional volume filter to ensure signals occur with above-average trading activity
Trend Alignment: Optional trend confirmation that checks price position relative to 20-period EMA
Visual Improvements
Dynamic coloring of RSI line (green in oversold, red in overbought)
Customizable reference lines and zones
Clear buy/sell signals with triangle markers
Comprehensive info panel showing current RSI status
Alert Capabilities
Ready-to-use alert conditions for both buy and sell signals
Visual and audible alerts when signals trigger
How It Works
Core RSI Calculation: Uses standard RSI formula with configurable length (default 14)
Signal Generation:
Buy signals require either:
RSI rising from oversold with volume/trend confirmation (when enabled)
Simple crossover above oversold level (when filters disabled)
Sell signals require either:
RSI falling from overbought with volume/trend confirmation
Simple crossunder below overbought level
Additional Filters:
Minimum peak strength prevents weak, insignificant movements from generating signals
Volume filter helps confirm institutional participation
Trend filter aligns signals with broader price direction
Usage Instructions
Apply to any chart timeframe (works best on 1H or higher)
Configure settings in the input panel:
Adjust RSI length if needed
Set overbought/oversold levels (default 70/30)
Enable/disable volume and trend filters
Customize visual elements
Signals appear as triangles below/above the RSI line
Use alerts to get notified of new signals
Differentiation from Standard RSI
This indicator adds several layers of confirmation that aren't present in the basic RSI:
Multi-bar momentum requirement for peaks/troughs
Volume validation option
Trend confirmation option
Smoothed RSI line for cleaner visualization
Comprehensive info panel with current status
The combination of these features helps filter out false signals that commonly occur with traditional RSI implementations.

Correlation Coefficient📊 Correlation Coefficient (CC)
This indicator measures the statistical correlation between two selected securities over a defined period, scaled from -100 to +100.
It helps you quickly assess whether assets are moving:
Together (positive correlation)
Opposite (negative correlation)
Independently (zero correlation)
🔧 Features:
Select any two symbols (default: NIFTY & BANKNIFTY)
Adjustable length parameter for short-term or long-term correlation analysis
Clean, color-coded plot with horizontal levels to easily identify key correlation zones
📈 Useful For:
Pair trading setups
Hedging strategies
Detecting market regime shifts or intermarket divergences
⚠️ Disclaimer: This is not trading or investment advice.
This indicator is intended for informational purposes only and is not recommended for making
direct trading decisions.

$ADD LevelsThis Pine Script is designed to track and visualize the NYSE Advance-Decline Line (ADD). The Advance-Decline Line is a popular market breadth indicator, showing the difference between advancing and declining stocks on the NYSE. It’s often used to gauge overall market sentiment and strength.
1. //@version=5
This line tells TradingView to use Pine Script v5, the latest and most powerful version of Pine.
2. indicator(" USI:ADD Levels", overlay=false)
• This creates a new indicator called ” USI:ADD Levels”.
• overlay=false means it will appear in a separate pane, not on the main price chart.
3. add = request.security(...)
This fetches real-time data from the symbol USI:ADD (Advance-Decline Line) using a 1-minute timeframe. You can change the timeframe if needed.
add_symbol = input.symbol(" USI:ADD ", "Market Breadth Symbol")
add = request.security(add_symbol, "1", close)
4. Key Thresholds
These define the market sentiment zones:
Zone. Value. Meaning
Overbought +1500 Extremely bullish
Bullish +1000 Generally bullish trend
Neutral ±500 Choppy, unclear market
Bearish -1000 Generally bearish trend
Oversold -1500 Extremely bearish
5. Plot the ADD Line hline(...)
Draws static lines at +1500, +1000, +500, -500, -1000, -1500 for reference so you can visually assess where ADD stands.
6. Horizontal Threshold Lines bgcolor(...)
• Green background if ADD > +1500 → extremely bullish.
• Red background if ADD < -1500 → extremely bearish.
7. Background Highlights alertcondition(...)
• Green background if ADD > +1500 → extremely bullish.
• Red background if ADD < -1500 → extremely bearish.
8. Alert Conditions. alertcondition(...)
Lets you create automatic alerts for:
• USI:ADD being very high or low.
• Crosses above +1000 (bullish trigger).
• Crosses below -1000 (bearish trigger).
You can use these to trigger trades or monitor sentiment shifts.
Summary: When to Use It
• Use this script in a market breadth dashboard.
• Combine it with price action and volume analysis.
• Monitor for ADD crosses to signal potential market reversals or momentum.

TICK Extreme Levels & AlertsAutomatically draws horizontal lines at +1000 and -1000 TICK levels
Sends alerts when TICK crosses those levels (for potential scalping/reversal setups)
Strategy: How to Use TICK in Real-Time Trading
1. Confirm Market Breadth
Use TICK to confirm broad participation in the move:
• Long S&P futures or SPY? Only buy breakouts if TICK is above +600 to +1000
• Shorting? Confirm with TICK below –600 to –1000
2. Fade Extremes for Scalps
Look for reversals at extreme levels:
• Fade +1200+: market likely overbought short term → scalp short
• Fade –1200–: market likely oversold → scalp long
Use in combo with other signals (like price exhaustion, candlestick reversal, or VWAP touches)
3. Avoid Trading in the Choppy Zone
If TICK remains between –400 and +400, institutions are not committed. This is where fakeouts are common.
4. Time Entries with TICK Swings
For example:
• TICK moves from –800 to +600 = momentum shift → look for long entries
• TICK stalling around +1000 = momentum climax → partial profit or fade play

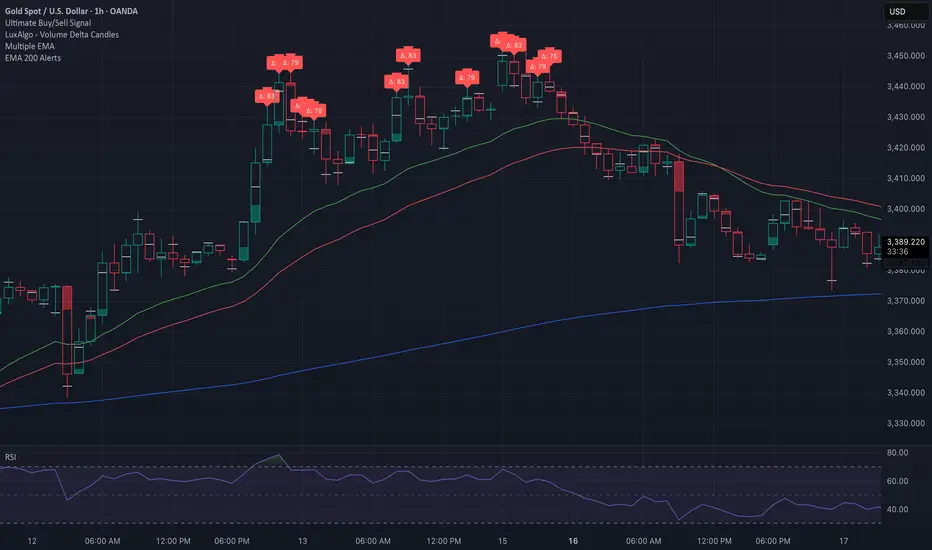
EMA 200 Price Deviation Alerts (1H Only)This script monitors the price deviation from the 200-period Exponential Moving Average (EMA) exclusively on the 1-hour chart. It generates alerts when the absolute difference between the current price and the EMA 200 exceeds a user-defined threshold (default: 65).
Features:
Works only on 1-hour (60-minute) charts to avoid false signals on other timeframes.
Customizable deviation threshold via script input.
Visual display of the 200 EMA on the chart.
Alert system to notify when price deviates significantly above or below the EMA.
Buy/Sell arrows shown when conditions are met:
Sell arrow appears when price is above the EMA and deviation exceeds threshold.
Buy arrow appears when price is below the EMA and deviation exceeds threshold.
Use this tool to identify potential overextended price moves relative to long-term trend support or resistance on the 1H timeframe.
Enhanced Stock Ticker with 50MA vs 200MADescription
The Enhanced Stock Ticker with 50MA vs 200MA is a versatile Pine Script indicator designed to visualize the relative position of a stock's price within its short-term and long-term price ranges, providing actionable bullish and bearish signals. By calculating normalized indices based on user-defined lookback periods (defaulting to 50 and 200 bars), this indicator helps traders identify potential reversals or trend continuations. It offers the flexibility to plot signals either on the main price chart or in a separate lower pane, leveraging Pine Script v6's force_overlay functionality for seamless integration. The indicator also includes a customizable ticker table, visual fills, and alert conditions for automated trading setups.
Key Features
Dual Lookback Indices: Computes short-term (default: 50 bars) and long-term (default: 200 bars) indices, normalizing the closing price relative to the high/low range over the specified periods.
Flexible Signal Plotting: Users can toggle between plotting crossover signals (triangles) on the main price chart (location.abovebar/belowbar) or in the lower pane (location.top/bottom) using the Plot Signals on Main Chart option.
Crossover Signals: Generates bullish (Golden Cross) and bearish (Death Cross) signals when the short or long index crosses above 5 or below 95, respectively.
Visual Enhancements:
Plots short-term (blue) and long-term (white) indices in a separate pane with customizable lookback periods.
Includes horizontal reference lines at 0, 20, 50, 80, and 100, with green and red fills to highlight overbought/oversold zones.
Dynamic fill between indices (green when short > long, red when long > short) for quick trend visualization.
Displays a ticker and legend table in the top-right corner, showing the symbol and lookback periods.
Alert Conditions: Supports alerts for bullish and bearish crossovers on both short and long indices, enabling integration with TradingView's alert system.
Technical Innovation: Utilizes Pine Script v6's force_overlay parameter to plot signals on the main chart from a non-overlay indicator, combining the benefits of a separate pane and chart-based signals in a single script.
Technical Details
Calculation Logic:
Uses confirmed bars (barstate.isconfirmed) to calculate indices, ensuring reliability by avoiding real-time bar fluctuations.
Short-term index: (close - lowest(low, lookback_short)) / (highest(high, lookback_short) - lowest(low, lookback_short)) * 100
Long-term index: (close - lowest(low, lookback_long)) / (highest(high, lookback_long) - lowest(low, lookback_long)) * 100
Signals are triggered using ta.crossover() and ta.crossunder() for indices crossing 5 (bullish) and 95 (bearish).
Signal Plotting:
Main chart signals use force_overlay=true with location.abovebar/belowbar for precise alignment with price bars.
Lower pane signals use location.top/bottom for visibility within the indicator pane.
Plotting is controlled by boolean conditions (e.g., bullishLong and plot_on_chart) to ensure compliance with Pine Script's global scope requirements.
Performance Considerations: Optimized for efficiency by calculating indices only on confirmed bars and using lightweight plotting functions.
How to Use
Add to Chart:
Copy the script into TradingView's Pine Editor and add it to your chart.
Configure Settings:
Short Lookback Period: Adjust the short-term lookback (default: 50 bars) to match your trading style (e.g., 20 for shorter-term analysis).
Long Lookback Period: Adjust the long-term lookback (default: 200 bars) for broader market context.
Plot Signals on Main Chart: Check this box to display signals on the price chart; uncheck to show signals in the lower pane.
Interpret Signals:
Golden Cross (Bullish): Green (long) or blue (short) triangles indicate the index crossing above 5, suggesting a potential buying opportunity.
Death Cross (Bearish): Red (long) or white (short) triangles indicate the index crossing below 95, signaling a potential selling opportunity.
Set Alerts:
Use TradingView's alert system to create notifications for the four alert conditions: Long Index Valley, Long Index Peak, Short Index Valley, and Short Index Peak.
Customize Visuals:
The ticker table displays the symbol and lookback periods in the top-right corner.
Adjust colors and styles via TradingView's settings if desired.
Example Use Cases
Swing Trading: Use the short-term index (e.g., 50 bars) to identify short-term reversals within a broader trend defined by the long-term index.
Trend Confirmation: Monitor the fill between indices to confirm whether the short-term trend aligns with the long-term trend.
Automated Trading: Leverage alert conditions to integrate with bots or manual trading strategies.
Notes
Testing: Always backtest the indicator on your chosen market and timeframe to validate its effectiveness.
Optional Histogram: The script includes a commented-out histogram for the index difference (index_short - index_long). Uncomment the plot(index_diff, ...) line to enable it.
Compatibility: Built for Pine Script v6 and tested on TradingView as of May 27, 2025.
Acknowledgments
This indicator was inspired by the need for a flexible tool that combines lower-pane analysis with main chart signals, made possible by Pine Script's force_overlay feature. Share your feedback or suggestions in the comments below, and happy trading!

magic wand STSM"Magic Wand STSM" Strategy: Trend-Following with Dynamic Risk Management
Overview:
The "Magic Wand STSM" (Supertrend & SMA Momentum) is an automated trading strategy designed to identify and capitalize on sustained trends in the market. It combines a multi-timeframe Supertrend for trend direction and potential reversal signals, along with a 200-period Simple Moving Average (SMA) for overall market bias. A key feature of this strategy is its dynamic position sizing based on a user-defined risk percentage per trade, and a built-in daily and monthly profit/loss tracking system to manage overall exposure and prevent overtrading.
How it Works (Underlying Concepts):
Multi-Timeframe Trend Confirmation (Supertrend):
The strategy uses two Supertrend indicators: one on the current chart timeframe and another on a higher timeframe (e.g., if your chart is 5-minute, the higher timeframe Supertrend might be 15-minute).
Trend Identification: The Supertrend's direction output is crucial. A negative direction indicates a bearish trend (price below Supertrend), while a positive direction indicates a bullish trend (price above Supertrend).
Confirmation: A core principle is that trades are only considered when the Supertrend on both the current and the higher timeframe align in the same direction. This helps to filter out noise and focus on stronger, more confirmed trends. For example, for a long trade, both Supertrends must be indicating a bearish trend (price below Supertrend line, implying an uptrend context where price is expected to stay above/rebound from Supertrend). Similarly, for short trades, both must be indicating a bullish trend (price above Supertrend line, implying a downtrend context where price is expected to stay below/retest Supertrend).
Trend "Readiness": The strategy specifically looks for situations where the Supertrend has been stable for a few bars (checking barssince the last direction change).
Long-Term Market Bias (200 SMA):
A 200-period Simple Moving Average is plotted on the chart.
Filter: For long trades, the price must be above the 200 SMA, confirming an overall bullish bias. For short trades, the price must be below the 200 SMA, confirming an overall bearish bias. This acts as a macro filter, ensuring trades are taken in alignment with the broader market direction.
"Lowest/Highest Value" Pullback Entries:
The strategy employs custom functions (LowestValueAndBar, HighestValueAndBar) to identify specific price action within the recent trend:
For Long Entries: It looks for a "buy ready" condition where the price has found a recent lowest point within a specific number of bars since the Supertrend turned bearish (indicating an uptrend). This suggests a potential pullback or consolidation before continuation. The entry trigger is a close above the open of this identified lowest bar, and also above the current bar's open.
For Short Entries: It looks for a "sell ready" condition where the price has found a recent highest point within a specific number of bars since the Supertrend turned bullish (indicating a downtrend). This suggests a potential rally or consolidation before continuation downwards. The entry trigger is a close below the open of this identified highest bar, and also below the current bar's open.
Candle Confirmation: The strategy also incorporates a check on the candle type at the "lowest/highest value" bar (e.g., closevalue_b < openvalue_b for buy signals, meaning a bearish candle at the low, suggesting a potential reversal before a buy).
Risk Management and Position Sizing:
Dynamic Lot Sizing: The lotsvalue function calculates the appropriate position size based on your Your Equity input, the Risk to Reward ratio, and your risk percentage for your balance % input. This ensures that the capital risked per trade remains consistent as a percentage of your equity, regardless of the instrument's volatility or price. The stop loss distance is directly used in this calculation.
Fixed Risk Reward: All trades are entered with a predefined Risk to Reward ratio (default 2.0). This means for every unit of risk (stop loss distance), the target profit is rr times that distance.
Daily and Monthly Performance Monitoring:
The strategy tracks todaysWins, todaysLosses, and res (daily net result) in real-time.
A "daily profit target" is implemented (day_profit): If the daily net result is very favorable (e.g., res >= 4 with todaysLosses >= 2 or todaysWins + todaysLosses >= 8), the strategy may temporarily halt trading for the remainder of the session to "lock in" profits and prevent overtrading during volatile periods.
A "monthly stop-out" (monthly_trade) is implemented: If the lres (overall net result from all closed trades) falls below a certain threshold (e.g., -12), the strategy will stop trading for a set period (one week in this case) to protect capital during prolonged drawdowns.
Trade Execution:
Entry Triggers: Trades are entered when all buy/sell conditions (Supertrend alignment, SMA filter, "buy/sell situation" candle confirmation, and risk management checks) are met, and there are no open positions.
Stop Loss and Take Profit:
Stop Loss: The stop loss is dynamically placed at the upTrendValue for long trades and downTrendValue for short trades. These values are derived from the Supertrend indicator, which naturally adjusts to market volatility.
Take Profit: The take profit is calculated based on the entry price, the stop loss, and the Risk to Reward ratio (rr).
Position Locks: lock_long and lock_short variables prevent immediate re-entry into the same direction once a trade is initiated, or after a trend reversal based on Supertrend changes.
Visual Elements:
The 200 SMA is plotted in yellow.
Entry, Stop Loss, and Take Profit lines are plotted in white, red, and green respectively when a trade is active, with shaded areas between them to visually represent risk and reward.
Diamond shapes are plotted at the bottom of the chart (green for potential buy signals, red for potential sell signals) to visually indicate when the buy_sit or sell_sit conditions are met, along with other key filters.
A comprehensive trade statistics table is displayed on the chart, showing daily wins/losses, daily profit, total deals, and overall profit/loss.
A background color indicates the active trading session.
Ideal Usage:
This strategy is best applied to instruments with clear trends and sufficient liquidity. Users should carefully adjust the Your Equity, Risk to Reward, and risk percentage inputs to align with their individual risk tolerance and capital. Experimentation with different ATR Length and Factor values for the Supertrend might be beneficial depending on the asset and timeframe.

S&P 500 & Normalized CAPE Z-Score AnalyzerThis macro-focused indicator visualizes the historical valuation of the U.S. equity market using the CAPE ratio (Shiller P/E), normalized over its long-term average and standard deviations. It helps traders and investors identify overvaluation and undervaluation zones over time, combining both statistical signals and historical context.
💡 Why It’s Useful
This indicator is ideal for macro traders and long-term investors looking to contextualize equity valuations across decades. It helps identify statistical extremes in valuation by referencing the standard deviation of the CAPE ratio relative to its long-term mean. The overlay of S&P 500 price with valuation zones provides a visual confirmation tool for macro decisions or timing insights.
It includes:
✅ Three display modes:
-S&P 500 (color-coded by CAPE valuation zone)
-Normalized CAPE (vs. long-term mean)
-CAPE Z-Score (standardized measure)
🎯 How to Interpret
Dynamic coloring of the S&P 500 price based on CAPE valuation:
🔴 Z > +2σ → Highly Overvalued
🟠 Z > +1σ → Overvalued
⚪ -1σ < Z < +1σ → Neutral
🟢 Z < -1σ → Undervalued
✅ Z < -2σ → Strong Buy Zone
-Live valuation label showing the current CAPE, Z-score, and zone.
-Macro event shading: major historical events (e.g. Great Depression, Oil Crisis, Dot-com Bubble, COVID Crash) are shaded on the chart for context.
✅ Built-in alerts:
CAPE > +2σ → Potential risk zone
CAPE < -2σ → Potential opportunity zone
📊 Use Cases
This indicator is ideal for:
🧠 Macro traders seeking long-term valuation extremes.
📈 Portfolio managers monitoring systemic valuation risk.
🏛️ Long-term investors timing strategic allocation shifts.
🧪 How It Works
CAPE ratio (Shiller PE) is retrieved from Quandl (MULTPL/SHILLER_PE_RATIO_MONTH).
The script calculates the long-term average and standard deviation of CAPE.
The Z-score is computed as:
(CAPE - Mean) / Standard Deviation
Users can switch between:
S&P 500 chart, color-coded by CAPE valuation zones.
Normalized CAPE, centered around zero (historic mean).
CAPE Z-score, showing statistical positioning directly.
Visual bands represent +1σ, +2σ, -1σ, -2σ thresholds.
You can switch between modes using the “Display” dropdown in the settings panel.
📊 Data Sources
CAPE: MULTPL/SHILLER_PE_RATIO_MONTH via Quandl
S&P 500: Monthly close prices of SPX (TradingView data)
All data updated on monthly resolution
This is not a repackaged built-in or autogenerated script. It’s a custom-built and interactive indicator designed for educational and analytical use in macroeconomic valuation studies.

EMD Trend [InvestorUnknown]EMD Trend is a dynamic trend-following indicator that utilizes Exponential Moving Deviation (EMD) to build adaptive channels around a selected moving average. Designed for traders who value responsive trend signals with built-in volatility sensitivity, this tool highlights directional bias, market regime shifts, and potential breakout opportunities.
How It Works
Instead of using standard deviation, EMD Trend employs the exponential moving average of the absolute deviation from a moving average—producing smoother, faster-reacting upper and lower bounds:
Bullish (Risk-ON Long): Price crosses above the upper EMD band
Bearish (Risk-ON Short): Price crosses below the lower EMD band
Neutral: Price stays within the channel, indicating potential mean reversion or low momentum
Trend direction is defined by price interaction with these bands, and visual cues (color-coded bars and fills) help quickly identify market conditions.
Features
7 Moving Average Types: SMA, EMA, HMA, DEMA, TEMA, RMA, FRAMA
Custom Price Source: Choose close, hl2, ohlc4, or others
EMD Multiplier: Controls the width of the deviation envelope
Bar Coloring: Candles change color based on current trend
Intra-bar Signal Option: Enables faster updates (with optional repainting)
Speculative Zones: Fills highlight aggressive momentum moves beyond EMD bounds
Backtest Mode
Switch to Backtest Mode for performance evaluation over historical data:
Equity Curve Plot: Compare EMD Trend strategy vs. Buy & Hold
Trade Metrics Table: View number of trades, win/loss stats, profits
Performance Metrics Table: Includes CAGR, Sharpe, max drawdown, and more
Custom Start Date: Select from which date the backtest should begin
Trade Sizing: Configure capital and trade percentage per entry
Signal Filters: Choose from Long Only, Short Only, or Both
Alerts
Built-in alerts let you automate entries, exits, and trend transitions:
LONG (EMD Trend) - Trend flips to Long
SHORT (EMD Trend) - Trend flips to Short
RISK-ON LONG - Price crosses above upper EMD band
RISK-OFF LONG - Price crosses back below upper EMD band
RISK-ON SHORT - Price crosses below lower EMD band
RISK-OFF SHORT - Price crosses back above lower EMD band
Use Cases
Trend Confirmation with volatility-sensitive boundaries
Momentum Entry Filtering via breakout zones
Mean Reversion Avoidance in sideways markets
Backtesting & Strategy Building with real-time metrics
Disclaimer
This indicator is intended for informational and educational purposes only. It does not constitute investment advice. Historical performance does not guarantee future results. Always backtest and use in simulation before live trading.

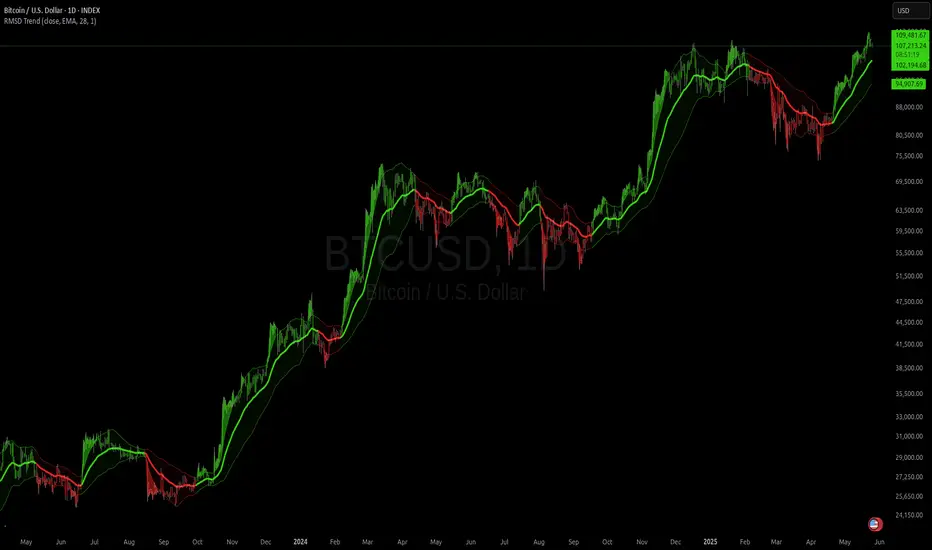
RMSD Trend [InvestorUnknown]RMSD Trend is a trend-following indicator that utilizes Root Mean Square Deviation (RMSD) to dynamically construct a volatility-weighted trend channel around a selected moving average. This indicator is designed to enhance signal clarity, minimize noise, and offer quantitative insights into market momentum, ideal for both discretionary and systematic traders.
How It Works
At its core, RMSD Trend calculates a deviation band around a selected moving average using the Root Mean Square Deviation (similar to standard deviation but with squared errors), capturing the magnitude of price dispersion over a user-defined period. The logic is simple:
When price crosses above the upper deviation band, the market is considered bullish (Risk-ON Long).
When price crosses below the lower deviation band, the market is considered bearish (Risk-ON Short).
If price stays within the band, the market is interpreted as neutral or ranging, offering low-risk decision zones.
The indicator also generates trend flips (Long/Short) based on crossovers and crossunders of the price and the RMSD bands, and colors candles accordingly for enhanced visual feedback.
Features
7 Moving Average Types: Choose between SMA, EMA, HMA, DEMA, TEMA, RMA, and FRAMA for flexibility.
Customizable Source Input: Use price types like close, hl2, ohlc4, etc.
Volatility-Aware Channel: Adjustable RMSD multiplier determines band width based on volatility.
Smart Coloring: Candles and bands adapt their colors to reflect trend direction (green for bullish, red for bearish).
Intra-bar Repainting Toggle: Option to allow more responsive but repaintable signals.
Speculation Fill Zones: When price exceeds the deviation channel, a semi-transparent fill highlights potential momentum surges.
Backtest Mode
Switching to Backtest Mode unlocks a robust suite of simulation features:
Built-in Equity Curve: Visualizes both strategy equity and Buy & Hold performance.
Trade Metrics Table: Displays the number of trades, win rates, gross profits/losses, and long/short breakdowns.
Performance Metrics Table: Includes key stats like CAGR, drawdown, Sharpe ratio, and more.
Custom Date Range: Set a custom start date for your backtest.
Trade Sizing: Simulate results using position sizing and initial capital settings.
Signal Filters: Choose between Long & Short, Long Only, or Short Only strategies.
Alerts
The RMSD Trend includes six built-in alert conditions:
LONG (RMSD Trend) - Trend flips from Short to Long
SHORT (RMSD Trend) - Trend flips from Long to Short
RISK-ON LONG (RMSD Trend) - Price crosses above upper RMSD band
RISK-OFF LONG (RMSD Trend) - Price falls back below upper RMSD band
RISK-ON SHORT (RMSD Trend) - Price crosses below lower RMSD band
RISK-OFF SHORT (RMSD Trend) - Price rises back above lower RMSD band
Use Cases
Trend Confirmation: Confirms directional bias with RMSD-weighted confidence zones.
Breakout Detection: Highlights moments when price breaks free from historical volatility norms.
Mean Reversion Filtering: Avoids false signals by incorporating RMSD’s volatility sensitivity.
Strategy Development: Backtest your signals or integrate with a broader system for alpha generation.
Settings Summary
Display Mode: Overlay (default) or Backtest Mode
Average Type: Choose from SMA, EMA, HMA, DEMA, etc.
Average Length: Lookback window for moving average
RMSD Multiplier: Band width control based on RMS deviation
Source: Input price source (close, hl2, ohlc4, etc.)
Intra-bar Updating: Real-time updates (may repaint)
Color Bars: Toggle bar coloring by trend direction
Disclaimer
This indicator is provided for educational and informational purposes only. It is not financial advice. Past performance, including backtest results, is not indicative of future results. Use with caution and always test thoroughly before live deployment.
Trailing Stop Loss [TradingFinder] 4 Machine Learning Methods🔵 Introduction
The trailing stop indicator dynamically adjusts stop-loss (SL) levels to lock in profits as price moves favorably. It uses pivot levels and ATR to set optimal SL points, balancing risk and reward.
Trade confirmation filters, a key feature, ensure entries align with market conditions, reducing false signals. In 2023 a study showed filtered entries improve win rates by 15% in forex. This enhances trade precision.
SL settings, ranging from very tight to very wide, adapt to volatility via ATR calculations. These settings anchor SL to previous pivot levels, ensuring alignment with market structure. This caters to diverse trading styles, from scalping to swing trading.
The indicator colors the profit zone between the entry point (EP) and SL, using light green for buy trades and light red for sell trades. This visual cue highlights profit potential. It’s ideal for traders seeking dynamic risk management.
A table displays real-time trade details, including EP, SL, and profit/loss (PNL). Backtests show trailing stops cut losses by 20% in trending markets. This transparency aids decision-making.
🔵 How to Use
🟣 SL Levels
The trailing stop indicator sets SL based on pivot levels and ATR, offering four options: very tight, tight, wide, or very wide. Very tight SLs suit scalpers, while wide SLs fit swing traders. Select the base level to match your strategy.
If price hits the SL, the trade closes, and the indicator evaluates the next trade using the selected filter. This ensures disciplined trade management. The cycle restarts with a new confirmed entry.
Very tight SLs, set near recent pivots, trigger exits early to minimize risk but limit profits in volatile markets. Wide SLs, shown as farther lines, allow more price movement but increase exposure to losses. Adjust based on ATR and conditions, noting SL breaches open new positions.
🟣 Visualization
The indicator’s visual cues, like colored profit zones, simplify monitoring, with light green showing the profit area from EP to trailed SL. Dashed lines mark entry points, while solid lines track the trailed SL, triggering new positions when breached.
When price moves into profit, the area between EP and SL is colored—light green for longs, light red for shorts. This highlights the profit zone visually. The SL trails price, locking in gains as the trade progresses.
🟣 Filters
Upon trade entry, the indicator requires confirmation via filters like SMA 2x or ADX to validate momentum. Filters reduce false entries, though no guarantee exists for improved outcomes. Monitor price action post-entry for trade validity.
Filters like Momentum or ADX assess trend strength before entry. For example, ADX above 25 confirms strong trends. Choose “none” for unfiltered entries.
🟣 Bullish Alert
For a bullish trade, the indicator opens a long position with a green SL Line (after optional filters), trailing the SL below price. Set alerts to On in the settings for notifications, or Off to monitor manually.
🟣 Bearish Alert
In a bearish trade, the indicator opens a short position with a red SL Line post-confirmation, trailing the SL above price. With alerts On in the settings, it notifies the potential reversal.
🟣 Panel
A table displays all trades’ details, including Win Rates, PNL, and trade status. This real-time data aids in tracking performance. Check the table to assess trade outcomes instantly.
Review the table regularly to evaluate trade performance and adjust settings. Consistent monitoring ensures alignment with market dynamics. This maximizes the indicator’s effectiveness.
🔵 Settings
Length (Default: 10) : Sets the pivot period for calculating SL levels, balancing sensitivity and reliability.
Base Level : Options (“Very tight,” “Tight,” “Wide,” “Very wide”) adjust SL distance via ATR.
Show EP Checkbox : Toggles visibility of the entry point on the chart.
Show PNL : Displays profit/loss data for active and closed trades.
Filter : Options (“none,” “SMA 2x,” “Momentum,” “ADX”) validate trade entries.
🔵 Conclusion
The trailing stop indicator, a dynamic risk management tool, adjusts SLs using pivot levels and ATR. Its confirmation filters reduce false entries, boosting precision. Backtests show 20% loss reduction in trending markets.
Customizable SL settings and visual profit zones enhance usability across trading styles. The real-time table provides clear trade insights, streamlining analysis. It’s ideal for forex, stocks, or crypto.
While filters like ADX improve entry accuracy, no setup guarantees success in all conditions. Contextual analysis, like trend strength, is key. This indicator empowers disciplined, data-driven trading.
