ALERT OF CRYPTOOOFOX (Scalping System)---DESCRIPTION---
How Indicator Work :
--This Indicator is for scalping and also using confirmation when higher > highest time frame .
--The main indicator in this strategy is built on movement high and low so this indicator is belong to
the chart price and movement and you can make profit in any chart as you want
--Indicator is working on higher time frame so i use two high time frames .
the higher is ( 8 H ) and the highest is ( Daily ) Time frame .
-- When the higher time frame cross over the Daily time frame( the Highest ) this mean
the TREND and the PRICE also going UP this strategy is going to start working between the high and low buy in low .
-- When the higher time frame cross under Daily time frame( the Highest ) this mean the TREND and
the PRICE also going down and it will sell in high ( close position ) .
--Indicator is working only in Long position i am not recommend to use it in short positions .
--THIS IS NO REPAINT INDICATOR.
--I recommend so mush to use 5 min time frame for low draw down
--I recommend so mush to use take profit and stop loss although the low draw down but some time
the market have a huge movements .
--This Indicator have setting of movement for every chart and every price and movement so i will
comment the settings for every chart in forex and crypto and also stock markets
Forexsignals

Intraday Trading Tool [VK]This Indicator is all you need to day trade.
Overview: This is a intraday/scalp trading Indictor works using MTF- MA,MACD,RSI for trend ,SRSI For Entries , Murrey Lines for Targets and ATR For Stop Loss , it is designed for all type of markets (crypto, forex, stocks, commodity etc.) and works on all commonly used timeframes .
About The Indicator :
This indicator uses the most commonly used indicators in The markets, MA channel + MACD (Background Trend) + RSI (Trend On Top) . This Three Indicators Are Used For Trend In Higher Time Frame. We Have to take trades based on Trend In Higher Time Frames. We are using SRSI For entries which Has the function to show entries from Higher Time Frames .
Stop Loss And Take Profit : we have used ATR for Stop Loss which will show up with Buy/Sell Signals. and for Taking Profit We Have used Murrey Lines Which Can be used to see Support/Resistance as Targets And also has the function to show Support/Resistance from Higher Time Frame.
Extra Function :
The Cross And Triangles On the Bottom of the Chart Indicates MACD Cross on Higher Time Frames .
How to get access:
Send a Private Massage for getting access to the script.

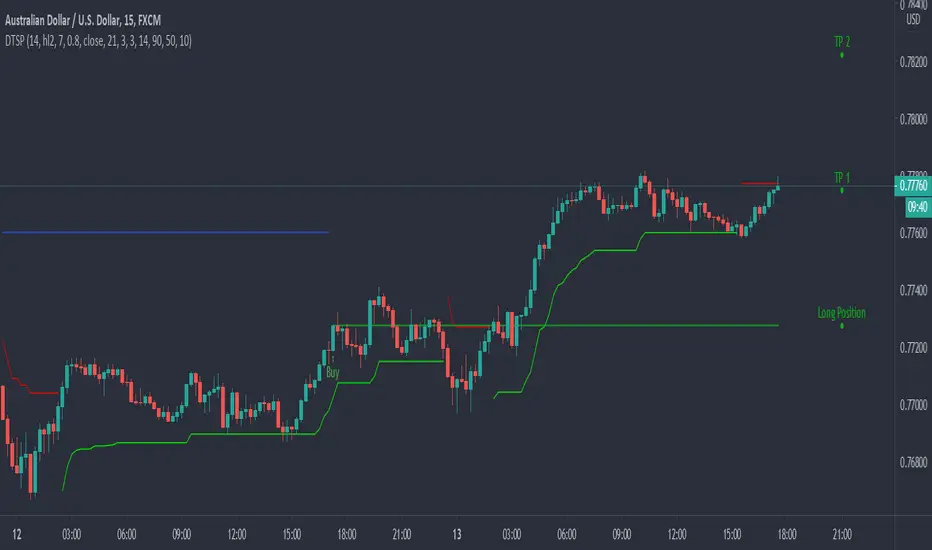
Dynamic Take Profit & Signals (AussieBogan)Dynamic Take Profit & Signals (DTS) help us to dynamically place potential take profit levels. These levels are measured based on standard deviation in conjunction with swing high and low points. Head over to the settings to control your take profit and multiplicative factor setting.
In short, higher values of either setting will return more spread out between tp's. The logic behind using the standard deviation is that a low value of it will return tp closer to where you entered the trade, as such it will have higher chances of the price reaching them.
The Indicator also has alert features for buy and sell so any trader can be aware of every potential signal the indicator produces.
Forex Scalp Triggersthe triggers only work to tell you go back 5 candles on 5 min, take either lowest or highest plus 3 pips and make entry and go 3 pip over under trigger for stop loss. can take half profit at 1x and move stop to break even and go 1x more for take rest profit, or create a trailing stop loss on Take Profit level 2 and ride the trend.
1 Hour chart has to be over under the emas that are faned out nicely to move to 5 min chart to look for the signals if 1hr chart isnt over under the emas nicely then NO TRADE
ForexSignalTV helped create this strategy, just my first script so learning, want to take it to next level but kind of stuck for now. More knowledge coming...
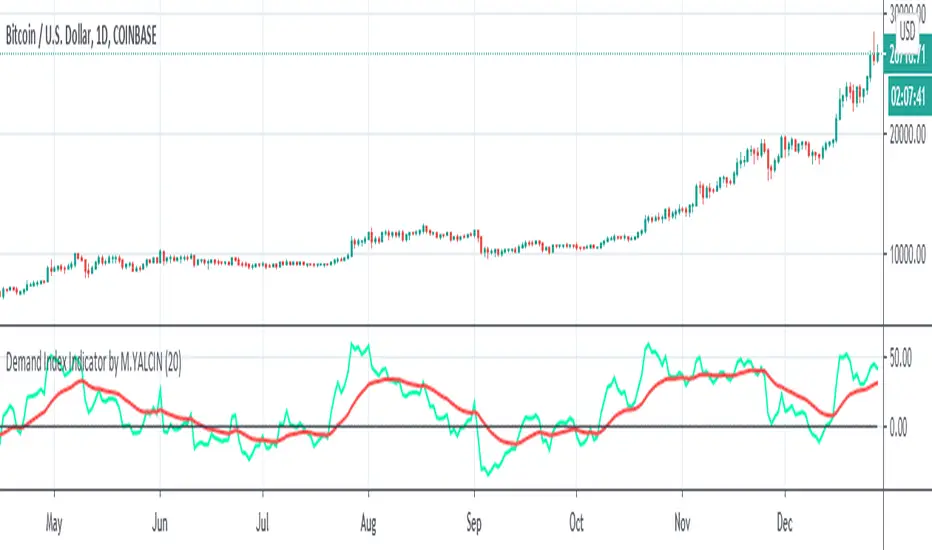
Demand Index Indicator by M.YALCINThe Demand Index is a complex technical indicator developed by James Sibbet that utilizes over 20 columns of data to measure the ratio of buying pressure to selling pressure. James Sibbet established six rules for using Demand Index:
1.A divergence between the Demand Index and price is a bearish indication.
2.Prices often rally to new highs following an extreme peak in the Demand Index.
3.Higher prices with a low Demand Index often indicate a top in the market.
4.The Demand Index moving through the zero line suggests a change in trend.
5.The Demand Index remaining near the zero line indicates weak price movement that won’t last long.
6.A long-term divergence between the Demand Index and price predicts a major top or bottom.
This indicator differs from other demand index indicators on this site in terms of indicator values. However, I think the low number of zigzags highlights this style. On the other hand, I think important points in terms of trading are added to the indicator: 1) According to many observations, the moments when this indicator crosses the zero line are interpreted as buy signals, and vice versa as a sell signal so the 0 line is shown. 2) Again, according to many observations, when the indicator crosses up its own 20-day (bar) exponential moving average is interpreted as a buy signal, and vice versa as a sell signal. Happy New Year ... NOTE: All these ideas do not contain financial advice.
Forex Breakout AlertThe indicator plots breakout events of user-defined Forex list, providing alert setting for breakout events.
Any big trend begins with a couple of price breakouts. By watching breakout events, we overlook the panorama of the whole market.
---------- Features --------------
User-Defined Forex Asset List, Up To 30 Assets
User-Defined Breakout Threshold
Accessible for wide timeframes: 1m - 1 Month
Plot the Breakouts History of whole market
Progressive color according to the strength of the breakthrough
--------- Indicator Settings -----------
"Show Bull or Bear?": To show Bull Breakout, Bear Breakout or Both
"User-Defined Breakout Threshold": User can defined the threshold of breakout, default value 999 means using default setting
"Use Green for Bull? ": Toggle color for Bull, defval: true, if your region use red for bull, toggle it.
"Exchange": Your exchange name, which is used to defined tickerid, defval="", optional - can be empty
"Asset PostFix": postfix of your asset symbol, which is used to define tickerid, defval="", change it if necessary
---------- Versions Description ----------
The features may change later without advance notice.
DEMO version has basic features.
---------- Access to Indicators ----------
Contact the author by Private Chat for access to Invite-Only versions and a trial.
---------- Install Invite Only Version----------
Open the chart -> Add Indicators (On the Top or press /) -> Invite-Only Scripts (last button of the left bar)
Like/Favorite the indicator
Click to install on the chart
---------- About Loading Time ----------
It may take up to 1-3 minutes for your browser to load a new setting, depending on the your computer and network speed. For convenience, you can keep related pages open continuously.
---------- FAQ -----------
1. Why can't I see older breakout labels?
Due to system limit, 500 is the maximum of labels.
In order to see older breakout events, please Select Bull or Bear, instead of Both; Or Increase the threshold to filter weak breakouts.
2. How to watch more than 30 Forex?
Due to system limit, 30 assets is the maximum.
In order to watch more assets, user can open the indicator in another sub-chart, add your 2nd assets list, save the layout, set alerts for different lists respectively.
---------- Disclaimer ----------
By using or requesting access to the indicator, you acknowledge that you have read and accepted that the indicator and any related content, including but not limited to: user manual, tutorials, ideas, videos, chats, emails, blog, are for the purpose of trading strategies studying and paper trading.
If a customer or user uses the indicator or related content mentioned above for live trading or investment, she/he should take all risks and responsibility.
---------- Updates ----------
The latest updates override the previous description.
To activate a update: Close the browser, Reopen the chart and apply the indicator.
【外汇资产突破预警】指标绘制一系列外汇资产的突破事件,提供突破预警
任何大趋势都开始于一系列的价格突破。通过监控突破事件,可以俯瞰市場的運動
---------- 产品特征------------
用户自定义的交易品种列表,多达30个品种
用户自定义的突破门槛
适用于宽泛的时间维度:1分钟--1月
绘制整个市场的突破历史
漸進顏色 根據突破的力度
------------- 指标设置说明 -------------------
"展示牛熊突破?": 展示牛突破,熊突破或者两者
“用户自定义突破门槛”: 自己定义突破门槛,999代表默认的设置
"綠色為牛?": 切換標籤顏色,默認綠色為牛
“交易所”:用来定义资产前缀,可以为空
“资产后缀”: 用来定义资产后缀,可以为空
---------- 版本描述 ----------------
產品特徵後續可能變化,恕不事先通知
DEMO版本供試用
----------- 獲取指標使用權 ------------
通過私信聯繫作者,要求訂閱或試用
----------- 安裝指標 -----------------
加指標 -》 Invite-Only (左邊欄目)
點贊或者收藏指標
點擊安裝指標
----------- 關於載入時間 ---------------
可能需要1--3分鐘來完成載入,取決於用戶的電腦和網絡速度,方便起見可以保持相關頁面持續開啟
------- FAQ ----------
1. 如何查看更早的突破歷史
由於系統限制,500 個標籤是上限
為了查看更早的突破,請選擇牛或者熊,而不是兩者;或者提高"用戶自定義突破門檻" 來過濾掉弱突破
2. 如何監控更多資產?
由於系統限制,30個資產是上限
為了監控更多資產,可以在第二個子圖表加載指標,保存圖表,分別在不同的圖表設置突破預警
---------- 免責聲明 ----------
在要求獲得本指標使用權之前以及在使用本指標之前,用戶認可已經完全了解和接受:本指標僅供學習交流目的, 它不構成任何交易建議或者投資建議。用戶如果將指標用於其他用途,應自行承擔所有風險和責任。
本指標的開發者並非專業投資顧問,因此不對用戶的任何行为負責。
最近的更新會覆蓋之前的說明。請參閱更新來查看指標的新特徵和功能

PpSIgnal Quantile Band 4.0Quantile band: In statistics and the theory of probability, quantiles are cutpoints dividing the range of a probability distribution into contiguous intervals with equal probabilities, or dividing the observations in a sample in the same way.
Quantitative Qualitative Estimation is based on a rather complex calculation of the smoothed RSI indicators.
The QQE indicator consists of a smoothed Relative Strength Index ( RSI ) indicator and two volatility-based trailing levels (fast and slow). The Fast Trailing Level (TL) and Slow TL are constructed by calculating the ATR of the smoothed RSI over n-periods and then further smoothing the ATR using an additional n-periods Wilders smoothing function. This smoothed ATR of RSI is then multiplied by the Fast and Slow ATR Multipliers to calculate the final Fast and Slow Trailing Levels.
Buy when the Quantile band is green.
Sell when the Quantile band is red.
when the quantile band is gray hold

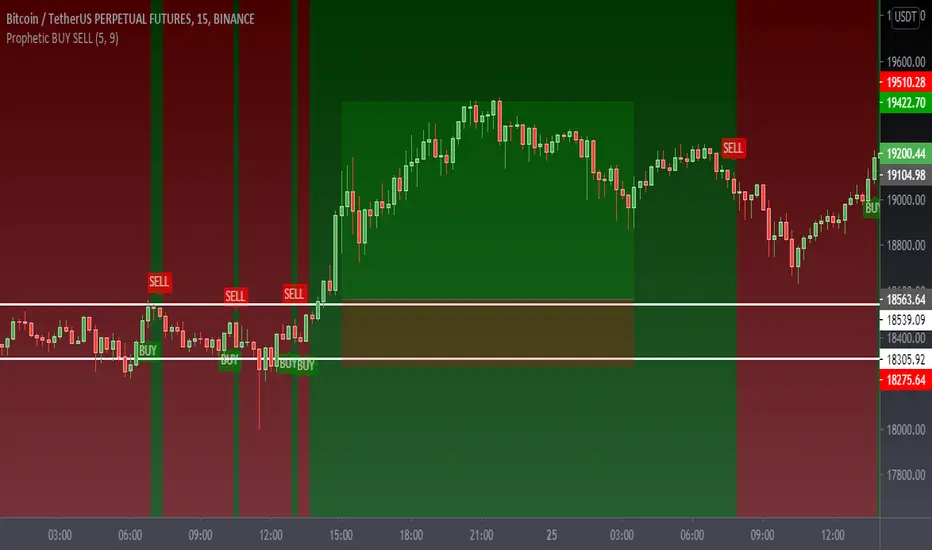
Prophetic BUY SELL IndicatorThis premium indicator will help you to do quick scalping on Cryptocurrencies, Forex, and Stocks.
This indicator is very simple to understand.
Green BUY Alert - Buy Signal Market is up
Red SELL Alert - Sell Signal Market is down
Caution:- Do not use it during market being choppy or sideways
Once the BUY signal appears the background changes green and same with SELL it turns red
can change the color according to requirements
It also has a moving average which also changes the color as the candles close above the MA or the below Default color are green and red
Please Like Share and Follow and if required please contact:- @mobudd (TELEGRAM)
or Ping me on trading view
Guys, It takes effort so please do not ask for free access.
You're always welcome to share any type of suggestion & feedback.
PpSignal Ehlers Deviation Scaled Moving AverageThe DSMA by John Ehlers is an adaptive moving average that features rapid adaptation to volatility in price movement. It accomplishes this adaptation by modifying the alpha term of an EMA by the amplitude of an oscillator scaled in standard deviations from the mean
When the color Is blue buy.
Red sell.

PpSignal Impulse MACD The Elder MACD Impulse (IMCAD) System is a combination of momentum and trend.
when IMACD is flat the market is accumulating.
There are two MACDs, one white short IMACD and a larger one that changes color long MACD.
Bu y when white IMCAD short is above 0 IMCAD Long is also above 0.
Sell when white IMCAD short is below 0 and IMCD long is also below 0.
Find divergence: You can also look for divergences to detect a change in trend
I do not use it as the sole indicator, of course, but it is a good complement to detect differences, and it also helps the automatic detector thereof

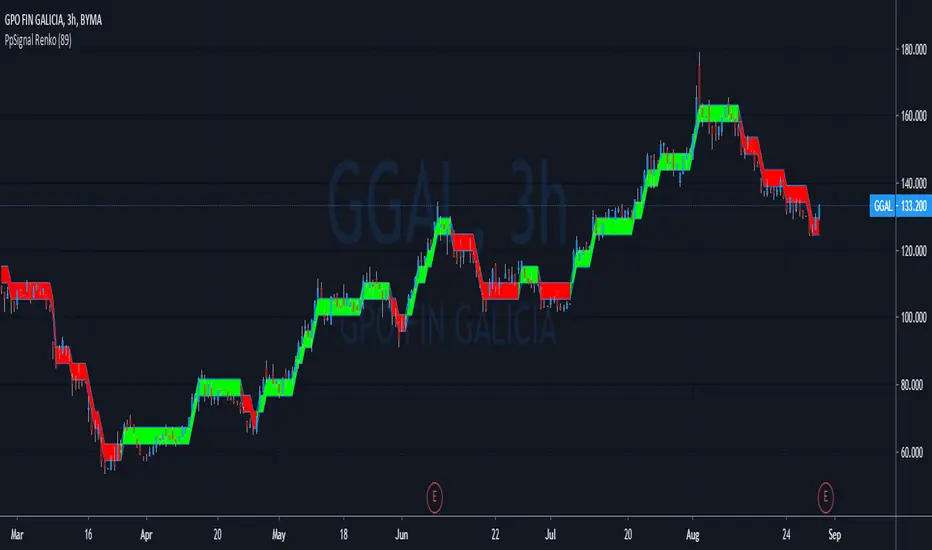
PpSignal RenkoA renko chart is a type of financial chart of Japanese origin used in technical analysis that measures and plots price changes. A renko chart consists of bricks, which proponents say more clearly show market trends and increase the signal-to-noise ratio compared to typical candlestick charts
PpSignal Renko emulator you can see the Renko chart and the candle in the same time.
Work with atr Average true range.
Buy when the Renko is lime end sell when the Renko is red.
Be careful the Renko chart changes color when the close Renko price is higher than the open Renko so it can repaint up to the close price of the current candle
ETS Trending ArrowsThis indicator is the end result of years of trial and error to create an indicator that aims to mimic market entry points that a professional trader would take.
It has arrows that clearly show potential market entry points, and suggested stop-loss levels. What I like about it is that it generally responds as fast to market changes as a good trader would, leaving you enough time to still validate the move before taking it.
This basically levels the playing field, because even if you're a rookie trader, or maybe an experienced trader in a slump, this indicator can help you to identify possible trading entry points that is responsive to market moves, and that can be used on different timeframes based on how you want to trade. And if you're an experienced trader, this indicator will help you like a good trading buddy to make good trading decisions.
What Makes It So Powerful?
- Give you a signal as early as possible and does not "repaint" once the bar completes
- Reacts to fast market direction changes like a master trader
- Is super easy to understand and implement in your trading
- Can be used for Forex, Stocks and Crypto
- Works on all timeframes
How To Use The ETS Trending Arrows Indicator
1. Add the indicator to any chart you wish to trade, Crypto, Forex or Stocks and set it to the timeframe you prefer. For instance, I use it on 1 minute and 5 minute charts for daytrading Stocks. For Forex I generally use a 15 minute chart, and longer timeframes for Crypto.
2. Open the Settings and change values to suit your requirements:
2.1. "Early Trigger Live Signals / Stable Signals" - When you select "Stable Signals", the arrows will appear once the bar closes, on the new bar. Selecting "Early Trigger" will signal instantly and can give you an early entry, but may update in some cases as conditions change.
2.2 "Show More Signals" - This pretty much does what it says. If you don't want all possible signals, this will scale things back a bit and give you fewer signals.
2.3. "Show 20, 50, 200 Moving Averages" - This is just a convenience, and is provided to help you exit trades, which I typically do when price crosses back over the 9 EMA or 20 EMA.
2.4. "Show 9 Expo Moving Average" - Also provided for convenience, and separate in case you don't want this level of detail.
2.5. "Show Immediate Reversals" - Personally I don't use this setting, but someone requested that I add it. What it will do is if there is a signal, which then immediately passes the "stoploss" dotted line, this will immediately give a signal in the opposite direction.
2.6. "Show Bollinger Bands" - This is also only provided for convenience, I use Bollinger Bands to determine where the market move is in relation to the average deviation.
2.7. "Bollinger Bands Length" - Simply the regular BB length setting.
2.8. "Bollinger Bands Deviation" - I use a 2.5 setting by default in order to better identify areas where the price action is really far beyond where it should be.
3. Now that you've set things up, all you need to do is to wait for a signal. As mentioned earlier, the signals will react differently based on whether you chose "Early Trigger Live Signals" or "Stable Signals". If you opt for "Early Trigger Live Signals", like I do, you should pay attention to where the market currently is in relation to the closest moving average, like the 9 EMA or 20 EMA. Keep in mind that price will often signal a new move, but then first move back to the average, before continuing in the new direction identified by the trading arrow.
4. These signals are intended to identify new trending moves, and for that reason, if the market moves against the signal, you should not hold on to your position hoping that it will turn in your favor.
5. When the market is moving in your favor, resist the urge to exit quickly, and use either (or both) the 9 EMA and 20 EMA to exit your trades. A good approach is to use the 9 EMA to exit a portion (maybe 50%) of your trade, and exit out of the rest once price closes above or below the 20 EMA depending on the direction of your trade.
This is an "invite only" script, which means that you will need to let me know that you're interested in it before you can get access to it. This is a paid script, please follow the link in my profile to get the details or ask me directly. It may take up to 48 hours for me to respond, but I do my best to respond as quickly as possible. You will get 7 days to test it for yourself on all your charts with no restrictions.

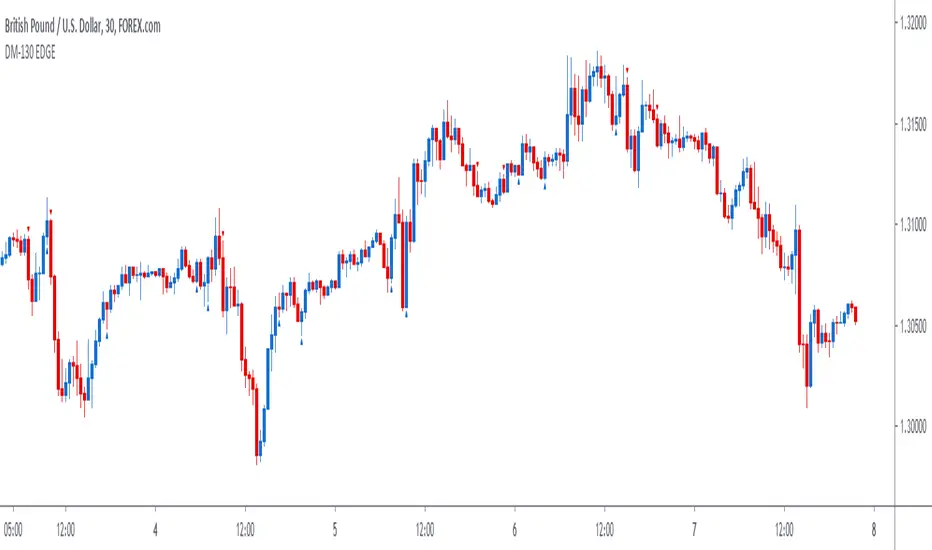
DM-130 EDGE SignalThe DM-130 EDGE is a price action trading signal indicator. There is no need for downloading nor installing. It is an effective signal indicator that has proven to be successful in trading. We will help you set it up within minutes so that you can start trading immediately. It works in trading most markets!
How To Use The DM-130 EDGE:
For a BUY, the signal will display a blue arrow below the candle stick facing upwards when there is a buying opportunity, a pullback or a bullish move in the market.
For a SELL, the signal will display a red arrow above the candle stick facing downwards when there is a selling opportunity, a pullback or a bearish move in the market.
Tradingview Account Level: All Users
The indicator appears once or twice during the UK trading sessions and works best in at confluence points:
1. A Trend Line
2. A Support or Resistant Level
3. Supply or Demand Zone
4. Off Pivots
5. Off a Fibonacci Level
6. In Trend Direction
Best Pair: GBP/USD
Best Trading Times: UK Sessions
How To Set Alerts:
Click on the Alerts button on the charts
Under 'Condition', change from the currency pair displayed to 'DM-130 EDGE Signal'
Then under 'Option' click on 'Once Per Bar'.
Make sure that the you tick the boxes that appeal to you under the 'Alert Actions' part (usually 'Notify on App' and 'Show Popup') and then click the 'Create' button at the bottom.
If you tick the 'Notify on App' box under 'Alerts Actions' the alerts would appear on your smart device if you have the Tradingview App set on the device.
Amongst many great benefits you will 1. Have the confidence to enter trades 2. Have the ability to enter trades after a pullback (something only experienced traders can spot that) and even more importantly 3. You can trade profitably with consistency even if you get stopped out a few times because the wins are usually bigger!
This strategy signal will analyse price action automatically when there is a high probability of a profitable trade to enter.
It does work on most markets. We recommend using the 30m charts as it works best with this indicator. This signal is ideal for intraday/day trading.
This signal allows you to enter trades with confidence.
Use the link below to obtain access to this indicator or you can send us a private message on Tradingview.
The SetUpps Strategy EDGE SignalThe SetUpps Trading Strategy HM-415 EDGE, DM-130 EDGE and MD-11 are price action trading signal indicators. There is no need for downloading nor installing. It is an effective signal indicator that has proven to be successful in trading. We will help you set it up within minutes so that you can start trading immediately. It works in trading most markets!
How To Use SetUpps Strategy Signals:
For a BUY, the SetUpps Signal will display a blue arrow below the candle stick facing upwards when there is a buying opportunity, a pullback or a bullish move in the market.
For a SELL, the SetUpps Signal will display a red arrow above the candle stick facing downwards when the is a selling opportunity, a pullback or a bearish move in the market.
The indicator works best in at confluence points:
1. A Trend Line
2. A Support or Resistant Level
3. Supply or Demand Zone
4. Off Pivots
5. Off a Fibonacci Level
How To Set Alerts:
Click on the Alerts button on the charts
Under 'Condition', change from the currency pair displayed to 'The SetUpps Strategy EDGE Signal'
Then under 'Option' click on 'Once Per Bar'.
Make sure that the you tick the boxes that appeal to you under the 'Alert Actions' part (usually 'Notify on App' and 'Show Popup') and then click the 'Create' button at the bottom.
If you tick the 'Notify on App' box under 'Alerts Actions' the alerts would appear on your smart device if you have the Tradingview App set on the device.
Amongst many great benefits you will 1. Have the confidence to enter trades 2. Have the ability to enter trades after a pullback (something only experienced traders can spot that) and even more importantly 3. You can trade profitably with consistency even if you get stopped out a few times because the wins are usually bigger!
The SetUpps Trading Strategy signals will analyse price action automatically when there is a high probability of a profitable trade to enter.
It does work on most markets on all time charts but we will give you our recommended time frames that works best with this indicator.
The SetUpps Strategy signal is ideal for scalping, intraday and for swing trading.
This signal allows you to enter trades with confidence.
Disclaimer:
Previous performances are not an indication of any future performances. We are not investment adviser nor do we advice you on trading. All our opinions, information, analysis, prices and/or market commentary are not advice about investments. Any SetUpps™ Trading staff or partners or representatives can not warrant the completeness, accuracy or timeliness of any information we have supplied and we shall not be liable for any losses or damages, consequential or otherwise, incurred by the use of our products which may be the result of relying on the SetUpps™ Trading strategy. © 2020 SetUpps™ Trading.
The SetUpps™ Trading indicator is built for use on Tradingview. SetUpps™ Trading is not part of Tradingview.

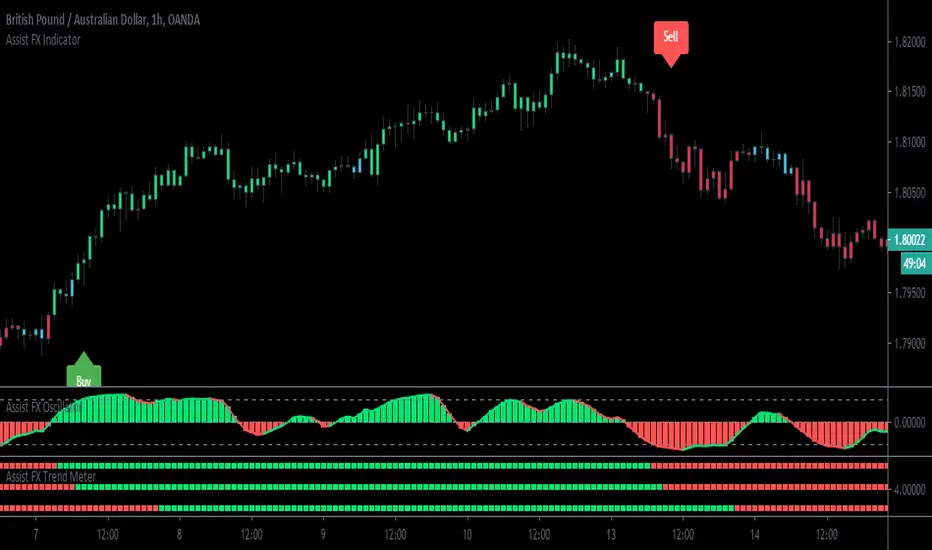
Assist FX IndicatorWelcome to The Assist FX Indicator/Toolkit
This is a Strategy we have been working on for a long time now and were ready for Release.
How Does it work you ask?
Our strategy will help you identify the current trend in the market and based off the market movement and 3 other Confluences will Place "Buy" and "Sell" Signals on your Chart - Just to note for File this signals to Not Repaint.
This takes away most of the Technical Analysis for you , Yes we Suggest you also use your own Knowledge and Influence before placing your trades.
When all criteria is met in the code our signals appear, You will get a Red Sell signal for if the market is looking to go bearish and if you get a green buy signal the market is looking to go Bullish.
If you have any other questions relating to the indicator or you would like access , Please do not hesitate to contact us via private message and we will be able to assist you
Have a great day!
Dexie Indicator v1.0The Dexie Indicator is a Forex indicator system built for the 5 min chart. It is suitable for Forex traders and Nadex users and provides BUY/SELL signals with alerts and comes with a series of 8 custom built Moving Averages designed to reduce the need for chart drawing.
This indicator can be used by beginners out of the box and requires very little trading experience to be successful.
The more advanced trader can work with this tool to greatly increase their success rate and make for a much more enjoyable trading experience.
Please contact for more details.
Dexie Indicator with BUY/SELL signals displayed only:
Dexie Indicator with BUY/SELL signals, Bollinger Bands and custom Moving Averages:
Dexie Indicator with all custom Moving Averages displayed:
Dexie Indicator slower Moving average bull cross example:
Dexie Indicator slower Moving average bear cross example:

Dexie Indicator v1.0The Dexie Indicator is a complete Forex trading system built for the 5 min chart. It is suitable for Nadex users and provides BUY/SELL signals with alerts and comes with a series of 8 custom built Moving Averages designed to reduce the need for chart drawing.
This indicator can be used by beginners out of the box and requires very little trading experience to be successful.
The more advanced trader can work with this tool to greatly increase their success rate and make for a much more enjoyable trading experience.
Please contact for more details.
Dexie Indicator with BUY/SELL signals displayed only:
Dexie Indicator with BUY/SELL signals, Bollinger Bands and custom Moving Averages
Dexie Indicator with all custom Moving Averages displayed

HFT The Ultimate Trend IndicatorThis is a trend following based strategy developed by HFT Research.
It works on Stocks, Forex and Cryptocurrency markets
This indicator comes fine tuned out of the box. It works on best on 15min, 1 hour and 4 hour time frames. It provides 3 separate entries for each of the time frames, providing you 12 different entry options.
Each time frame has the following options to choose from
You can use 1 hour settings on 15min chart however, it may not work the best.
Moderate entry will give you the modest amount of trades with modest amount of risk
Aggressive entry will give you wild entries and lots of action, if you are willing to babysit the trades, it might be an option for you
Conservative entry are best for those who want to automate the strategy or for those that don't have the time to trade the alerts actively

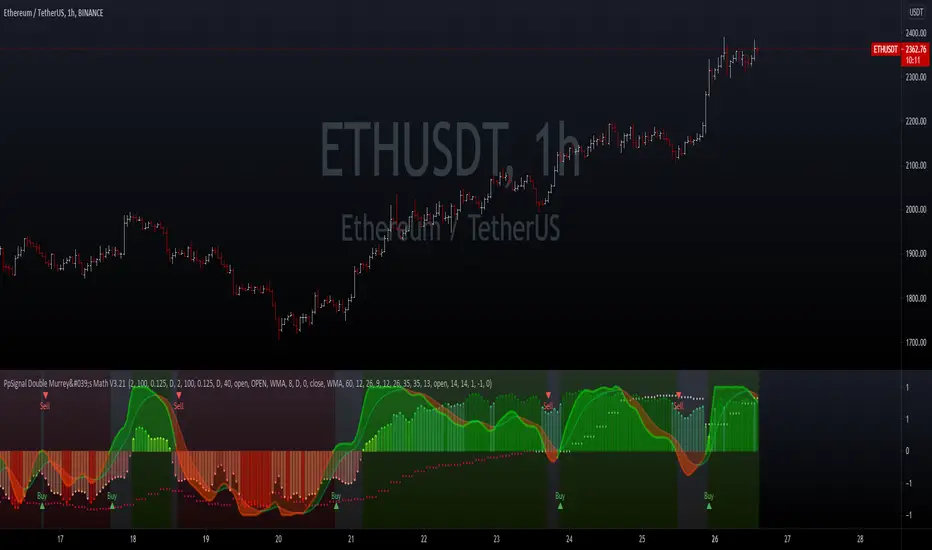
PpSIgnal Double Murrey's Math StrategyA forex indicator is a statistical tool that currency traders use to make judgments about the direction of a currency pair’s price action. Forex indicators come in many types, including leading indicators, lagging indicators, confirming indicators and so on. Popular forex indicators include moving averages, relative strength index (RSI) and average true range (ATR). A forex trader must choose the indicators that fit his or her trading strategy.
we added universal oscillator by elder and mtf in superior automatics time.
Buy when the oscillator Murray math is green and universal oscillator is green too.
Sell when the MM oscillator is red and universal oscillator is red too.
we added additional volume in bar indicator...enjoy it
PpSignal OSCILLATORThe Ppsignal oscillator is calculated based on LWMA and smoothed with the elder formula to avoid trending noise.
Each asset has its settings so you should go looking for the best set yourself.
Buy when the oscillator is yellow Sell when it is red.

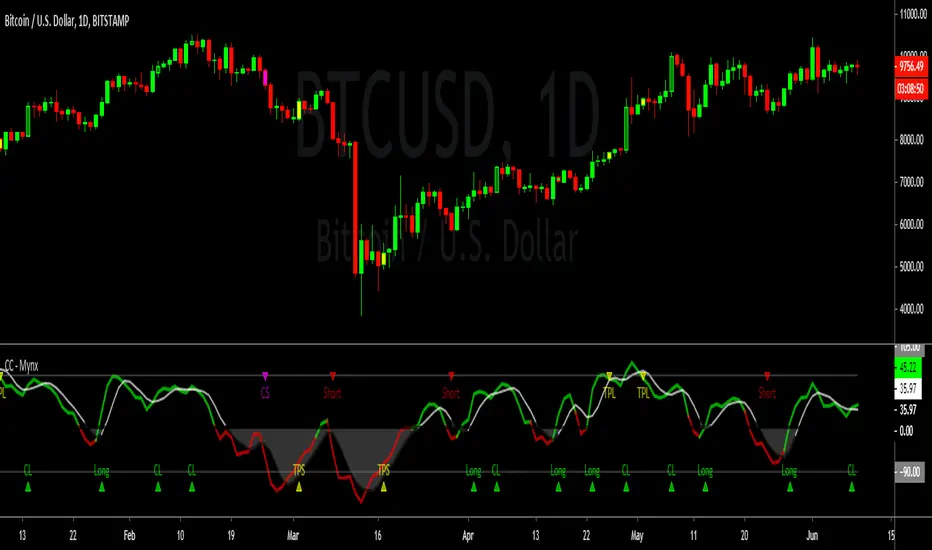
Cracking Cryptocurrency - MynxCracking Cryptocurrency - Mynx
Mynx is a powerful trend-following indicator which logic built in to facilitate nuanced aspects of PTP strategy. Continuation Trades, Early Exit Signals and Full Take Profit Signals are all built into Mynx. Mynx is designed to identify when the market is signaling that a trend is beginning as well as signalling when you may safely re-enter into a pre-existing trend. It also tells you where to exit prematurely to avoid significant capital loss on a losing trade, and when to take full profit in order to get out of a position at maximum profitability.
Should you have difficulty adding it you can search for 'Cracking' in the indicator window of your Trading View Platform, and it will appear along with the rest of our indicators.
As you will notice, Mynx is similar in nature to Time Transformation, in that it is both a Centered Oscillator and a Line Cross Indicator. This allows a wide range of possibilities which we will exploit to extract profit out of the market.
The most important line is the BPM or Mynx Line. This is going to be the thicker, brighter colored line on our indicator that will switch from green to red depending on the dominant trend. The color changing feature of this line will denote where our indicator is in relation to our zero line. If our BPM Line is green, then price is trading above our zero line, if red than it is trading below. Therefore we can quickly see what our last signal was, and whether our indicator is bullish or bearish depending upon the color of our BPM Line. If Green, we are in long territory, if red we are looking for shorts.
Our second area of importance in this indicator is our Noise Line and Area. This is the black or white line which will change color depending on where Noise is relative to our zero line. Black if above the zero line, meaning we are in long territory, and white if below, indicating we are in shorting territory. The area between the zero line and the Noise Line is shaded black or white as well, and denotes no-trade zones for us. If our BPM Line is within our Noise Area, we are not in a trade. We are only in a trade when our BPM Line is breaking away from Noise Line, either to the upside or the downside. When BPM curls back and re-enters our Noise Area, that is an indication to exit our position regardless of our Take Profits or Stop Losses.
Our Zero Line is indicated by a thick black line for easy of identification, which will be our primary signal generator when our BPM Line crosses above or below it, and our faint gray lines are going to be our Overbought and Oversold levels respectively. These will play a function in how we take profits.
Settings
Let's take a look at the settings of our Mynx Indicator.
The first field we will see is our BPM Source, how many beats per minute we want in our cycle length. The default is ten, and through back-testing I find this to be the optimum level.
Our Noise Filtration level corresponds to our Noise Line and Area. Again, I find the default settings as I have programmed them work best on all time frames, however you might find optimum signals by playing around with these settings. As in all things, nuance and experimentation is what excellence is borne of.
We can adjust our Oversold and Overbought Parameters, making it easier or harder for us to get a Full Take Profit Signal from this indicator. We can also adjust our Base Line. Keep in mind, our Base Line is going to be an Exponential Moving Average and here we can adjust the length of our desired Base Line.
To incorporate our Multi-Time Frame feature, below this section we can see that the default option will be to use a Base Line of the current time frame. If however, we want to trade on a Lower Time Frame and reference a base line of another time frame, we can simply un-check that box and input the desired Time Frame of the Base Line we wish to reference.
Now for the true appeal of Mynx in user friendliness, below this we can see that we have full control of the signals we want Mynx to generate for us. By default, we have enabled Mynx's best signals, Trending Signals. We can choose to plot Continuation Crosses and Reversals Within the Trend, both of which are trades we are allowed to take and I recommend taking in a proper PTP system. We can choose to use Mynx as a reversal indicator, to plot Raw Reversals against the trend, which I do not recommend enabling unless you want to by pass PTP entirely. We can choose to plot when Mynx gives us a Full Take Profit signal, a signal to take full profits on our position. We also have the option to plot for early exits. The Option for Sensitive Stop Loss is the same as early exits, and will plot an exit signal every time the BPM Line drifts back into the Noise Area. These are fairly easy to see upon bar closes, so I left it disabled by default. If you enable it you will get a visual signal to exit your position upon a bar close.
One final note, we can adjust the source upon which Mynx is basing her signals. By default, this value is hl2 , which I found in back-testing to be the most efficient with minimum draw down. However, there is a higher profit potential with HLC3 and OHLC4, but be warned that with that extra profit potential comes the risk of more draw down. The draw down settles out in the end, however there will be months where you drastically under perform Alpha, where as hl2 keeps you consistently outperforming the market at all times. This is a very personal choice, and I leave it upon you to make the right one.
In our Style Tab, we can adjust our Color Scheme to better accommodate the way that you trade. I have done my best to be very concise and detailed in labeling to make this task easy.
Strategy
Please let me know of your success stories with Mynx, as well as any features you think would be helpful to add. If you notice any errors within it, please notify me so I can fix them. I have back-tested this strategy many times in many different settings, and it consistently outperforms the market and generates Alpha. I now place it within your hands to achieve the same results. Trade Safely.
Musashi-Hidden-Wave Trading SystemThis Indicator is a full trading system that offers setups with Entries and Targets and Trade Management. This indicator is very accurate because it uses advanced setup detection and filtering logic.
The setup is triggered if the price passes the blue dash. Do not enter the trade unless price passes the blue dash. Each setup has 3 possible targets, which are dashes colored green for longs and red for shorts.
You can use the baseline (which is a trend-line that is either green for bullish or red for bearish ) to manage the trade. You should only enter long trades if the trend-line is green, and only enter short trades if the trend-line is red. One strategy would be if you enter a trade long, and reach the first target, you can take some profits, but still let the some of the position run, where a bar closing beyond the baseline or breaks a prior opposite pivot, would stop out your remaining position.
To summarize:
Blue Dash = Entry Trigger
Green Dashes = Long Targets (3 of them, for different price targets: target 1, 2 and 3)
Red Dashes = Short Targets (3 of them, for different price targets: target 1, 2 and 3)
The great thing about this indicator is that its universal, there are no settings necessary -- just put it on the chart and it finds high probability setups and paints it on the chart as they occur. There is NO Repainting with this indicator.
Of course, you can add other indicators if you wish, and even add this indicator to your existing trading system.
Again, this indicator does NOT repaint.
Once a setup is found, the indicator draws the entry trigger price and the targets at the setup bar close.
Setup Alerts are fully supported, via email, sms , and desktop notification.
*If you wish to license this indicator, please contact me via private message for details regarding access. Thank you.
LEGAL STUFF:
Risk Disclosure
Futures , forex, stock, crypto and derivative trading contains substantial risk and is not for every investor. An investor could potentially lose all or more than the initial investment. Risk capital is money that can be lost without jeopardizing ones’ financial security or life style. Only risk capital should be used for trading and only those with sufficient risk capital should consider trading. Past performance is not necessarily indicative of future results
Hypothetical Performance Disclosure
Hypothetical performance results have many inherent limitations, some of which are described below. no representation is being made that any account will or is likely to achieve profits or losses similar to those shown; in fact, there are frequently sharp differences between hypothetical performance results and the actual results subsequently achieved by any particular trading program. One of the limitations of hypothetical performance results is that they are generally prepared with the benefit of hindsight. In addition, hypothetical trading does not involve financial risk, and no hypothetical trading record can completely account for the impact of financial risk of actual trading. for example, the ability to withstand losses or to adhere to a particular trading program in spite of trading losses are material points which can also adversely affect actual trading results. There are numerous other factors related to the markets in general or to the implementation of any specific trading program which cannot be fully accounted for in the preparation of hypothetical performance results and all which can adversely affect trading results

Theft Indicator - BOOM Buy/Sell SignalsWhat is our indicator?
Theft Indicator - BOOM is a script that shows entry levels on a condition that is met with our special algo. The algo consists of crossovers, which are not visible but we take pride in the effort we have put to make this indicator have a high success rate as long as you have a scalping target price set.
Does it Repaint?
Our indicator does NOT re-paint. Although while setting an alert it may pop up the repaint alert, please take into consideration that once a signal is fired on a "CLOSED BAR", our signal will never disappear, they do not repaint.
What Markets is it usable with?
You can use it in any market, Forex, Stocks, Crypto, Indices. All time frames work, not all trades will be profitable (this is how trading is, you can take a loss sometimes). But the Majority is profitable if you use a stop loss and target price.
How to use:
Simple plug and play it to your chart, in addition to a few other indicators we will recommend to you (we still have not published them yet), and this will confirm your trades. You can also connect TV alerts with a bot and let it run. Please be aware that SLIPPAGE time is important, If you run a bot on this indicator you HAVE to know that the buy/sell price will be on the bar AFTER the Candle close (For example: the BUY/SELL alert is on a candle, the buy/sell your bot or you will execute WILL be in the following candle depending on your trading system. We advise you to not leave the bot to trade on its own, you have to monitor and have a specific syntax that we will help you with creating according to your trading style.
P.S: This is not financial advice, we are just sharing our indicator that we know has good results, and it will take time for people in -ve profiles to recover losses and for the profiting to be more profitable. We use a specific trading method that only works with it
You can contact me for more information about the indicator, Goodluck :)
