Kent Directional Filter🧭 Kent Directional Filter
Author: GabrielAmadeusLau
Type: Filter
📖 What It Is
The Kent Directional Filter is a directionality-sensitive smoothing tool inspired by the Kent distribution, a probability model used to describe directional and elliptical shapes on a sphere. In this context, it's repurposed for analyzing the angular trajectory of price movements and smoothing them for actionable insights.
It’s ideal for:
Detecting directional bias with probabilistic weighting
Enhancing momentum or trend-following systems
Filtering non-linear price action
🔬 How It Works
Price Angle Estimation:
Computes a rough angular shift in price using atan(src - src ) to estimate direction.
Kent Distribution Weighting:
κ (kappa) controls concentration strength (how sharply it prefers a direction).
β (beta) controls ellipticity (bias toward curved vs. linear moves).
These parameters influence how strongly the indicator favors movements at ~45° angles, simulating a directional “lens.”
Smoothing:
A Simple Moving Average (SMA) is applied over the raw directional probabilities to reduce noise and highlight the underlying trend signal.
⚙️ Inputs
Source: Price series used for angle calculation (default: close)
Smoothing Length: Window size for the moving average
Pi Divisor: Pi / 4 would be 45 degrees, you can change the 4 to 3, 2, etc.
Kappa (κ): Controls how focused the directionality is (higher = sharper filter)
Beta (β): Adds curvature sensitivity; higher values accentuate asymmetrical moves
🧠 Tips for Best Results
Use κ = 1–2 for moderate directional filtering, and β = 0.3–0.7 for smooth elliptical bias.
Combine with volume-based indicators to confirm breakout strength.
Works best in higher timeframes (1h–1D) to capture macro directional structure.
I might revisit this.
Fundamental Analysis

Sessions with Extended LinesClear Sessions with lines showing upper and lower.
This script can be used with multiple different stances.
The main ones being looking for ORB breakouts or liquidity sweeps

Beta calculatorCalculates the market beta for the stock that is on your screen. You may change the parameters by changing the symbol you are using as benchmark to calculate market beta in the settings. This will affect the market beta you get. VTI is used since it has a theoretical market beta of 1.

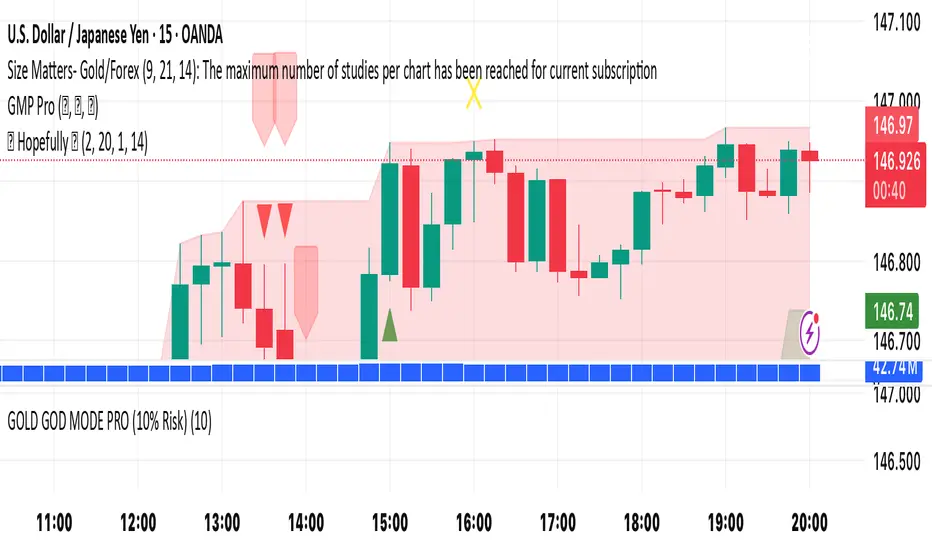
🚀 Hopefully 🤲🏻It’s a simple yet effective indicator. Its power level is high. Its secret lays in its dynamics. Simply “BUY’ when you see green triangle & "SELL" when you see red triangle 🔺. Do your own due diligence and remember to always be disciplined and focused 🧘
Happy trading to you all ☮️
Quarterly Earnings with NPMQuarterly Earnings with NPM can be used to compare earnings for Indian stocks QOQ or YOY, also shows the revenue or Mcap of any company.

RSI First Condition SignalsBuy signal with the exit of RSI from the bottom to the top of the number 30.
Sell signal with RSI exit from above 70 to below. The longer the RSI stays above the overbought zone, i.e above 70, and then breaks below 70,
the stronger the sell signal.
The longer the RSI stays below thw oversold zone, i.e. below 70, and then exits above 30,the stronger the buy signal.
And if the RSI exits below the 70 line with a steeper slope, the sell signal is valid.
And if the RSI exits with a steeper slope above 30, the buy signal is valid .

🇰🇷 Kim'in Kim'out — Korean Premium TrackerKim’in Kim’out is a premium-tracking TradingView indicator that reveals Korean market sentiment by comparing real-time asset prices on Upbit (KRW) and Binance (USDT).
It detects when Korean traders are spot accumulating (Kim’in) or spot distributing (Kim’out) — enhanced by volume confirmation and trend context.
Perfect for crypto scalpers, swing traders, and arbitrage hunters.
⚙️ How It Works
Kimchi Premium: Measures how much more (or less) Koreans are paying on Upbit compared to Binance.
Volume Confirmation: Filters signals by comparing Upbit volume vs its moving average.
Signal Logic:
🔼 Kim’in: Premium exceeds the buy threshold + high volume
🔽 Kim’out: Premium drops below the sell threshold + high volume
Trend Context: Premium trend line gives insight into sustained interest/disinterest.
🎛️ Settings Overview
Input Description
Select Cryptocurrency Choose from supported coins (BTC, ETH, SOL, etc.)
Buy Threshold (%) How high the premium must be to trigger a Kim’in signal
Sell Threshold (%) How low the premium must be to trigger a Kim’out signal
Volume MA Period The number of candles for volume average
Volume Multiplier Volume spike ratio needed to confirm a signal
Show Info Table Toggle detailed premium stats in a side panel
Show Premium Zones Visual background zones (green/red/yellow)
Debug Mode Shows extra signals that trigger without volume confirmation
✅ How to Use It
Add the indicator to any chart (e.g. BTC/USDT)
Choose a coin from the dropdown (BTC, ETH, etc.)
Watch for:
Green Triangle Up (Kim’in) = Korean spot buy pressure confirmed
Red Triangle Down (Kim’out) = Korean selloff or disinterest
Use the Info Table (top-right) to see:
Premium %
Volume confirmation
Real-time KRW-USD exchange rate
Upbit vs Binance price comparison
Set Alerts:
Right-click on a signal → Add Alert on "Kim’in" or "Kim’out"
Or use the prebuilt alertconditions
🔔 Alert Messages
🇰🇷 Korean Premium BUY signal detected → Kim’in
🇰🇷 Korean Premium SELL signal detected → Kim’out
🧪 Best Practices
Use on 1H or 4H timeframe for best results
Confirm with broader market structure or confluence tools
Spot divergences between Binance and Upbit to predict regional flow shifts
🚫 Limitations
Works only with coins that have both Binance USDT & Upbit KRW pairs
Premium may be delayed by low liquidity or FX rate fluctuations (USDKRW)
Not suitable for lowcaps not listed on Upbit
Created by UKMC Crypto

Quarterly Earnings
Easy to access fundamentals of a company on the chart.
EPS and Sales data of post quarters

Gold vs DXYThe 30-day rolling correlation between Gold (XAU/USD) and the US Dollar Index (DXY) shows how closely the two move together — or more often, in opposite directions — over the last 30 trading days. In most market environments, the relationship is pretty straightforward: when the dollar goes up, gold tends to go down, and vice versa. That’s because gold is priced in dollars, so a stronger dollar makes it more expensive for international buyers, which usually softens demand.
But it’s not always that simple. There are times when this inverse correlation breaks down. For example, if real yields (like the US 10-year yield minus inflation expectations) are rising, that can pressure gold even if the dollar is falling — because higher real returns elsewhere make gold less attractive. Another case is when other currencies, like the euro or yen, rally strongly on their own central bank decisions. This can pull DXY lower without necessarily signaling weakness in the U.S. economy — meaning gold might not benefit much.
There are also “risk-on” moments where investors rotate into equities or crypto, selling off both gold and the dollar in favor of yield or momentum. And during periods of crisis or uncertainty, both gold and the dollar can rise together as safe-haven assets, breaking the usual pattern entirely.
That’s why tracking the rolling correlation is helpful. It shows whether the historical relationship between gold and the dollar is still holding — or if we’re entering a different market regime. It’s not about predicting exact price moves, but about understanding the current backdrop. When gold and DXY are moving out of sync as expected, it can support your trade thesis. But when the correlation flattens or flips, it’s often a sign to dig deeper — macro forces may be shifting.

Trinity Multi Time Frame Trend Dashboard and SignalsUpdated the logic behind the buy and sell signals to them for more responsiveness and also included an ADX filter.

US Macro Indicators (CPI YoY, PPI YoY, Interest Rate)US Macro Indicators (CPI YoY, PPI YoY, Interest Rate)
This indicator overlays the most important US macroeconomic trends for professional traders and analysts:
CPI YoY (%): Tracks year-over-year change in the Consumer Price Index, the main measure of consumer inflation, and a core focus for Federal Reserve policy.
PPI YoY (%): Shows year-over-year change in the Producer Price Index, often a leading indicator for future consumer inflation and margin pressures.
Fed Funds Rate (%): Plots the US benchmark interest rate, reflecting the real-time stance of US monetary policy.
Additional Features:
Key policy thresholds highlighted:
2% (Fed’s formal inflation target)
1.5% (comfort floor)
3% and 4% (upper risk/watch zones for inflation)
Transparent background shading signals elevated inflation zones for quick visual risk assessment.
Works on all asset charts and timeframes (macro data is monthly).
Why use it?
This tool lets you instantly visualize inflation trends versus policy and spot key macro inflection points for equities, FX, and rates. Perfect for anyone applying macro fundamentals to tactical trading and investment decisions.

SMC Smart Money Concepts//@version=5
indicator("SMC Smart Money Concepts", overlay=true)
// === إعداد الهيكل السعري ===
// تحديد HH, HL, LL, LH
pivotHigh = ta.pivothigh(high, 5, 5)
pivotLow = ta.pivotlow(low, 5, 5)
plotshape(pivotHigh, location=location.abovebar, style=shape.triangleup, color=color.red, title="Lower High")
plotshape(pivotLow, location=location.belowbar, style=shape.triangledown, color=color.green, title="Higher Low")
// === Break of Structure & CHoCH ===
bos = pivotHigh and close > high
choch = pivotLow and close < low
plotshape(bos, location=location.abovebar, color=color.blue, style=shape.labelup, text="BOS")
plotshape(choch, location=location.belowbar, color=color.orange, style=shape.labeldown, text="CHOCH")
// === Order Blocks (OB) ===
// نأخذ آخر شمعة صاعدة قبل هبوط قوي كمثال على OB
bearishOB = high < high and close < open
bullishOB = low > low and close > open
plotshape(bearishOB, location=location.abovebar, color=color.maroon, style=shape.square, title="Bearish OB")
plotshape(bullishOB, location=location.belowbar, color=color.lime, style=shape.square, title="Bullish OB")
// === Fair Value Gap (FVG) ===
// إذا لم تلامس الشمعة التالية قاع أو قمة شمعتين قبليتين
fvgBull = low > high
fvgBear = high < low
plotshape(fvgBull, location=location.belowbar, color=color.teal, style=shape.circle, title="Bullish FVG")
plotshape(fvgBear, location=location.abovebar, color=color.fuchsia, style=shape.circle, title="Bearish FVG")
// === السيولة (Liquidity Pools) ===
// تعتبر السيولة موجودة عند قمم أو قيعان واضحة
liquidityHigh = high == ta.highest(high, 20)
liquidityLow = low == ta.lowest(low, 20)
plotshape(liquidityHigh, location=location.abovebar, color=color.purple, style=shape.cross, title="Liquidity High")
plotshape(liquidityLow, location=location.belowbar, color=color.purple, style=shape.cross, title="Liquidity Low")
FVG 9:31–10:00 AM ETFVG 9:31–10:00 AM ET - Script Description
What This Script Does
This indicator finds **Fair Value Gaps (FVGs)** that form during the first 29 minutes of the U.S. stock market (9:31 AM to 10:00 AM Eastern Time). A Fair Value Gap is a price imbalance where there's a gap between candles that often becomes an important support or resistance level.
Key Features:
- **Time Window**: Only looks for FVGs between 9:31-10:00 AM ET (most important opening period)
- **One Per Day**: Finds only the first FVG that forms in this time window each day
- **Visual Display**: Draws a purple box around the gap with a clear "FVG" label
- **Price Tracking**: Monitors when price comes back to test the gap level
- **Alert System**: Sends notifications when price returns to the FVG zone
How FVGs Are Detected:
- **Bullish FVG**: When there's a gap up (low of middle candle is above high of 3rd candle back)
- **Bearish FVG**: When there's a gap down (high of middle candle is below low of 3rd candle back)
The 9:31-10:00 AM window is chosen because this is when institutions and algorithms create their biggest price moves right after market open, making these gaps very reliable.
Customization Options
User Settings
Extend FVG Box (Bars)
- **What it does**: Makes the purple box longer to the right
- **Default**: 0 (box ends right after the gap forms)
- **Options**: Any number from 0 to 100+
- **When to use**:
- Keep at 0 for clean historical view
- Set to 10-20 to track the gap during the current session
- Set higher for longer reference
Code Settings (Can Be Changed)
Time Window
- **Start**: 9:31 AM Eastern Time
- **End**: 10:00 AM Eastern Time
- **Can modify**: Change the hour/minute numbers in the code
Visual Style
- **Color**: Purple with see-through background
- **Label**: Shows "FVG" text in white
- **Can modify**: Change colors and transparency in the code
How to Use:
Setup
Chart Settings
1. Use 1-minute, 5-minute, or 15-minute charts (works best on these timeframes)
2. Apply to liquid markets like ES, NQ, major stocks, or forex pairs
3. Set the "Extend FVG Box" to your preference (start with 0 or 10)
What You'll See
- A purple box appears when an FVG forms during 9:31-10:00 AM
- Box shows the exact price levels of the gap
- "FVG" label appears on the box
- Only one FVG per day will be marked
Trading Strategies
Basic FVG Trading
1. **Wait for Formation**: Let the purple box appear during 9:31-10:00 AM
2. **Watch Price Movement**: See if price moves away from the gap
3. **Enter on Retest**: When price comes back to the purple box area, consider entering
4. **Trade Direction**:
- Bullish FVG = look for long opportunities when price retests
- Bearish FVG = look for short opportunities when price retests
Entry Methods
- **Bounce Play**: Enter when price touches the FVG box and bounces away
- **Break Play**: Enter if price strongly breaks through the FVG box
- **Rejection Play**: Enter opposite direction if price gets rejected at the FVG
Risk Management
Stop Losses
- Place stops just outside the FVG box (a few ticks beyond the gap)
- If trading a bounce, stop goes on opposite side of the gap
- If trading a break, stop goes back inside the gap
Position Sizing
- Start small until you understand how FVGs work in your market
- Bigger gaps = smaller position size (more risk)
- Smaller gaps = can use larger position size
Profit Targets
- Take profits at obvious levels like round numbers, previous highs/lows
- Consider taking half profits at 1:1 risk/reward ratio
- Let some position run if the move is strong
Best Practices
When It Works Best
- High-volume stocks and futures (ES, NQ work great)
- Normal market days without major news during the 9:31-10:00 window
- When there's clear institutional activity in the opening period
When to Be Careful
- Low-volume stocks or markets
- Major economic news releases during the time window
- Market holidays when volume is low
- Very choppy or sideways days
Alert Usage
- The script will alert you when price comes back to test the FVG
- Don't trade the alert blindly - always check the current market situation
- Use the alert as a heads-up to start watching the setup more closely
Tips for Success
- The earlier the FVG forms in the 9:31-10:00 window, often the more significant it is
- FVGs that form with high volume are usually more reliable
- Always consider the overall market direction - don't fight the main trend
- Practice on paper first to understand how FVGs behave in your chosen market
🔗 Works Best With:
✅ Liquidity Levels — Smart Swing Lows: Spot key structural lows that can fuel stop hunts and reversals.
✅ ICT Turtle Soup — Liquidity Reversal: Add a classic reversal pattern to your toolkit to catch fakeouts cleanly.
✅ ICT SMC Liquidity Grabs and OBs- Liquidity Grabs, Order Block Zones, and Fibonacci OTE Levels, allowing traders to identify institutional entry models with clean, rule-based visual signals.
This script is most valuable for day traders who want to catch institutional moves right after market open, but it can also help swing traders identify important intraday levels.
✅ ICT Macro Zones (Grey Box Version)- It tracks real-time highs and lows for each Silver Bullet session.
✅ Weekly Opening Gap (cryptonnnite)

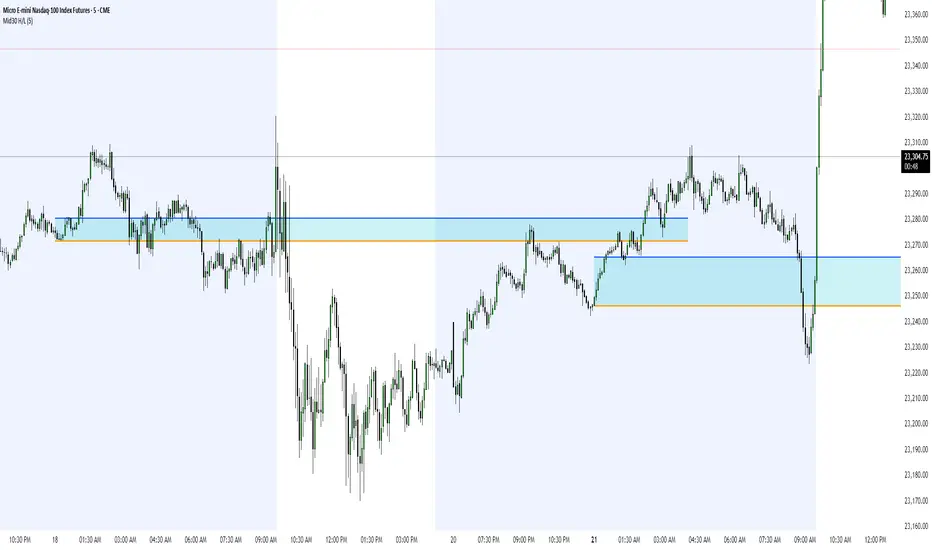
Midnight 30min High/LowMidnight 30min High/Low — Overnight Liquidity Range Tracker
Capture the Overnight Session: A Strategic Level Identification Tool from Professional Trading Methodology
This indicator captures the high and low prices during the critical 30-minute midnight session (12:00-12:30 AM EST) and projects these levels forward as key support and resistance zones. These overnight ranges often contain significant liquidity and serve as crucial reference points for intraday price action, representing areas where institutional activity may have established important levels.
🔍 What This Script Does:
Identifies Critical Overnight Session Levels
- Automatically detects the 12:00-12:30 AM EST session window
- Captures the highest and lowest prices during this 30-minute period
- Projects these levels forward for multiple trading days
Creates Dynamic Support/Resistance Zones
- Extends midnight high/low levels as horizontal lines with customizable projection periods
- Fills the area between high and low to create a visual trading range
- Updates automatically each trading day with new overnight levels
Provides Clear Visual Reference Points
- Optional session start markers (●) highlight when the midnight session begins
- Color-coded lines distinguish between high and low levels
- Transparent fill area creates an easy-to-identify trading zone
Real-Time Level Tracking
- Updates levels in real-time during the active midnight session
- Maintains historical levels for reference and backtesting
- Compatible with data window for precise level values
⚙️ Customization Options:
Extend Days (1-30):** Control how many days forward the levels are projected (default: 5 days)
High Line Color:** Customize the midnight high line color (default: blue)
Low Line Color:** Customize the midnight low line color (default: orange)
Fill Color:** Adjust the transparency and color of the range area (default: light aqua, 80% transparency)
Show Session Markers:** Toggle yellow session start indicators on/off (default: enabled)
💡 How to Use:
Deploy on lower timeframes (1m-15m) for precise level identification and reaction monitoring**
Watch for key price interactions:
- Rejection at midnight high levels (potential resistance)
- Bounce from midnight low levels (potential support)
- Range-bound trading between the high and low levels
Combine with liquidity concepts:
- Monitor for stop hunts above/below these levels
- Look for false breakouts that snap back into the range
- Use as confluence with other ICT concepts like FVGs and Order Blocks
Strategic Applications:
- Range trading between midnight levels
- Breakout confirmation when price closes decisively outside the range
- Support/resistance validation for entry and exit planning
🔗 Combine With These Tools for Complete Market Structure Analysis:
✅ First FVG — Opening Range Fair Value Gap Detector.
✅ ICT Turtle Soup (Liquidity Reversal)— Spot stop hunts and false breakout scenarios.
✅ ICT Macro Zones (Grey Box Version)- It tracks real-time highs and lows for each Silver Bullet session.
✅ ICT SMC Liquidity Grabs and OBs- Liquidity Grabs, Order Block Zones, and Fibonacci OTE Levels, allowing traders to identify institutional entry models with clean, rule-based visual signals.
Together, these tools create a comprehensive Smart Money Concepts (SMC) framework — helping traders identify, anticipate, and capitalize on institutional-level price movements with precision and confidence during critical overnight sessions. Also, dont forget to not over-trade.
Midnight 30min High/LowMidnight 30min High/Low — Overnight Liquidity Range Tracker
Capture the Overnight Session: A Strategic Level Identification Tool from Professional Trading Methodology
This indicator captures the high and low prices during the critical 30-minute midnight session (12:00-12:30 AM EST) and projects these levels forward as key support and resistance zones. These overnight ranges often contain significant liquidity and serve as crucial reference points for intraday price action, representing areas where institutional activity may have established important levels.
🔍 What This Script Does:
Identifies Critical Overnight Session Levels
- Automatically detects the 12:00-12:30 AM EST session window
- Captures the highest and lowest prices during this 30-minute period
- Projects these levels forward for multiple trading days
Creates Dynamic Support/Resistance Zones
- Extends midnight high/low levels as horizontal lines with customizable projection periods
- Fills the area between high and low to create a visual trading range
- Updates automatically each trading day with new overnight levels
Provides Clear Visual Reference Points
- Optional session start markers (●) highlight when the midnight session begins
- Color-coded lines distinguish between high and low levels
- Transparent fill area creates an easy-to-identify trading zone
Real-Time Level Tracking
- Updates levels in real-time during the active midnight session
- Maintains historical levels for reference and backtesting
- Compatible with data window for precise level values
⚙️ Customization Options:
Extend Days (1-30):** Control how many days forward the levels are projected (default: 5 days)
High Line Color:** Customize the midnight high line color (default: blue)
Low Line Color:** Customize the midnight low line color (default: orange)
Fill Color:** Adjust the transparency and color of the range area (default: light aqua, 80% transparency)
Show Session Markers:** Toggle yellow session start indicators on/off (default: enabled)
💡 How to Use:
Deploy on lower timeframes (1m-15m) for precise level identification and reaction monitoring**
Watch for key price interactions:
- Rejection at midnight high levels (potential resistance)
- Bounce from midnight low levels (potential support)
- Range-bound trading between the high and low levels
Combine with liquidity concepts:
- Monitor for stop hunts above/below these levels
- Look for false breakouts that snap back into the range
- Use as confluence with other ICT concepts like FVGs and Order Blocks
Strategic Applications:
- Range trading between midnight levels
- Breakout confirmation when price closes decisively outside the range
- Support/resistance validation for entry and exit planning
🔗 Combine With These Tools for Complete Market Structure Analysis:
✅ First FVG — Opening Range Fair Value Gap Detector.
✅ ICT Turtle Soup (Liquidity Reversal)— Spot stop hunts and false breakout scenarios
✅ ICT Macro Zones (Grey Box Version)- It tracks real-time highs and lows for each Silver Bullet session
✅ ICT SMC Liquidity Grabs and OBs- Liquidity Grabs, Order Block Zones, and Fibonacci OTE Levels, allowing traders to identify institutional entry models with clean, rule-based visual signals.
Together, these tools create a comprehensive Smart Money Concepts (SMC) framework — helping traders identify, anticipate, and capitalize on institutional-level price movements with precision and confidence during critical overnight sessions.

LANZ Strategy 6.0🔷 LANZ Strategy 6.0 — One-Shot NY Candle Logic with Dynamic SL/TP, Multi-Account Lot Sizing and Visual Confirmation System
LANZ Strategy 6.0 is a high-precision, visually driven indicator that executes a single operation per day based on the 09:00 a.m. New York candle. Built for simplicity and accuracy, it calculates dynamic Stop Loss and Take Profit levels using the candle range, and adapts position sizing per account with pip-accurate risk control. All actions are visualized in real-time for full clarity.
📌 This is an indicator, not a strategy — It does not place trades automatically, but provides exact entry setups, SL/TP levels, risk-based lot size guidance, and optional alerts.
🧠 Core Logic & Features
🚀 Entry Signal (BUY Only)
A BUY setup is triggered only once per day, when:
The current candle is the 09:00–10:00 a.m. NY session candle
The candle is bullish (close > open)
This single candle is used to define the trade levels for the day, and the signal is only evaluated once. If bullish, a visual "BUY" label appears with SL/TP/EP levels calculated from the candle body or full range.
⚙️ Stop Loss and Take Profit
You can configure:
SL as a percentage of the candle’s range (from wick to wick), or use the wick extreme
RR ratio (e.g., 1:4) to dynamically calculate the TP based on SL
Each level is drawn as a line:
EP (Entry Price) at the candle’s close
SL below the low (or % of range)
TP above the entry at the selected RR
💰 Risk-Based Lot Size Calculation per Account
Manage up to 5 independent accounts simultaneously. Each account can have:
Its own capital
Its own risk percentage per trade
Lot size is calculated automatically for each based on:
Defined SL in pips
The pip value (auto-detected for Forex or manually defined for indices/gold)
📋 All lot sizes are displayed in a dedicated info panel, with their corresponding risk-adjusted values per account.
🖼️ Trade Visualization Panel
When a trade is active, a clean table is displayed in the top-right corner showing:
TP / SL / EP levels
Distance in pips for SL and TP
Lot size per account
Line visuals (style, color, thickness) are fully customizable.
🧪 Outcome Tracking (Real-Time Labels)
For each trade:
If SL is hit → a label shows “–1.00%” at the SL level
If TP is hit → a label shows “+X.XX%” at the TP level
If still open at 3:00 p.m. NY, the trade closes manually and the actual result (in %) is calculated and labeled on chart
🔔 Alerts You Can Trust
You'll get an alert when:
A BUY entry is confirmed
SL or TP is hit
Manual close is triggered at 15:00 NY
All alerts include the symbol, price, and result for immediate action or tracking.
🧭 Execution Flow Summary
Every day:
At 09:00 a.m. NY → Evaluate candle
If bullish:
Set EP, SL, TP
Calculate lot sizes
Plot lines + labels
Display dashboard panel
Monitor SL/TP hits
At 15:00 NY → Force close if needed
💡 Ideal For:
Traders who want a clean, single-shot entry system per day
Index or gold traders who operate with strict SL/TP logic
Anyone managing multiple accounts or fixed-capital models
Visual learners and disciplined execution fans
👨💻 Credits:
💡 Developed by: LANZ
🧠 Execution Model & Logic Design: LANZ
📅 Designed for: 1H timeframe, high-conviction NY-based entries
📈 Purpose: Clean decision-making, precision risk control, visual certainty

Panel Pro+ Quantum SmartPromptPanel Pro+ Check 2.0
*It's a panel with integrated artificial intelligence in offline mode.
*It provides live chart prompts.
*It recognizes market types, such as bullish, bearish, box, sideways, volatile, etc.
*It performs a comprehensive evaluation and takes buy or sell actions, with the corresponding profit-taking.

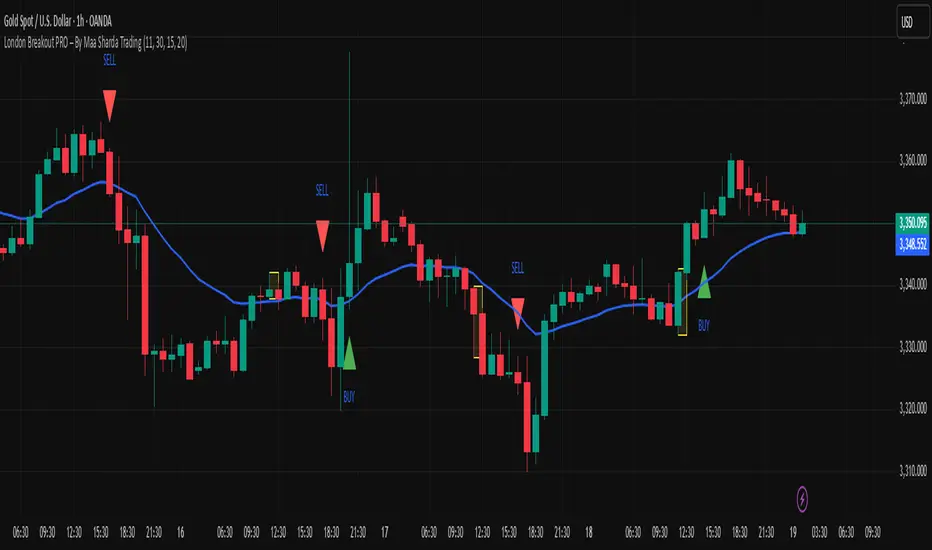
London Breakout PRO – By Maa Sharda Trading📈 London Breakout PRO (MAA SHARDA TRADING) – Indicator Description for TradingView
Introducing: London Breakout PRO – The Advanced Breakout Tool for Gold & Forex!
Unlock the real power of London session trading with this next-generation indicator.
Specially designed for serious traders, this tool combines classic London Breakout logic with EMA Trend Confirmation and an optional Volume Filter to eliminate fake breakouts and boost your accuracy.
How It Works:
Session Box: Automatically marks the first session candle (default: 1H for London Open).
Breakout Signal: Gives only one clean BUY/SELL signal each day – only when the candle breaks out above/below the session box.
Trend Filter: Signals fire only when price is above (BUY) or below (SELL) the EMA 20, ensuring you always trade with the trend.
Volume Confirmation: (Optional) Signals only if breakout happens with volume higher than the last 10 candles’ average, so you avoid low-liquidity fakeouts.
Ultra-Clean Chart: No repainting, no clutter, just pure breakout action.
Key Features:
✅ Works on any timeframe (M15, M30, H1 best for Gold/XAUUSD & FX)
✅ Fully customizable session start time and box duration
✅ One breakout signal per day – no overtrading, no noise
✅ Trend & volume filters for high-probability setups
✅ Easy visual backtesting – perfect for serious traders and strategy builders
Recommended Settings for GOLD (XAUUSD):
Timeframe: 1 Hour (H1) – best accuracy & lowest noise
Session Start (IST): 11:30 AM (London Open)
Box Length: 1 Candle (1 Hour)
EMA Length: 20
Volume Filter: On (for strong confirmations)
How To Use:
Wait for London session box to form at your set time.
Trade only when price closes above (BUY) or below (SELL) the box and EMA 20 & volume filters are satisfied.
Place SL at the opposite side of the box. Target 1:1 or let profits run with trailing stop.
Avoid trading during high-impact news events for even better results.
Pro Tip:
Backtest on H1 and combine with major support/resistance for the highest win-rate. Use with proper risk management for best results!
Disclaimer:
Trading involves risk. This indicator is for educational purposes only. Test thoroughly before live trading.
#LondonBreakout #XAUUSD #BreakoutStrategy #EMAConfirmation #VolumeFilter #TradingView #ForexIndicator #IntradayTrading
📊 Bot-Activated Signal OverlayWest Coast SPECS is an automated signal intelligence bot designed to capitalize on macro themes—especially weak-dollar rotations across sectors like commodities, energy, gold, and emerging markets.
🔍 What It Does
Scans small-cap tickers (<$2B market cap) for high-probability entries
Detects RSI and Stochastic divergence with volume confirmation
Integrates options flow intel (Volume ≥ 2× Open Interest)
Filters signals by trend alignment using 10, 50, and 200-day MAs
Exports signals for TradingView overlays, Google Sheets, and Discord alerts
⚙️ Signal Engine
Custom Python logic pulls real-time price and options data and runs multi-layered filters:
Liquidity checks via volume spikes
Momentum alignment (MA crossovers, price zones)
Bullish or Bearish classification with sector tags
📡 Bot Deployment
🔗 Webhook-ready Flask server
🤖 Discord bot (!scan command) posts daily signals into your channel
📤 Pine Script overlay visualizes confirmed setups in TradingView
📈 Optional Streamlit dashboard tracks DXY, sector ETFs, and macro rotation
🎯 Strategy Focus
West Coast SPECS thrives on:
Dollar downtrends
Commodity surges
Rotation into under-the-radar small caps with momentum
This isn't just a bot—it's your tactical macro wingman with surgical market entry logic. Built for traders who want precision, context, and speed.
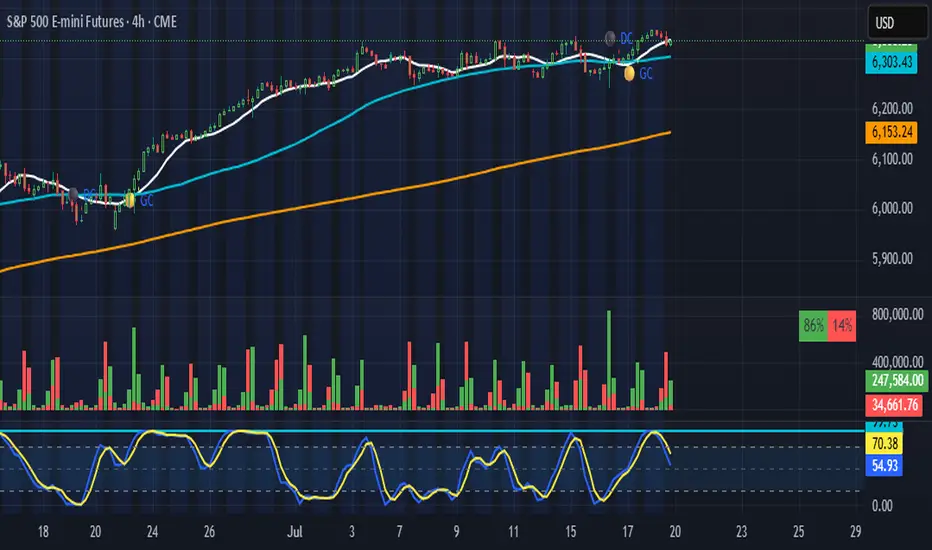
Dex Stoch RSI + WaveTrend Dots [Enhanced]This indicator is to help identify points where the RSI changes and the wave changes. Dots are to indicate the start of a bearish momentum or bullish momentum.
green dots - provide bullish momentum from an oversold state
yellow dots - provide bullish momentum from an even greater oversold state
red dots - provide bearish momentum from an overbought state
purple dots - provide bearish momentum from an even greater oversold state
This is to hopefully help identify on the charts when bullish or bearish momentum is being alerted

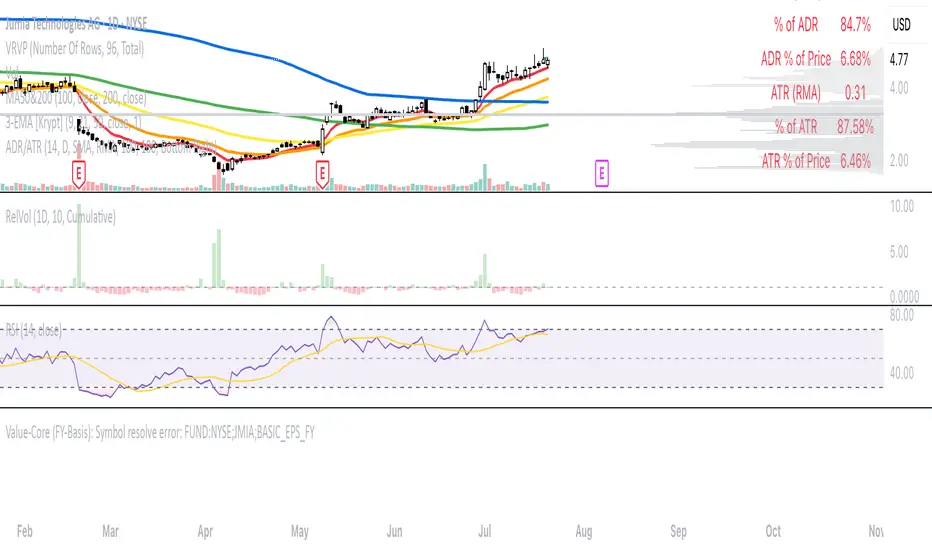
Earnings [theUltimator5]This indicator highlights daily price changes on earnings announcement days using dynamic colors, labels, and optional earnings markers.
🔍 Key Features:
Earnings Detection:
Highlights only the days when an earnings event occurs.
Price Change Calculation:
Computes the percentage change from open to close on earnings day.
Color-coded Labels:
Displays the % change as a floating label above the chart on earnings days.
Color intensity reflects the size and direction of the move:
Bright green for large gains (≥ +10%)
Bright red for large losses (≤ -10%)
White for negligible change
Gradient fades between those extremes
Optional "Earnings" Marker:
A small label marked “Earnings” appears beneath the % change label, controlled by a user toggle.
Background Highlight:
The chart background is shaded on earnings days with a semi-transparent color based on the % change.
⚙️ User Input:
✅ Show 'E' Marker: Toggles the visibility of the "Earnings" label below the main price change label.
✅ Ideal Use Case:
Use this indicator to visually analyze how a stock reacts on earnings days, helping traders spot consistent behavior patterns (e.g., post-earnings rallies or selloffs).
