Greer EPS Yield📘 Script Title
Greer EPS Yield – Valuation Insight Based on Earnings Productivity
🧾 Description
Greer EPS Yield is a valuation-focused indicator from the Greer Financial Toolkit, designed to evaluate how efficiently a company generates earnings relative to its current stock price. This script calculates the Earnings Per Share Yield (EPS%), using the formula:
EPS Yield (%) = Earnings Per Share ÷ Stock Price × 100
This yield metric provides a quick snapshot of valuation through the lens of profitability per share. It dynamically highlights when the EPS yield is:
🟢 Above its historical average (potentially undervalued)
🔴 Below its historical average (potentially overvalued)
🔍 Use Case
Quickly assess valuation attractiveness based on earnings yield.
Identify potential buy opportunities when EPS% is above its long-term average.
Combine with other indicators in the Greer Financial Toolkit for a fundamentals-driven investment strategy:
📘 Greer Value – Tracks year-over-year growth consistency across six key metrics
📊 Greer Value Yields Dashboard – Visualizes valuation-based yield metrics
🟢 Greer BuyZone – Highlights long-term technical buy zones
🛠️ Inputs & Data
Uses fiscal year EPS data from TradingView’s built-in financial database.
Tracks a static average EPS Yield to compare current valuation to historical norms.
Clean, intuitive visual with automatic color coding.
⚠️ Disclaimer
This tool is for educational and informational purposes only and should not be considered financial advice. Always conduct your own research before making investment decisions.
Greerbuyzone

Greer Value📈 Greer Value
This indicator evaluates the year-over-year (YoY) growth consistency of five key fundamental metrics for any stock:
Book Value Per Share
Free Cash Flow
Operating Margin
Total Revenue
Net Income
The script tracks whether each metric increases annually based on financial statement data (FY), then calculates both individual and aggregate increase percentages over time. A color-coded table is displayed on the most recent bar showing:
Raw counts of increases vs. checks per metric
Percentage of years with growth
Overall "Greer Value" score indicating total consistency across all five metrics
✅ Green = Strong YoY growth
❌ Red = Weak or inconsistent growth
Use this tool to help identify fundamentally improving companies with long-term value creation potential.

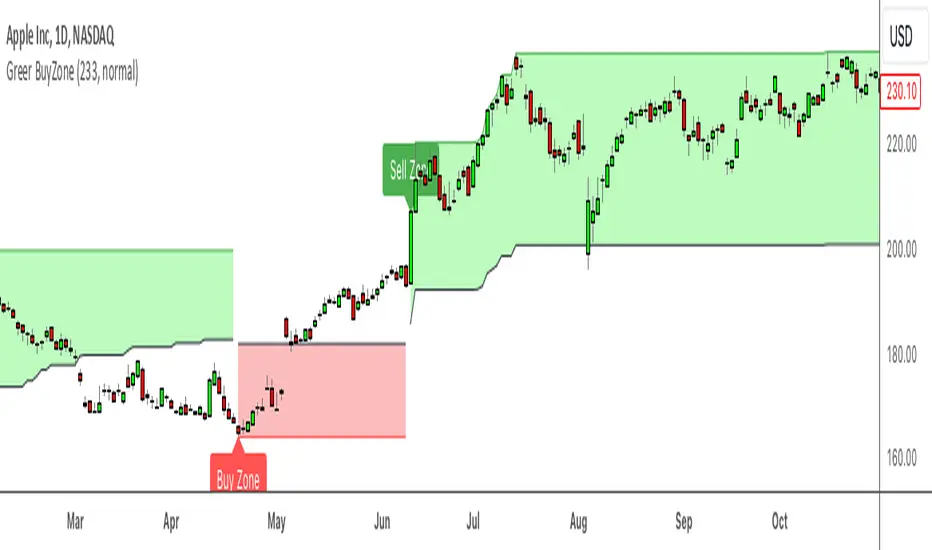
Greer BuyZone toolGreer BuyZone Tool
Description:
The Greer BuyZone Tool is a custom Pine Script indicator designed to help identify potential long-term investment opportunities by marking BuyZones on the chart. This tool utilizes the Aroon indicator in combination with Fibonacci numbers to define periods where the asset might be a good candidate for dollar-cost averaging.
Features:
BuyZone Detection: The script identifies and marks the beginning and end of a BuyZone with vertical lines and labels.
Visual Markers: A red vertical line and label indicate the start of a BuyZone, while a green vertical line and label mark the end of a BuyZone.
Aroon Indicator Calculation: Utilizes the Aroon indicator with a Fibonacci length (233) to determine key price levels.
How to Use:
Setup: Add the Greer BuyZone Tool to your TradingView chart. It will display vertical lines and labels marking the BuyZone periods.
BuyZone Identification: Use the red lines and labels ("BZ Begins ->>") to identify the start of a BuyZone, and the green lines and labels ("<<- BZ Ends") to determine when the BuyZone ends.
Long-Term Investment: This tool is intended for long-term investing and dollar-cost averaging strategies, not for day trading.
Disclaimer:
This script is provided for informational purposes only and is not intended as financial advice. The Greer BuyZone Tool is designed to assist in identifying potential long-term investment opportunities and is not suitable for day trading. The use of this tool involves risk, and there is no guarantee of profitability. Users are advised to conduct their own research and consult with a qualified financial advisor before making any investment decisions. The creator of this script assumes no liability for any losses or damages resulting from the use of this indicator.
Author: Sean Lee Greer
Date: 9/1/2024