Stophunt WickAcknowledgement
This indicator is dedicated to my friend Alexandru who saved me from one of these liquidation raids which almost liquidated me.
Alexandru is one of the best scalpers out there and he always nails his entries at the tip of these wicks.
This inspired me to create this indicator.
What's a Liquidation Wick?
It's that fast stop-hunting wick that stophunts everyone by triggering their stop-loss and liquidation.
Liquidity is the lifeblood of stock market and liquidation is the process that moves price.
This indicator will identify when a liquidity pool is getting raided to trigger buy or sell stops, they are also know as stop-hunts.
How does it work?
When market consolidates in one direction, it builds up liquidity zones.
Market maker will break out of these consolidation phases by having dramatic price action to either pump or dump to raid these liquidity zones.
This is also called stop-hunts or liquidity raids. After that it will start reversing back to the opposite direction.
This is most noticeable by the length of the wick of a given candle in a very short amount of time and the total size of the candle.
This indicator highlights them accordingly.
Settings
Wick and Candle ratio works with default values but finetune will enhance user experience and usability.
Wick Ratio: Size of the wick compared to body of a candle.
Adjust this to higher ratio on smaller timeframe or smaller ratio on bigger timeframe to your trading style to spot a trend reversal.
Candle Ratio: The size of the candle, by default it is 0.75% of the current price.
For example, if BTC is at 20,000 then the size of the candle has to be minimum 150.
This can be fine tuned to bigger candle size on higher time frames or smaller for shorter timeframe depending on the trade type.
How to use it?
This indicator will identify when a liquidity pool is getting raided to trigger buy or sell stops, they are also know as stop-hunts. It can be used of its own for scalping but there are also a good few indicators which would most definitely help to confluence bigger timeframe trades.
Scalp
This indicator shows the most chaotic moments in price action; therefore it works best on smaller timeframes, ideally 3 or 5 minute candle.
- Wait for the market to start pumping or dumping.
- Current candle will change colour (Bullish/Bearish).
- Enter trade as soon as price starts to reverse back.
- Place the stop-loss outside of the current candle.
- Wait for the Liquidation Wick to appear as confirmation.
Price is very chaotic during a liquidity stop-hunt raid but there is a saying:
"In the midst of chaos, there is also opportunity" - Sun-Tzu
Since this is a very high risk, high reward strategy; it is advised to practice on paper trade first.
Practice until perfection and this indicator would be the perfect bread and butter scalp confirmation.
Fair Value Gap
FVG strategy is the most accurate in conjunction with this indicator.
Normally price would reverse after consuming fair value gaps but often it's difficult to know when and where.
This indicator would identify those crucial entry points for reverse course direction of the price action.
Support and Resistance
This indicator can also be used in conjunction with support and resistance lines.
Generally the stophunt will go deep below the support or spike much further up the resistance lines to liquidate positions.
Bollinger Bands
Bolling Bands strategy would be to wait until the price breaks out of the band.
Once the wick is formed, it would be an ideal entry point.
Script change
This is an open-source script and feel free to modify according to your need and to amplify your existing strategy.
Liquidation

Leverage Liquidation Circles/dots/alertsThis plots liquidation alerts for different levels of leverage. The script calculates the liquidation prices for both long and short positions based on the inputted leverage values. Then, it plots dots on the chart where liquidation can occur for each level of leverage. Additionally, it plots circles on the chart only when a liquidation event occurs, at which point the circle changes color to indicate the level of leverage that triggered the liquidation.
The script allows traders to visualize potential liquidation events for different levels of leverage, which can be helpful in managing risk when trading on margin. The different colors of the circles can quickly communicate which level of leverage triggered the liquidation, allowing traders to quickly assess the situation and adjust their positions if necessary.
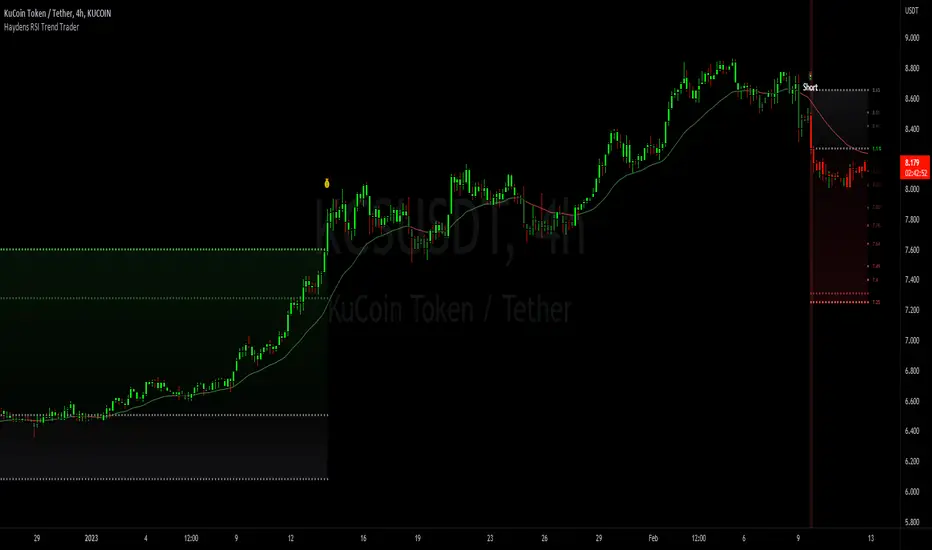
Haydens RSI Trend TraderThis is a simple trend trading companion indicator for Hayden's Advanced RSI, which can be found here:
For best results, please be sure your oscillator and chart companion settings match. Detailed trade information & statistics can be found when hovering over any of the indicator labels. The backtesting results are not calculated the same as TradingView, and the original code can be found here
Shoutout to the following authors for the code snippets that were used in making this indicator: @lazybear @kiosefftrading @Koalafied_3 @mabonyi @Capissimo
LiquidationsFirst, thanks to the following Tradingview community members for providing open source indicators that I used to develop this indicator!
Liquidations by volume (spot/futures) - @Thomas_Davison
Pivot and liquidation lines - @lmatl
Let me know if either of you do not approve and I will remove the indicator.
This indicator uses pivot points, volume and a liquidation percentage to determine potential liquidation levels. These are not exact but can give traders an idea of potential support or resistance levels.
Pivot points: Currently the pivot points are set to look left 5 bars and right 2 bars. This will determine the high and lows in the chart.
Volume: Assuming that high volume bars are where more leverage is used, this indicator uses the average volume over a 1000 bar period to determine to determine a baseline. I have arbitrarily set 100x lines to 20% above the average volume, 50x lines 10% above, 25x lines 5% above, 10x lines 2.5% above and 5x lines 1.25% above.
Liquidation: Finally, we are making a few assumptions on how liquidations are calculated. The following table includes the percentage a position can decline before being liquidated.
Short: Long:
100x 0.51% 0.49%
50x 1.55% 1.47%
25x 3.70% 3.38%
10x 5.11% 4.67%
5x 6.705% 6.115%
Let me know if there are any questions or if anyone has any improvements!

Aggregated Volume Spot & Futures ⚉ OVERVIEW ⚉
The indicator presents a comprehensive approach to Aggregated Volume Data . Works on almost all CRYPTO Tickers!
The script also includes several input parameters that allow the user to control which exchanges and currencies are included in the aggregated data.
This script allows the user to choose from several data display modes, including volume, spot & perp, delta, cumulative delta, and others.
The user can also choose how volume is displayed (in assets, U.S. dollars or euros) and how it is calculated (sum, average, median, or dispersion).
WARNING Indicator is for CRYPTO ONLY.
______________________
⚉ SETTINGS ⚉
‾‾‾‾‾‾‾‾‾‾‾‾‾‾‾‾‾‾‾‾‾‾
Mode — Choose Mode.
• Volume — This displays the Volume
• Volume (Colored) — Shows aggregated volume but applying different volume colors for different exchanges.
• Delta — This displays the difference between the number of sellers and buyers.
• Cumulative Delta — This displays the cumulative delta between sellers and buyers.
• Spot & Perp — Shows Spot and Futures volume at the same time.
• Delta (Spot - Perp) — Shows the difference between Spot and Futures Volume.
• Liquidations — Displays Potential Liquidations. (Calculated between the difference in volume between Futures and Spots)
• OBV — On Balance Volume.
• MFI — Money Flow Indicator.
• Data Type — Choose Single or Aggregated data.
• Single — Show only current Volume.
• Aggregated — Show Aggregated Volume.
Volume By — You can also select how the volume is displayed.
• COIN — Volume in Actives.
• USD — Volume in United Stated Dollar.
• EUR — Volume in European Union.
• RUB — Volume in Russian Ruble.
Calculate By — Choose how Aggregated Volume it is calculated.
• SUM — This displays the total volume from all sources.
• AVG — This displays the average price of the volume from all sources.
• MEDIAN — This displays the median volume from all sources.
• VARIANCE — This displays the variance of the volume from all sources.
* 🡅 Be Careful, Reacts to Every Mode.
Additional features
• Show MA — Show Movieng Average of Volume.
• MA Period — Period of MA.
• Lookback — Lookback period for 'Cumulative Delta' and for 'MFI'.
• Liquidation Filter — Filters out small or negative difference values.
• Show Table — Table shows the current volume of the last candle. Also in the Mode "Colored" shows the color of exchanges if they have volume.
________________
⚉ NOTES ⚉
‾‾‾‾‾‾‾‾‾‾‾‾‾‾‾‾
I don't pretend to be the best choice for calculating CVD , Delta and Liquidations, the calculations are chosen to be optimal from what I have seen and know.
If you have any ideas what to add to my work to add more sources or make calculations cooler, suggest in DM .

Liquidations by volume (TG fork)Shows actual liquidations on a per-candle basis by using the difference in volume between spot and futures markets.
i.e. volume on a futures market will be much higher if there are many liquidations.
By default, green represents short liquidations (hence a bullish move, hence why it's green), whereas red is for long liquidations (bearish move). The colors can be changed in the settings if you prefer an inverted theme.
Long liquidation data should in theory be more accurate than short liquidation data due to the inability to short on a spot market.
This indicator should be able to help identify trends by determining liquidation points in the chart.
Extended by Tartigradia to automatically detect the symbol (only for crypto assets found on Binance with a USDTPERP pair, so it works for ETH, BNB, etc) and add multi-timeframe support (MTF).
If you like the indicator, please show the original author Thomas_Davison some love:

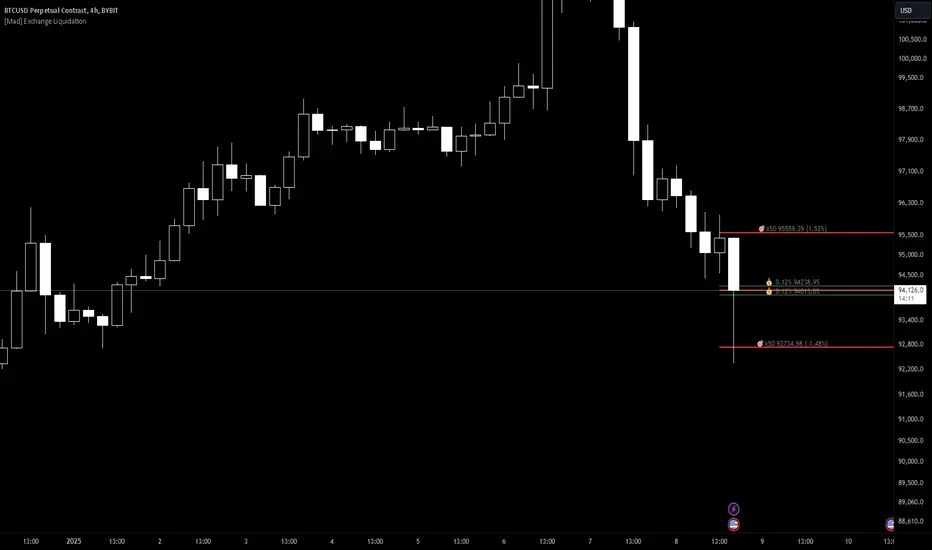
[Mad] Exchange liquidationThis is just a basic tool to calculate liquidation based on:
margin-maintenance
leverage
it starts drawing on your input point short and long liquidation, so you can easily place it on your trade and drag it around if you are rebuying as an example.
Also, you can use it to aim for a specific support/resistance to see if it is even possible to reach some levels, which leverage you can use...
It additionally delivers live data based on the actual close to the 2 liquidation points
have fun
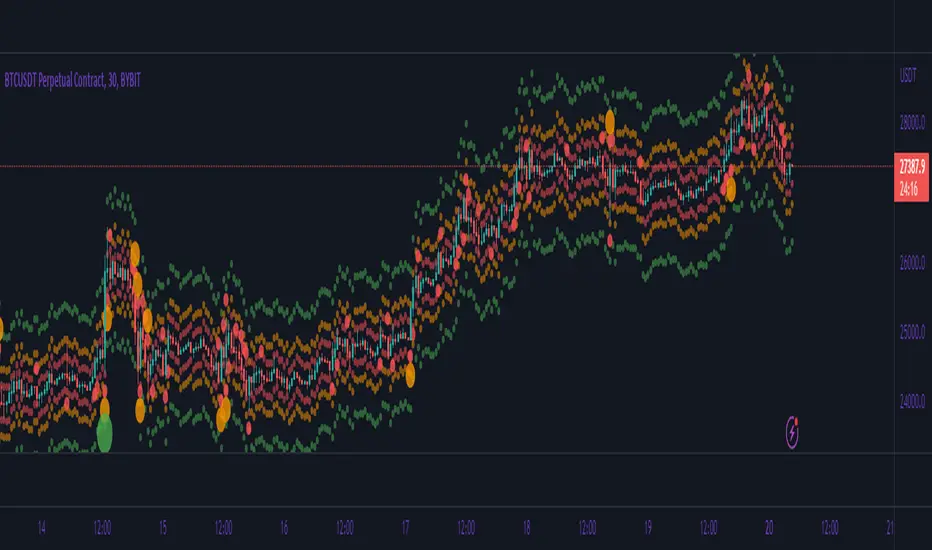
TriexDev - Liquidation Rekt LevelsTriexDev - Liquidation Rekt Levels TradingView Indicator
A basic indicator which lets you see where positions will be liquidated. Each line is based on default leverage levels typically used for trading. (3x,5x,10x,25x,50x)
Have a subtle 'label prompt' on the 3x - because I had noticed some people didn't understand what labels were in other indicators.
In the settings:
- There is an offset to adjust the levels horizontally, this is to help make it easier to track if the chart has hit liquidation positions.
- You can change colours/opacity of the lines.
- You can hide the 'Labels', and/or 'label prompt'
- In the 'Style' tab you can hide individual levels.
Inspired/initially based off 'Mex Rekt Level'
I often have this added to my charts, and toggle visibility when I want to check the liq levels.
GitHub Repo for tidier/more detailed documentation as it is updated.

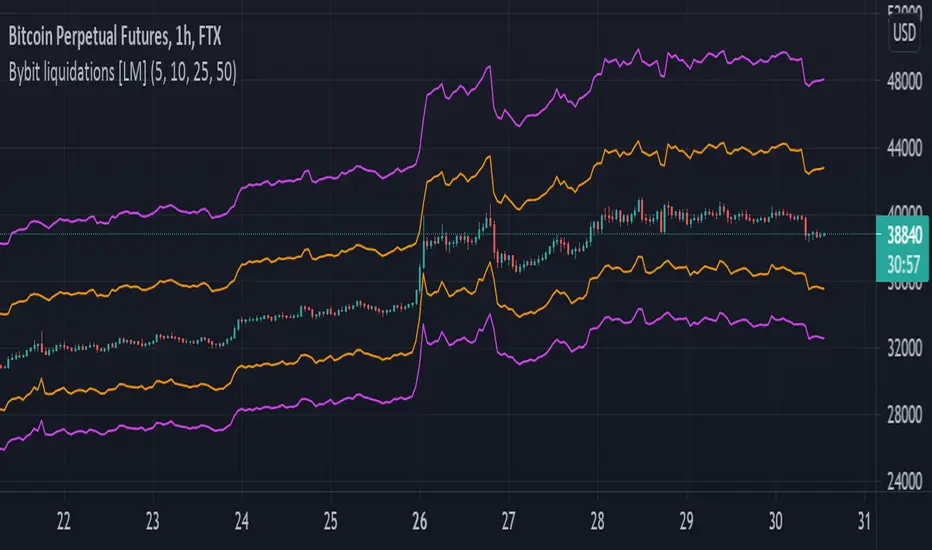
Bybit liquidations [LM]Hello traders,
I would like to introduce you script for calculating liquidations on Bybit(it's applicable not only for Bybit). The idea is to render lines and look for confluence with other indicators where is most likely that people will get liquidated.
It has setting with 4 leverages that will render line below and above price always calculated from high and low of the candles.
Hope you will enjoy it.
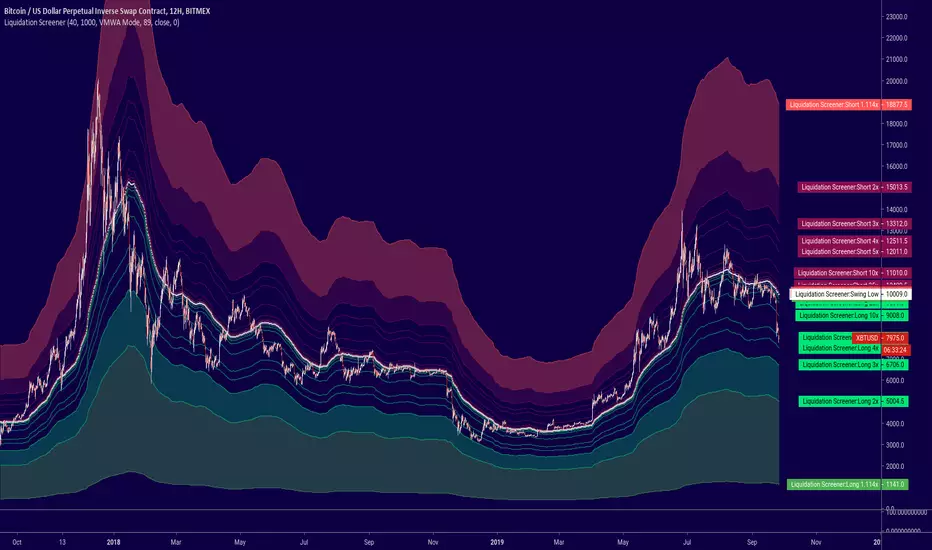
Liquidation ScreenerOption to screen for,
1. Volume Weighted Moving Average (better representation of majority)
2. Liquidation from Top Entered Positions (Long & Shorts)
3. Liquidations from Bottom Entered Positions (Longs & Shorts)
4. Liquidations from Top Shorts and Bottom Longs
5. Liquidations from Top Longs and Bottom Shorts
You can change candle lookback for 2-5 since these use a highest/lowest value for defined period. For the VWMA you can change the source and the MA length.
Optionally input for custom price to specifically look for liquidation levels.
Happy trading/ stay sharp,
-TheTrex
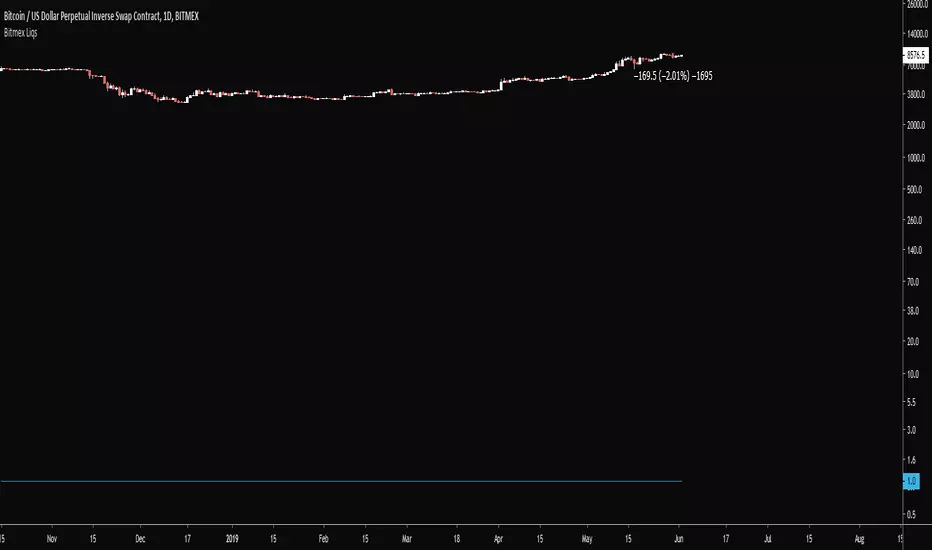
Basic Bitmex Liquidation (Open Source)Been trying to reverse engineer this specific script () cause reasons for weeks now. Enjoy, fam
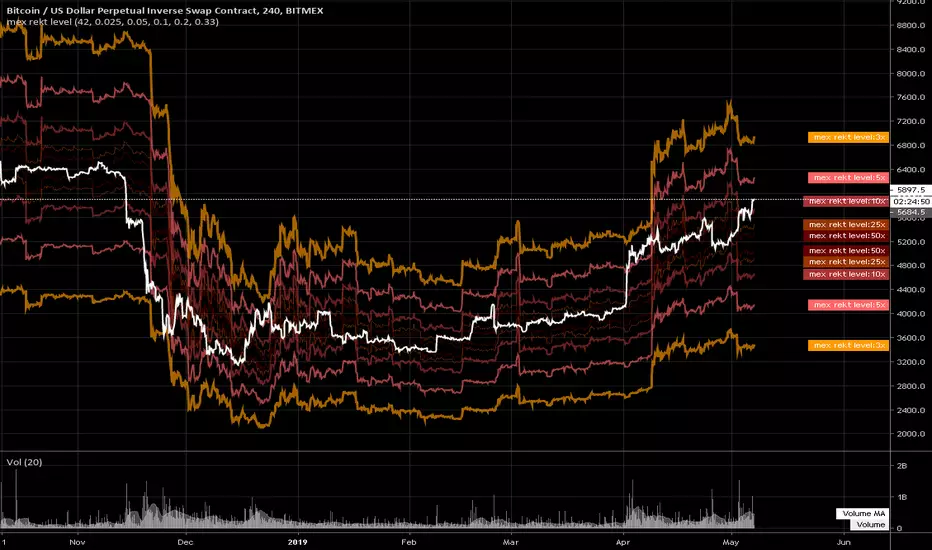
mex rekt levelsimple tool to calculate where the positions are liquidated. each color is a level of default leverage used on mex, eg. 10x,25x, and so on.
there is an offset input to adjust the levels horizontally, to make it easier to see in time where the positions got liquidated
Multi Timeframe Rolling Bitmex Liquidation LevelsTrack Bitmex liquidations levels in real-time with a rolling VWMA or VWAP basis.
Allows the input of a different time frame if you wish.

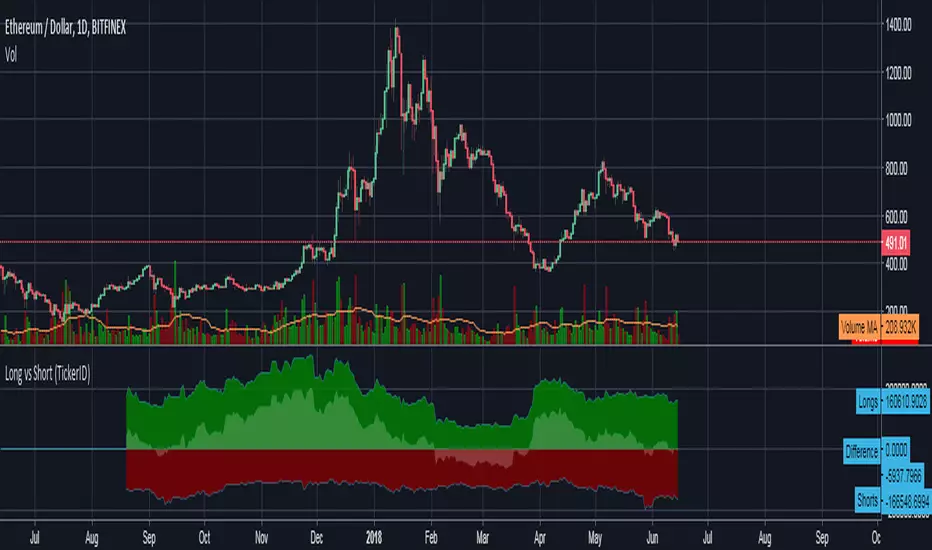
Bitfinex Long vs Short (TickerID)Uses the active ticker to show long/short values on all Bitfinex pairs that have that data available on Tradingview.