Smarter Money Concepts - MTF IFVGs [PhenLabs]📊 Smarter Money Concepts - MTF IFVG
Version: PineScript™ v6
📌 Description
This multi-timeframe indicator identifies Inverse Fair Value Gaps (IFVGs) and their inversions across simultaneous chart intervals, helping traders spot liquidity voids and potential reversal zones. By analyzing price action through the lens of institutional order flow patterns, it solves the problem of manual gap tracking across timeframes while incorporating volatility-adjusted parameters and psychological level analysis for higher-probability setups.
🚀 Points of Innovation
• Multi-Timeframe Engine - Simultaneous analysis of 3 higher timeframes
• Adaptive Parameters - Auto-adjusts to market volatility conditions
• Quality Scoring System - Ranks gaps using RVI strength and size metrics
• Inversion Tracking - Monitors failed gaps for counter-trend signals
• Render Optimization - Prevents chart clutter with smart gap management
🔧 Core Components
FVG Detection Logic: Identifies gaps using customizable price source (Close/Wick)
Inversion Tracker: Manages failed gaps and generates counter signals
Multi-Timeframe Engine: Processes 3 independent higher timeframe analyses
Dashboard System: Real-time display of active gaps across all timeframes
🔥 Key Features
• Volatility-adjusted gap size filters (ATR-based)
• Customizable timeframe confluence analysis
• Color-coded quality scoring
• Non-repainting inversion signals
• Mobile-optimized visual rendering
🎨 Visualization
• Colored Boxes: Translucent zones show active gaps (green/bullish, red/bearish)
• Midline Plot: Dashed gray line marks gap midpoint for price targets
• Inversion Markers: Intense colors show failed gaps (dark red/bullish failure, bright green/bearish failure)
• HTF Differentiation: Higher timeframe gaps shown in blue/teal hues
📖 Usage Guidelines
Multi-Timeframe Settings
• Higher Timeframe 1
Default: 30 | Range: Any > Chart TF | Controls primary confluence timeframe
• Show All Timeframes
Default: True | Toggles multi-TF gap displays
Gap Settings
• Source
Default: Close | Options: | Determines gap measurement method
• RVI Period
Default: 14 | Range: 1-50 | Sets momentum confirmation sensitivity
• RVI Value
Default 0.1 | 0 to see all IFVGs | Increase min RVI to see the most powerful IFVGs
✅ Best Use Cases
• Identifying confluence across timeframes
• Spotting institutional order blocks
• High-probability reversal trading
• Trend continuation confirmation
• Volatility breakout setups
⚠️ Limitations
• Repaints historical gap zones
• Requires understanding of FVG concepts
• Higher timeframe data latency
• Quality scores rely on RVI/ATR settings
💡 What Makes This Unique
First FVG indicator with true multi-timeframe processing
Adaptive parameters that auto-adjust to volatility
Quantifiable quality scoring system
Professional-grade dashboard with HTF tracking
🔬 How It Works
Gap Detection: Identifies FVGs using price relationships and RVI confirmation
Inversion Tracking: Monitors price breaches to flag failed gaps
Quality Assessment: Scores gaps based on size, momentum, and location
Adaptive Filtering: Adjusts parameters using ATR-based volatility analysis
Multi-TF Synthesis: Correlates gaps across user-selected timeframes
Visual Rendering: Displays only relevant, active gaps to prevent clutter
💡 Note:
Start with default settings and gradually adjust parameters after observing market interactions. Focus on gaps with quality scores above 7 that align with higher timeframe trends. Combine with price action at psychological levels for highest-probability setups. Remember that higher timeframe gaps generally carry more significance than current chart gaps.
Liquidity

My-Indicator - Global Liquidity & Money Supply M2 + Time OffsetThis script is designed to visualize a global liquidity and money supply index by combining data from various regions and, optionally, central bank activity. Visualizing this data on a chart allows you to see how central banks are intervening in the financial system and how the total amount of money in the economy is changing. Let’s take a look at how it works:
Central Bank Liquidity
Shows the actions of central banks (e.g. FED, ECB) providing short-term cash to commercial banks. If you see spikes or a steady increase in these indicators, it may suggest that liquidity is being increased through intervention, which often stimulates the market.
Money Supply
M2 money supply is a monetary aggregate that includes M1 (cash and current deposits) plus savings deposits, small term deposits, and other financial instruments that, while not as liquid as M1, can be quickly converted into cash. As a result, M2 provides a broader picture of the available money in the economy, which is useful for analyzing market conditions and potential economic trends.
How does it help investors?
It allows you to quickly see when central banks are injecting additional liquidity, which could signal higher prices.
It allows you to see trends in the money supply, which informs potential changes in inflation and the economic cycle.
Combining both sets of data provides a more complete picture – both in the short and long term – which makes it easier to predict upcoming price movements.
This allows investors to better respond to changes in central bank policy and broader monetary trends, increasing their chances of making better investment decisions.
Data Collection
The script retrieves money supply data for key markets such as the USA (USM2), Europe (EUM2), China (CNM2), and Japan (JPM2). It also offers additional money supply series for other markets—like Canada (CAM2), Great Britain (GBM2), Russia (RUM2), Brazil (BRM2), Mexico (MXM2), and New Zealand (NZM2)—with extra options (e.g., Australia, India, Korea, Indonesia, Malaysia, Sweden) disabled by default. Moreover, you can enable data for central bank liquidity (such as FED, RRP, TGA, ECB, PBC, BOJ, and other central banks), which are also disabled by default.
Index Calculation
The indicator calculates the index by adding together all the enabled money supply series (and the central bank data if activated) and then scales the sum by dividing it by 1,000,000,000,000 (one trillion). This scaling makes the resulting values more manageable and easier to read on the chart.
Time Offset Feature
A key feature of the script is the time offset. With the input parameter "Time Offset (days)", the user can shift the plotted index line by a specific number of days. The script converts the given offset in days into a number of bars based on the current chart's timeframe. This allows you to adjust for the delay between liquidity changes and their effect on asset prices.
Overall, the indicator plots a line on your chart representing the global liquidity and money supply index, allowing you to visually monitor trends and better understand how liquidity and central bank actions may influence market movements.
What makes this script different from others?
Every supported market—both major regions (USA, Eurozone, China, Japan, etc.) and additional ones—is available. You can toggle each series on or off, so you can view only Money Supply data, only Central Bank Liquidity, or any custom combination.
Separated Data Groups. Inputs are organized into clear groups (“Money Supply”, “Other Money Supply”, “Central Bank Liquidity”), making it easy to focus on just the data you need without clutter.
True Day‑Based Offset. This script converts your chosen “Time Offset (days)” into actual days regardless of timeframe. Whether you’re on a 5‑minute or daily chart, the index is always shifted by exactly the number of days you specify.

Liquidity Trap Reversal Pro (Radar v2)Liquidity Trap Reversal Pro (Radar v2) is a non-repainting indicator designed to detect hidden liquidity traps at key swing highs and lows. It combines wick analysis, volume spike detection, and optional trend and exhaustion filters to identify high-probability reversal setups.
🔷 Features:
Non-Repainting: Pivots confirmed after lookback period, no future leaking.
Volume Spike Detection: Filters traps that occur during major liquidity events.
EMA Trend Filter (Optional): Focus on traps aligned with the prevailing trend.
Higher Timeframe Trend Filter (Optional): Confirm traps using a higher timeframe EMA bias.
Exhaustion Guard (Optional): Prevents traps after overextended moves based on ATR stretch.
Clean Visuals: Distinct plots for raw trap points vs confirmed traps.
Alerts Included: Set alerts for confirmed high/low liquidity traps.
📚 How to Use:
Watch for Trap Signals:
A Trap High signal suggests a potential bearish reversal.
A Trap Low signal suggests a potential bullish reversal.
Use Confirmed Signals for Best Entries:
Confirmed traps fire only after price moves opposite to the trap direction, adding reliability.
Use Trend Filters to Improve Accuracy:
In an uptrend (price above EMA), prefer Trap Lows (buy setups).
In a downtrend (price below EMA), prefer Trap Highs (sell setups).
Use the Exhaustion Guard to Avoid Bad Trades:
This filter blocks signals when price has moved too far from trend, helping avoid late entries.
Recommended Settings:
Best used on 15-minute, 1-hour, or 4-hour charts.
Trend filter ON for trending markets.
Exhaustion guard ON for volatile or stretched markets.
📈 Important Notes:
This script does not repaint once a pivot is confirmed.
Alerts trigger only on confirmed trap signals.
Always combine signals with sound risk management and trading strategy.
Disclaimer:
This script is for educational purposes only. It is not investment advice or a guarantee of results. Always do your own research before trading.

M2 Liqudity WaveGlobal Liquidity Wave Indicator (M2-Based)
The Global Liquidity Wave Indicator is designed to track and visualize the impact of global M2 liquidity on risk assets—especially those highly correlated to monetary expansion, like Bitcoin, MSTR, and other macro-sensitive equities.
Key features include:
Leading Signal: Historically leads Bitcoin price action by approximately 70 days, offering traders and analysts a forward-looking edge.
Wave-Based Projection: Visualizes a "probability cloud"—a smoothed band representing the most likely trajectory for Bitcoin based on changes in global liquidity.
Min/Max Offset Controls: Adjustable offsets let you define the range of lookahead windows to shape the wave and better capture liquidity-driven inflection points.
Explicit Offset Visualization: Option to manually specify an exact offset to fine-tune the overlay, ideal for testing hypotheses or aligning with macro narratives.
Macro Alignment: Particularly effective for assets with high sensitivity to global monetary policy and liquidity cycles.
This tool is not just a chart overlay—it's a lens into the liquidity engine behind the market, helping anticipate directional bias in advance of price moves.
How to use?
- Enable the indicator for BTCUSD.
- Set Offset Range Start and End to 70 and 115 days
- Set Specific Offset to 78 days (this can change so you'll need to play around)
FAQ
Why a global liquidity wave?
The global liquidity wave accounts for variability in how much global liquidity affects an underlying asset. Think of the Global Liquidity Wave as an area that tracks the most probable path of Bitcoin, MSTR, etc. based on the total global liquidity.
Why the offset?
Global liquidity takes time to make its way into assets such as #Bitcoin, Strategy, etc. and there can be many reasons for that. It's never a specific number of days of offset, which is why a global liquidity wave is helpful in tracking probable paths for highly correlated risk assets.

M2 Global Liquidity Index [Extended + Offset]M2 Global Liquidity Index
This indicator visualizes global M2 money supply, weighted in USD, based on major economic regions.
Features:
Standard Mode: Includes M2 data from the USA, China, Eurozone, Japan, and the UK.
Extended Mode: Adds Switzerland, Canada, India, Russia, Brazil, South Korea, Mexico, and South Africa.
Offset Function: Adjustable time lag (78 or 108 days) to analyze the delayed impact of liquidity on financial markets.
Use Case:
Designed to help identify global liquidity cycles and assess potential turning points in financial markets. Rising global liquidity generally supports risk assets like equities and crypto, while declining liquidity can put downward pressure on these markets.
Technical Details:
Non-USD M2 values are converted using real-time FX rates.
All values are displayed in trillions of USD (Tn).
Note:
Not all countries release M2 data in real-time or at the same frequency. Minor delays and discrepancies may occur.
Example:

Liquidity Fracture DetectorThe Liquidity Fracture Detector is an advanced tool designed to identify micro-liquidity traps and structural fakeouts on intraday charts. These occur when the market appears to break out, only to quickly reverse — often triggered by stop hunts, inefficient fills, or manipulated order flow.
The script combines volume spikes, volatility anomalies, and price structure breaks to signal "fractures" — points where the market temporarily breaks its behavior, often followed by strong reversals or trend accelerations.
Detection logic in the script:
Volume spike greater than 2x the average (adjustable)
Volatility spike: candle range is > 1.5x the average
Extreme wicks: wick is larger than the candle body (a classic trap signal)
Structure break: price breaks previous high/low but closes back within the old range
Combine these elements → a “fracture” is marked
Visual representation:
Red background = potential bull trap (fake breakout to the upside)
Green background = potential bear trap (fake breakdown to the downside)
A label appears at each fracture: “Echo” with the number of previous hits
Ideal use cases:
Intraday trading (1m, 5m, 15m)
Crypto, indices, futures, and forex
Detecting reactive zones where the market takes a false direction
Confluence with S/R zones, order blocks, or liquidity pools
Fully customizable:
Volume and range sensitivity
Heatmap intensity
Toggle labels on/off
Note:
This script is intended to support discretionary analysis. It does not provide buy or sell signals and is not an automated strategy. Combine it with your own price action or order flow setup for optimal results.

PRIME 2.0PRIME 2.0 — Precision Entry Tool
PRIME 2.0 is a smart price action-based indicator designed for intraday traders who want to catch high-probability moves during the London session. It uses a combination of market structure shifts (CHOCH – Change of Character) and session-based timing to identify potential entries.
🔍 Key Features:
Session-Based Logic: Activates after the London market opens, filtering noise from other sessions.
CHOCH Detection: Spots shifts in market structure by identifying crossover and crossunder of candle highs/lows.
Visual Entry Points: Plots real-time entry points based on structure change.
🧠 Who Is It For?
Scalpers and day traders
Traders who follow Smart Money Concepts (SMC)
Anyone looking to improve entry precision without clutter
⚠️ Disclaimer:
This indicator does not generate buy/sell signals or exit points. It is meant to be used as a tool within a broader trading strategy. Combine it with your own risk management and market knowledge for best results

Liquidity Stress Index SOFR - IORBLiquidity Stress Index (SOFR - IORB)
This indicator tracks the spread between the Secured Overnight Financing Rate (SOFR) and the Interest on Reserve Balances (IORB) set by the Federal Reserve.
A persistently positive spread may indicate funding stress or liquidity shortages in the repo market, as it suggests overnight lending rates exceed the risk-free rate banks earn at the Fed.
Useful for monitoring monetary policy transmission or market/liquidity stress.

OverUnder Yield Spread🗺️ OverUnder is a structural regime visualizer , engineered to diagnose the shape, tone, and trajectory of the yield curve. Rather than signaling trades directly, it informs traders of the world they’re operating in. Yield curve steepening or flattening, normalizing or inverting — each regime reflects a macro pressure zone that impacts duration demand, liquidity conditions, and systemic risk appetite. OverUnder abstracts that complexity into a color-coded compression map, helping traders orient themselves before making risk decisions. Whether you’re in bonds, currencies, crypto, or equities, the regime matters — and OverUnder makes it visible.
🧠 Core Logic
Built to show the slope and intent of a selected rate pair, the OverUnder Yield Spread defaults to 🇺🇸US10Y-US2Y, but can just as easily compare global sovereign curves or even dislocated monetary systems. This value is continuously monitored and passed through a debounce filter to determine whether the curve is:
• Inverted, or
• Steepening
If the curve is flattening below zero: the world is bracing for contraction. Policy lags. Risk appetite deteriorates. Duration gets bid, but only as protection. Stocks and speculative assets suffer, regardless of positioning.
📍 Curve Regimes in Bull and Bear Contexts
• Flattening occurs when the short and long ends compress . In a bull regime, flattening may reflect long-end demand or fading growth expectations. In a bear regime, flattening often precedes or confirms central bank tightening.
• Steepening indicates expanding spread . In a bull context, this may signal healthy risk appetite or early expansion. In a bear or crisis context, it may reflect aggressive front-end cuts and dislocation between short- and long-term expectations.
• If the curve is steepening above zero: the world is rotating into early expansion. Risk assets behave constructively. Bond traders position for normalization. Equities and crypto begin trending higher on rising forward expectations.
🖐️ Dynamically Colored Spread Line Reflects 1 of 4 Regime States
• 🟢 Normal / Steepening — early expansion or reflation
• 🔵 Normal / Flattening — late-cycle or neutral slowdown
• 🟠 Inverted / Steepening — policy reversal or soft landing attempt
• 🔴 Inverted / Flattening — hard contraction, credit stress, policy lag
🍋 The Lemon Label
At every bar, an anchored label floats directly on the spread line. It displays the active regime (in plain English) and the precise spread in percent (or basis points, depending on resolution). Colored lemon yellow, neither green nor red, the label is always legible — a design choice to de-emphasize bias and center the data .
🎨 Fill Zones
These bands offer spatial, persistent views of macro compression or inversion depth.
• Blue fill appears above the zero line in normal (non-inverted) conditions
• Red fill appears below the zero line during inversion
🧪 Sample Reading: 1W chart of TLT
OverUnder reveals a multi-year arc of structural inversion and regime transition. From mid-2021 through late 2023, the spread remains decisively inverted, signaling persistent flattening and credit stress as bond prices trended sharply lower. This prolonged inversion aligns with a high-volatility phase in TLT, marked by lower highs and an accelerating downtrend, confirming policy lag and macro tightening conditions.
As of early 2025, the spread has crossed back above the zero baseline into a “Normal / Steepening” regime (annotated at +0.56%), suggesting a macro inflection point. Price action remains subdued, but the shift in yield structure may foreshadow a change in trend context — particularly if follow-through in steepening persists.
🎭 Different Traders Respond Differently:
• Bond traders monitor slope change to anticipate policy pivots or recession signals.
• Equity traders use regime shifts to time rotations, from growth into defense, or from contraction into reflation.
• Currency traders interpret curve steepening as yield compression or divergence depending on region.
• Crypto traders treat inversion as a liquidity vacuum — and steepening as an early-phase risk unlock.
🛡️ Can It Compare Different Bond Markets?
Yes — with caveats. The indicator can be used to compare distinct sovereign yield instruments, for example:
• 🇫🇷FR10Y vs 🇩🇪DE10Y - France vs Germany
• 🇯🇵JP10Y vs 🇺🇸US10Y - BoJ vs Fed policy curves
However:
🙈 This no longer visualizes the domestic yield curve, but rather the differential between rate expectations across regions
🙉 The interpretation of “inversion” changes — it reflects spread compression across nations , not within a domestic yield structure
🙊 Color regimes should then be viewed as relative rate positioning , not absolute curve health
🙋🏻 Example: OverUnder compares French vs German 10Y yields
1. 🇫🇷 Change the long-duration ticker to FR10Y
2. 🇩🇪 Set the short-duration ticker to DE10Y
3. 🤔 Interpret the result as: “How much higher is France’s long-term borrowing cost vs Germany’s?”
You’ll see steepening when the spread rises (France decoupling), flattening when the spread compresses (convergence), and inversions when Germany yields rise above France’s — historically rare and meaningful.
🧐 Suggested Use
OverUnder is not a signal engine — it’s a context map. Its value comes from situating any trade idea within the prevailing yield regime. Use it before entries, not after them.
• On the 1W timeframe, OverUnder excels as a macro overlay. Yield regime shifts unfold over quarters, not days. Weekly structure smooths out rate volatility and reveals the true curvature of policy response and liquidity pressure. Use this view to orient your portfolio, define directional bias, or confirm long-duration trend turns in assets like TLT, SPX, or BTC.
• On the 1D timeframe, the indicator becomes tactically useful — especially when aligning breakout setups or trend continuations with steepening or flattening transitions. Daily views can also identify early-stage regime cracks that may not yet be visible on the weekly.
• Avoid sub-daily use unless you’re anchoring a thesis already built on higher timeframe structure. The yield curve is a macro construct — it doesn’t oscillate cleanly at intraday speeds. Shorter views may offer clarity during event-driven spikes (like FOMC reactions), but they do not replace weekly context.
Ultimately, OverUnder helps you decide: What kind of world am I trading in? Use it to confirm macro context, avoid fighting the curve, and lean into trades aligned with the broader pressure regime.

TQ's Support & Resistance(My goal creating this indicator): Provide a way to categorize and label key structures on multiple different levels so I can create a plan based on those observable facts.
The Underlying Concept / What is Momentum?
Momentum indicates transaction pressure. If the algorithm detects price is going up, that would be considered positive momentum. If the algorithm detects price is going down negative momentum would be detected.
The Momentum shown is derived from a price action pattern. Unlike my previous Support & Resistance indicator that used Super Trend, this indicator uses a unique pattern I created. On the first bar bearish momentum is detected a resistance Level is made at the highest point of the previous bullish condition. On the first bar bullish momentum is detected a support Level is made at the lowest point of the previous bearish condition. This happens on 5 different Momentum Levels, (short-term to long-term). I currently use this pattern to trade so the source code is protected.
What is Severity?
Severity is How we differentiate the importance of different Highs and Lows. If Momentum is detected on a higher level the Supply or Demand Level is updated. The Color and Size representing that Level will be shown. Demand and Supply Levels made by higher levels are more SEVERE than a demand level made by a lower level.
Technical Inputs
- to ensure the correct calculation of Support and Resistance levels change BAR_INDEX. BAR_INDEX creates a buffer at the start of the chart. For example: If you set BAR_INDEX to 300. The script will wait for 300 bars to elapse on the current chart before running. This allows the script more time to gather data. Which is needed in order for our dynamic lookback length to never return an error (Dynamic lookback length can't be negative or zero). The lower the timeframe the greater the number of bars need. For Example, if I open up a 1min chart I would enter 5000 as my BAR_INDEX since that will provide enough data to ensure the correct calculation of Support and Resistance levels. If I was on a daily chart, I would enter a lower number such as 800. Don't be afraid to play around with this.
- Toggle options (Close) or (High & Low) creates Support and Resistance Levels using the Lowest close and Highest close or using the Lowest low and Highest high.
Level Inputs
- The indicator has 5 Different Levels indicating SEVEREITY of a Supply and Demand Levels. The higher the Level the more SEVERE the Level.
Display Inputs
- You have the option to customize the Length, Width, Line Style, and Colors of all 5 different
- This indicator includes a Trend Chart. To Easily verify the current trend of any displayed by this indicator toggle on Chart On/Off. You also get the option to change the Chart Position and the size of the Trend Chart
How Trend Is being Determined?
(Close > Current Supply Level) if this statement is true technically price made a HH, so the trend is bullish.
(Close < Current Demand Level) if this statement is true technically price made a LL, so the trend is bearish.
- Fully customize how you display Market Structure on different levels. Line Length, Line Width, Line Style, and Line color can all be customized.
How it can be used?
(Examples of Different ways you can use this indicator): Easily categorize the severity of each and every Supply or Demand Level in the market (The higher Level the stronger the level)
: Quickly Determine the trend of any Level.
: Get a consistent view of a market and how different Levels are behaving but just use one chart.
: Take the discretion from hand drawing support and resistance lines out of your trading.
: Find and categorize strong levels for potential breakouts.
: Trend Analysis, use Levels to create a narrative based on observable facts from these Levels.
: Different Targets to take money off the table.
: Use Severity to differentiate between different trend line setups.
: Find Great places to move your stop loss too.

FunkyQuokka's $ Volume💡 Why $ Volume Matters
Share volume alone is a half-truth — 1M shares traded at $5 isn’t the same as 1M shares at $500. That’s where dollar volume steps in, offering a far more accurate view of institutional interest, breakout validity, liquidity zones and overall trader conviction.
📈 Features:
Clean histogram of dollar volume (close × volume)
Orange line showing customizable average $ volume
K/M/B formatting for axis scale (no huge ugly numbers)
Minimal design to blend into a multi-pane layout
⚙️ Inputs:
Tweakable average length – defaults to 20
By FunkyQuokka 🦘

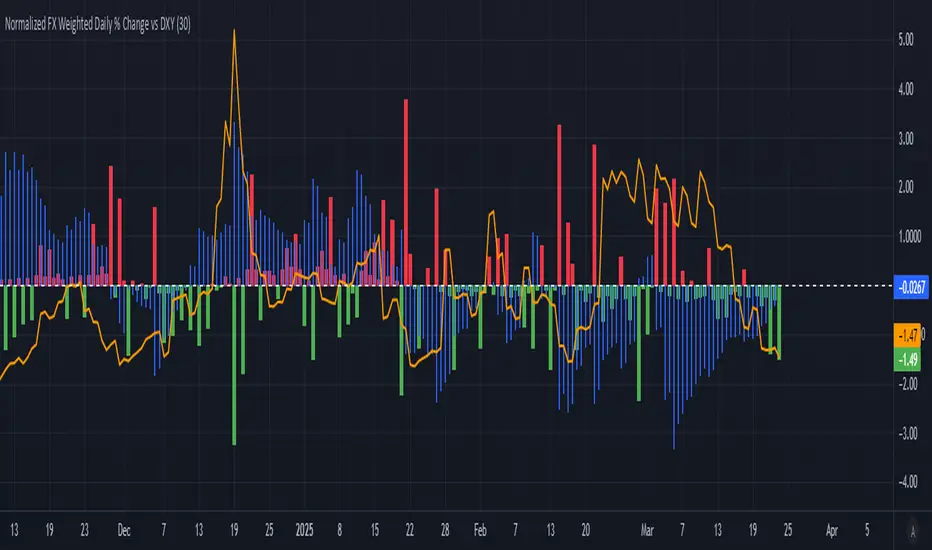
Normalized FX Weighted Daily % Change vs DXYThis indicator tracks international liquidity flows by measuring the USD’s relative strength against major currencies—EUR, CNY, JPY, GBP, and CAD. It calculates the weighted percentage change of each pair over a specified interval. A positive reading means the USD is weakening (liquidity flowing out of the US), while a negative reading indicates the USD is strengthening (liquidity flowing in). Additionally, the indicator incorporates the DXY index and VIX, with all components normalized using Z-scores for clear, comparable insights into market dynamics.
Range Breakout Signals [AlgoAlpha]OVERVIEW
This script detects range-bound market conditions and breakout signals using a combination of volatility compression and volume imbalance analysis. It identifies zones where price consolidates within a defined range and highlights potential breakout points with visual markers. Traders can use this to spot market transitions from ranging to trending phases, aiding in decision-making for breakout strategies.
CONCEPTS
The script measures volatility by comparing the ratio of the simple moving average (SMA) of price movements to their median value. When volatility drops below a threshold, the script assumes a range-bound market. It then tracks the cumulative volume of buying and selling pressure to assess breakout strength. The approach is based on the idea that market consolidation often precedes strong moves, and volume distribution can provide clues on the breakout direction.
FEATURES
Range Detection : Uses a volatility filter to identify low-volatility zones and marks them on the chart with shaded boxes.
Volume Imbalance Analysis : Evaluates cumulative up and down volume over a confirmation period to assess directional bias.
Breakout Signals : When price exits a detected range, the script plots breakout markers. A ▲ symbol indicates a bullish breakout, and a ▼ symbol indicates a bearish breakout. Additional "+" markers indicate strong volume imbalance favoring the breakout direction.
Adaptive Timeframe Volume Analysis : The script dynamically adjusts its volume calculation based on the chart’s timeframe, ensuring reliable signal generation across different trading conditions.
Alerts : Notifies traders when a new range is detected or when a breakout occurs, allowing for automated monitoring.
USAGE
Traders can use this script to identify potential trade setups by entering positions when price breaks out of a detected range. For breakout confirmation, traders can look at volume imbalance cues—bullish breakouts with strong buying volume may indicate sustained moves, while weak volume breakouts may lead to false signals. This script is particularly useful for breakout traders, range traders seeking to fade breakouts, and those looking to automate trade alerts in volatile markets.

Liquidity Sweep Filter Strategy [AlgoAlpha X PineIndicators]This strategy is based on the Liquidity Sweep Filter developed by AlgoAlpha. Full credit for the concept and original indicator goes to AlgoAlpha.
The Liquidity Sweep Filter Strategy is a non-repainting trading system designed to identify liquidity sweeps, trend shifts, and high-impact price levels. It incorporates volume-based liquidation analysis, trend confirmation, and dynamic support/resistance detection to optimize trade entries and exits.
This strategy helps traders:
Detect liquidity sweeps where major market participants trigger stop losses and liquidations.
Identify trend shifts using a volatility-based moving average system.
Analyze volume distribution with a built-in volume profile visualization.
Filter noise by differentiating between major and minor liquidity sweeps.
How the Liquidity Sweep Filter Strategy Works
1. Trend Detection Using Volatility-Based Filtering
The strategy applies a volatility-adjusted moving average system to determine trend direction:
A central trend line is calculated using an EMA smoothed over a user-defined length.
Upper and lower deviation bands are created based on the average price deviation over multiple periods.
If price closes above the upper band, the strategy signals an uptrend.
If price closes below the lower band, the strategy signals a downtrend.
This approach ensures that trend shifts are confirmed only when price significantly moves beyond normal market fluctuations.
2. Liquidity Sweep Detection
Liquidity sweeps occur when price temporarily breaks key levels, triggering stop-loss liquidations or margin call events. The strategy tracks swing highs and lows, marking potential liquidity grabs:
Bearish Liquidity Sweeps – Price breaks a recent high, then reverses downward.
Bullish Liquidity Sweeps – Price breaks a recent low, then reverses upward.
Volume Integration – The strategy analyzes trading volume at each sweep to differentiate between major and minor sweeps.
Key levels where liquidity sweeps occur are plotted as color-coded horizontal lines:
Red lines indicate bearish liquidity sweeps.
Green lines indicate bullish liquidity sweeps.
Labels are displayed at each sweep, showing the volume of liquidated positions at that level.
3. Volume Profile Analysis
The strategy includes an optional volume profile visualization, displaying how trading volume is distributed across different price levels.
Features of the volume profile:
Point of Control (POC) – The price level with the highest traded volume is marked as a key area of interest.
Bounding Box – The profile is enclosed within a transparent box, helping traders visualize the price range of high trading activity.
Customizable Resolution & Scale – Traders can adjust the granularity of the profile to match their preferred time frame.
The volume profile helps identify zones of strong support and resistance, making it easier to anticipate price reactions at key levels.
Trade Entry & Exit Conditions
The strategy allows traders to configure trade direction:
Long Only – Only takes long trades.
Short Only – Only takes short trades.
Long & Short – Trades in both directions.
Entry Conditions
Long Entry:
A bullish trend shift is confirmed.
A bullish liquidity sweep occurs (price sweeps below a key level and reverses).
The trade direction setting allows long trades.
Short Entry:
A bearish trend shift is confirmed.
A bearish liquidity sweep occurs (price sweeps above a key level and reverses).
The trade direction setting allows short trades.
Exit Conditions
Closing a Long Position:
A bearish trend shift occurs.
The position is liquidated at a predefined liquidity sweep level.
Closing a Short Position:
A bullish trend shift occurs.
The position is liquidated at a predefined liquidity sweep level.
Customization Options
The strategy offers multiple adjustable settings:
Trade Mode: Choose between Long Only, Short Only, or Long & Short.
Trend Calculation Length & Multiplier: Adjust how trend signals are calculated.
Liquidity Sweep Sensitivity: Customize how aggressively the strategy identifies sweeps.
Volume Profile Display: Enable or disable the volume profile visualization.
Bounding Box & Scaling: Control the size and position of the volume profile.
Color Customization: Adjust colors for bullish and bearish signals.
Considerations & Limitations
Liquidity sweeps do not always result in reversals. Some price sweeps may continue in the same direction.
Works best in volatile markets. In low-volatility environments, liquidity sweeps may be less reliable.
Trend confirmation adds a slight delay. The strategy ensures valid signals, but this may result in slightly later entries.
Large volume imbalances may distort the volume profile. Adjusting the scale settings can help improve visualization.
Conclusion
The Liquidity Sweep Filter Strategy is a volume-integrated trading system that combines liquidity sweeps, trend analysis, and volume profile data to optimize trade execution.
By identifying key price levels where liquidations occur, this strategy provides valuable insight into market behavior, helping traders make better-informed trading decisions.
Key use cases for this strategy:
Liquidity-Based Trading – Capturing moves triggered by stop hunts and liquidations.
Volume Analysis – Using volume profile data to confirm high-activity price zones.
Trend Following – Entering trades based on confirmed trend shifts.
Support & Resistance Trading – Using liquidity sweep levels as dynamic price zones.
This strategy is fully customizable, allowing traders to adapt it to different market conditions, timeframes, and risk preferences.
Full credit for the original concept and indicator goes to AlgoAlpha.

Global M2 Money Supply (USD) GrowthThe Global M2 Growth indicator evaluates the total liquid money supply, including cash, checking deposits, and assets that can be easily converted to cash. It reflects changes in global liquidity by tracking year-on-year (YoY) changes in the Global M2 money supply rather than its absolute value. This approach highlights the velocity of liquidity expansion or contraction, offering a clearer understanding of its correlation with asset performance, such as Bitcoin.
How It Works
When the Global M2 money supply expands, it reflects an increase in available liquidity. This often leads to an influx of capital into higher-yielding and riskier assets like Bitcoin, equities, and commodities. Conversely, when M2 contracts, liquidity tightens, leading to declines in the values of these assets.
An essential insight is that Bitcoin's price is not immediately affected by changes in M2. Research shows a lag of approximately 56-60 days (around two months) between liquidity changes and Bitcoin's price movements. Shifting the liquidity data forward by this period improves the correlation between Global M2 and Bitcoin performance.
How to Use
Track Global M2 YoY Change: Focus on liquidity's yearly change to identify trends. Rapid increases in liquidity often signify favorable conditions for Bitcoin and other risk assets to rise, while contractions often predict price declines or consolidation phases.
Account for the Lag Effect: Incorporate the two-month lag into your analysis to predict Bitcoin's potential moves more accurately. For instance, a recent resurgence in liquidity growth could signal a Bitcoin rally within the next two months.
Use as a Macro Indicator: Monitor liquidity trends alongside other economic indicators and asset performance metrics to build a more comprehensive investment framework.
By tracking these dynamics, traders and investors can better anticipate Bitcoin's trajectory and make informed decisions.

MTF Fractals [RunRox]🔽 MTF Fractals is a powerful indicator designed to visualize fractals from multiple timeframes directly on your chart, highlight liquidity sweeps at these fractal levels, and provide several additional features we’ll cover in detail below.
We created this indicator because we couldn’t find a suitable tool that met our specific needs on TradingView. Therefore, we decided to develop a valuable indicator for the entire TradingView community, combining simplicity and versatility.
⁉️ WHAT IS A FRACTALS?
In trading, a fractal is a technical analysis pattern composed of five consecutive candles, typically highlighting local market turning points. Specifically, a fractal high is formed when a candle’s high is higher than the highs of the two candles on either side, whereas a fractal low occurs when a candle’s low is lower than the lows of the two adjacent candles on both sides.
Traders use fractals as reference points for identifying significant support and resistance levels, potential reversal areas, and liquidity zones within price action analysis. Below is a screenshot illustrating clearly formed fractals on the chart.
📙 FRACTAL FORMATION
Here’s how fractals form depending on your chosen setting (3, 5, 7, or 9):
▶️ 3-bar fractal – forms when the central candle is higher (for highs) or lower (for lows) than one candle on each side.
▶️ 5-bar fractal – forms when the central candle is higher or lower than two candles on both sides.
▶️ 7-bar fractal – forms when the central candle is higher or lower compared to the three candles on each side.
▶️ 9-bar fractal – forms similarly but requires four candles on each side, making the fractal significantly more reliable and robust.
A higher number of bars ensures stronger fractal levels, highlighting more significant potential reversal points on the chart.
Now that we’ve covered the theory behind fractal formation, let’s explore the indicator’s functionality in more detail.
Below, I’ll explain each feature clearly and illustrate how you can effectively utilize this indicator in your trading.
🕐 MULTI-TIMEFRAME FRACTALS
We realized that displaying fractals only from the current timeframe isn’t always convenient, so we’ve introduced Multi-Timeframe Fractals into this indicator.
Now you can easily display fractals from higher timeframes directly on your current chart, providing you with broader market context and clearer trading signals.
Fractals from Current Timeframe – Fractals identified directly on the chart’s current timeframe.
Fractals from Higher Timeframes – Fractals sourced from higher timeframes and displayed clearly on your current chart for enhanced market perspective.
📈 FRACTAL LINES
Since fractals represent areas of high liquidity, we’ve added an option to extend fractal levels horizontally as Fractal Lines across your chart.
This feature allows you to clearly visualize critical liquidity areas from higher timeframes, directly on your current timeframe chart, as demonstrated in the screenshot below.
With this approach, you can clearly visualize significant fractal levels from higher timeframes directly on your current chart - for example, projecting fractals from the 1-hour (1H) timeframe onto a 3-minute (3m) chart. ✅ This helps you easily identify critical liquidity areas and potential reversal zones without the need to switch between multiple timeframes.
💰 LIQUDITY SWEEP (LIQUDITY GRAB)
To enhance your trading experience, we’ve introduced a feature that clearly identifies liquidity sweeps of fractal levels.
A Liquidity Sweep occurs when a candle closes beyond a fractal line, leaving a wick that pierces through it, signaling that liquidity has been collected at this level.
Below, you’ll find two examples illustrating this functionality:
▶️ Fractal lines from the current timeframe
▶️ Fractal lines projected from higher timeframes
The first example illustrates liquidity being swept from fractals on the current timeframe .
Here, the candle clearly closes beyond the fractal line, leaving a wick through it. This indicates a liquidity sweep at the fractal level, visually highlighting a potential reversal or continuation opportunity directly on your chart.
In the second example, fractals from the higher timeframe are projected onto your current chart.
When a candle on your current timeframe closes beyond an HTF fractal line - leaving a wick through this level - the indicator highlights it clearly. This signals to traders a potential reversal zone, indicating that liquidity has been swept, and price may reverse or significantly react from this area.
You can also enable the display of additional labels on the chart. These labels clearly mark liquidity sweeps at fractal levels, making it easier to visually identify potential reversal points directly on your chart.
⚙️ SETTINGS
Below are the indicator settings with detailed explanations for each parameter.
🔷 Bars in Fractal – Number of candles to the right and left required to form a fractal.
🔷 Fractal Timeframe – Select the timeframe from which you want to display fractals on the current chart.
🔷 Max Age, bars – Number of bars during which the fractal will remain active.
🔷 Show Fractal Line – Display or hide fractal lines.
🔷 Line Style – Choose the style of the line displayed on the chart.
🔷 Line Width – Thickness of the fractal line.
🔷 High Fractal – Style and color of bearish fractals.
🔷 Low Fractal – Style and color of bullish fractals.
🔷 Fractal Label Size – Select the size of fractal labels.
🔷 Show Sweep Labels – Option to display labels when a liquidity sweep occurs.
🔷 Label Color – Color and transparency of the area marked on the chart during a sweep.
🔷 Shade Sweep Area – Show or hide the sweep area shading.
🔷 Area Color – Color and transparency settings for the sweep area.
🔶 We’d love to hear your feedback and any suggestions for additional features you’d like to see in this indicator. We’ll be happy to consider your ideas and continue improving the indicator!

Liquidity Depth [AlgoAlpha]OVERVIEW
This script visualizes market liquidity by identifying key price levels where significant volume has transacted. It highlights zones of high buying and selling interest, helping traders understand where liquidity is accumulating and how price may respond to these areas. By dynamically tracking volume at highs and lows, the script builds a real-time liquidity profile, making it a powerful tool for identifying potential support and resistance levels.
CONCEPTS
Liquidity depth analysis helps traders determine how price interacts with supply and demand at different levels. The script processes historical volume data to distinguish between high-liquidity and low-liquidity zones. It assigns transparency levels to plotted lines , ensuring that more relevant liquidity areas stand out visually. The script adds a profile to show the depth of liquidity (derived from historical volume data) for levels above and below the current price
FEATURES
Liquidity Levels: Tracks liquidity levels based on volume concentration at price high and lows.
Volume-Based Transparency: More significant liquidity levels are displayed with higher visibility, showing their significance.
Interpolation: interpolates the bullish and bearish liquidity depth at a user defined range away from the price, helping in comparing the liquidity amounts between bullish and bearish.
Depth Profile: Allows traders to visualize depth of liquidity in a more quantitative and clearer way than the liquidity levels/list]
USAGE
This indicator is best used to track liquidity levels and potential price reaction areas. Traders can adjust the Liquidity Lookback setting to analyze past liquidity levels over different historical periods. The Profile Resolution setting controls the granularity of liquidity depth visualization, with higher values providing more detail. The script can be applied across different timeframes, from intraday scalping to swing trading analysis. The plotted liquidity zones provide traders with insights into where price may encounter strong support, resistance, or potential liquidity-driven reversals.

1H/3m Concept [RunRox]🕘 1H/3m Concept is a versatile trading methodology based on liquidity sweeps from fractal points identified on higher timeframes, followed by price reversals at these key moments.
Below, I will explain this concept in detail and provide clear examples demonstrating its practical application.
⁉️ WHAT IS A FRACTALS?
In trading, a fractal is a technical analysis pattern composed of five consecutive candles, typically highlighting local market turning points. Specifically, a fractal high is formed when a candle’s high is higher than the highs of the two candles on either side, whereas a fractal low occurs when a candle’s low is lower than the lows of the two adjacent candles on both sides.
Traders use fractals as reference points for identifying significant support and resistance levels, potential reversal areas, and liquidity zones within price action analysis. Below is a screenshot illustrating clearly formed fractals on the chart.
📌 ABOUT THE CONCEPT
The 1H/3m Concept involves marking Higher Timeframe (HTF) fractals directly onto a Lower Timeframe (LTF) chart. When a liquidity sweep occurs at an HTF fractal level, we remain on the same LTF chart (since all HTF fractals are already plotted on this lower timeframe) and wait for a clear Market Structure Shift (MSS) to identify our potential entry point.
Below is a schematic illustration clearly demonstrating how this concept works in practice.
Below is another 💡 real-chart example , showing liquidity in the form of a 1H fractal, swept by a rapid impulse move. Immediately afterward, a clear Market Structure Shift (MSS) occurs, signaling a potential entry point into the trade.
Another example is shown below, where we see our hourly fractal, from which price clearly reacts, providing an opportunity to search for an entry point.
As illustrated on the chart, the fractal levels from the higher timeframe are clearly displayed, but we’re working directly on the 5-minute chart. This allows us to remain on one timeframe without needing to switch back and forth between charts to spot such trading setups.
🔍 MTF FRACTALS
This concept can be applied across various HTF-LTF timeframe combinations. Although our examples illustrate 1H fractals used on a 5-minute chart, you can effectively utilize many other timeframe combinations, such as:
30m HTF fractals on 1m chart
1H HTF fractals on 3m chart
4H HTF fractals on 15m chart
1D HTF fractals on 1H chart
The key idea behind this concept is always the same: identify liquidity at fractal levels on the higher timeframe (HTF), then wait for a clear Market Structure Shift (MSS) on the lower timeframe (LTF) to enter trades.
⚙️ SETTINGS
🔷 Trade Direction – Select the preferred trading direction (Long, Short, or Both).
🔷 HTF – Choose the higher timeframe from which fractals will be displayed on the current chart.
🔷 HTF Period – Number of candles required on both sides of a fractal candle (before and after) to confirm fractal formation on the HTF.
🔷 Current TF Period – Sensitivity to the impulse that sweeps liquidity, used for identifying and forming the MSS line.
🔷 Show HTF – Enable or disable displaying HTF fractal lines on your chart. You can also customize line style and color.
🔷 Max Age (Bars) – Number of recent bars within which fractals from the selected HTF will be displayed.
🔷 Show Entry – Enable or disable displaying the MSS line on the chart.
🔷 Enable Alert – Activates TradingView alerts whenever the MSS line is crossed.
You can also enable 🔔 alerts, which notify you whenever price crosses the MSS line. This significantly simplifies the process of identifying these setups on your charts. Simply configure your preferred timeframes and wait for notifications when the MSS line is crossed.
🔶 We greatly appreciate your feedback and suggestions for improving the indicator!

Liquidity Location Detector [BigBeluga]
This indicator helps traders identify potential liquidity zones by detecting significant volume levels at key highs and lows. By using color intensity and scoring numbers, it visually highlights areas where liquidity concentration may be highest while incorporating trend analysis through EMAs.
🔵Key Features:
Liquidity Zone Detection: Automatically detects and marks areas where significant volume has accumulated at swing highs and lows.
Dynamic Box Plotting: Draws liquidity boxes at key highs and lows, updating based on market conditions.
Volume Strength Scaling: Uses a scoring system to rank liquidity zones, helping traders identify the strongest areas.
Color Intensity for Volume Strength: More transperent color indicate less liquidity, while less transperent represent stronger volume concentrations.
Customizable Display: Users can adjust the number of displayed liquidity zones and modify colors to suit their trading style.
Real-Time Liquidity Adaptation: As price interacts with liquidity zones, the indicator updates dynamically to reflect changing market conditions.
Auto-Stopping Liquidity Zones: Liquidity boxes automatically stop extending to the right once price crosses them, preventing outdated zones from interfering with live market action.
Trend Analysis with EMAs: Includes two optional EMAs (fast and slow) to help traders analyze market trends. Users can enable or disable these EMAs in the settings and use crossover signals for trend confirmation.
🔵Usage:
Identify Key Liquidity Areas: Use color intensity and transparency levels to determine high-impact liquidity zones.
Support & Resistance Confirmation: Liquidity zones can act as potential support and resistance levels, enhancing trade decision-making.
Market Structure Analysis: Observe how price interacts with liquidity to anticipate breakout or reversal points.
Scalping & Swing Trading: Works for both short-term and long-term traders looking for liquidity-based trade setups.
Liquidation Map Insight: A liquidity map highlights areas where large amounts of leveraged positions (both long and short) are likely to get liquidated. Since many traders use leverage, sharp price movements can trigger a cascade of liquidations, leading to rapid price surges or drops. Monitoring these liquidity zones and trends helps traders anticipate where price might react strongly.
Liquidity Location Detector is an essential tool for traders seeking to map out potential liquidity zones, providing deeper insights into market structure and trading volume dynamics.

FinFluential Global M2 Money Supply // Days Offset =The "Global M2 Money Supply" indicator calculates and visualizes the combined M2 money supply from multiple countries and regions worldwide, expressed in trillions of USD.
M2 is a measure of the money supply that includes cash, checking deposits, and easily convertible near-money assets. This indicator aggregates daily M2 data from various economies, converts them into a common USD base using forex exchange rates, and plots the total as a single line on the chart.
It is designed as an overlay indicator aligned to the right scale, making it ideal for comparing global money supply trends with price action or other market data.
Key Features
Customizable Time Offset: Users can adjust the number of days to shift the M2 data forward or backward (from -1000 to +1000 days) via the indicator settings. This allows for alignment with historical events or forward-looking analysis.
Global Coverage Includes:
Eurozone: Eurozone M2 (converted via EUR/USD)
North America: United States, Canada
Non-EU Europe: Switzerland, United Kingdom, Finland, Russia
Pacific: New Zealand
Asia: China, Taiwan, Hong Kong, India, Japan, Philippines, Singapore
Latin America: Brazil, Colombia, Mexico
Middle East: United Arab Emirates, Turkey
Africa: South Africa

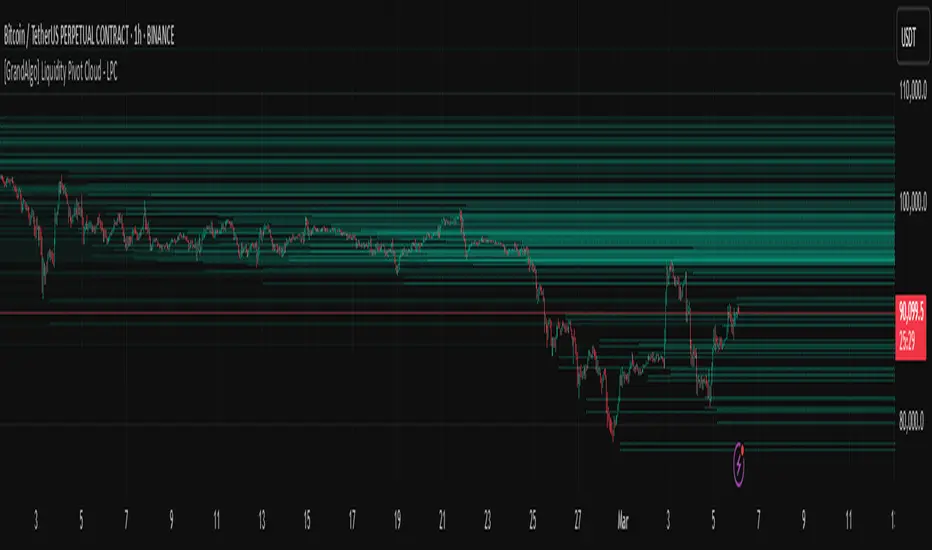
[GrandAlgo] Liquidity Pivot Cloud - LPCLiquidity Pivot Cloud (LPC) is a visualization tool that extends all pivot levels to the right, creating a structured liquidity map across the chart. Instead of treating pivot points as static levels, LPC transforms them into a dynamic cloud, highlighting key areas where price has historically reacted.
Key Features:
Extended Pivot Levels – Automatically stretches all pivot highs and lows, forming a continuous liquidity zone.
Clear Structure – Provides an organized view of price action, making it easy to identify reaction zones.
Dynamic Liquidity Map – Helps traders spot potential liquidity sweeps and areas of price absorption.
How to Use:
Identify Liquidity Zones – Areas with multiple overlapping pivots signal strong liquidity pools.
Look for Reactions – Price often consolidates, wicks, or reverses around extended pivot clouds.
Combine with Confluence – Use alongside Fair Value Gaps, Institutional Price Blocks, or Market Structure shifts for higher probability setups.
LPC aligns with smart money concepts by revealing key liquidity areas where stop hunts, liquidity grabs, and institutional activity are likely to occur. It helps traders see where price is likely to be drawn before a major move, making it a valuable tool for those trading liquidity-based strategies.
Liquidations Levels [RunRox]📈 Liquidation Levels is an indicator designed to visualize key price levels on the chart, highlighting potential reversal points where liquidity may trigger significant price movements.
Liquidity is essential in trading - price action consistently moves from one liquidity area to another. We’ve created this free indicator to help traders easily identify and visualize these liquidity zones on their charts.
📌 HOW IT WORKS
The indicator works by marking visible highs and lows, points widely recognized by traders. Because many traders commonly place their stop-loss orders beyond these visible extremes, significant liquidity accumulates behind these points. By analyzing trading volume and visible extremes, the indicator estimates areas where clusters of stop-loss orders (liquidity pools) are likely positioned, giving traders valuable insights into potential market moves.
As shown in the screenshot above, the price aggressively moved toward Sell-Side liquidity. After sweeping this liquidity level for the second time, it reversed and began targeting Buy-Side liquidity. This clearly demonstrates how price moves from one liquidity pool to another, continually seeking out liquidity to fuel its next directional move.
As shown in the screenshot, price levels with fewer anticipated trader stop-losses are indicated by less vibrant, faded colors. When the lines become more saturated and vivid, it signals that sufficient liquidity - in the form of clustered stop-losses has accumulated, potentially attracting price movement toward these areas.
⚙️ SETTINGS
🔹 Period – Increasing this setting makes the marked highs and lows more significant, filtering out minor price swings.
🔹 Low Volume – Select the color displayed for low-liquidity levels.
🔹 High Volume – Select the color displayed for high-liquidity levels.
🔹 Levels to Display – Choose between 1 and 15 nearest liquidity levels to be shown on the chart.
🔹 Volume Sensitivity – Adjust the sensitivity of the indicator to volume data on the chart.
🔹 Show Volume – Enable or disable the display of volume values next to each liquidity level.
🔹 Max Age – Limits displayed liquidity levels to those not older than the specified number of bars.
✅ HOW TO USE
One method of using this indicator is demonstrated in the screenshot above.
Price reached a high-liquidity level and showed an initial reaction. We then waited for a second confirmation - a liquidity sweep followed by a clear market structure break - to enter the trade.
Our target is set at the liquidity accumulated below, with the stop-loss placed behind the manipulation high responsible for the liquidity sweep.
By following this approach, you can effectively identify trading opportunities using this indicator.
🔶 We’ve made every effort to create an indicator that’s as simple and user-friendly as possible. We’ll continue to improve and enhance it based on your feedback and suggestions in the future.

Engulfing Sweeps - Milana TradesEngulfing Sweeps
The Engulfing Sweeps Candle is a candlestick pattern that:
1)Takes liquidity from the previous candle’s high or low.
2)Fully engulfs previous candles upon closing.
3)Indicates strong buying or selling pressure.
4)Helps determine the bias of the next candle.
Logic Behind Engulfing Sweeps
If you analyze this candle on a lower timeframe, you’ll often see popular models like PO3 (Power of Three) or AMD (Accumulation – Manipulation – Distribution).
Once the candle closes, the goal is to enter a position on the retracement of the distribution phase.
How to Use Engulfing Sweeps?
Recommended Timeframes:
4H, Daily, Weekly – these levels hold significant liquidity.
Personally, I prefer 4H, as it provides a solid view of mid-term market moves.
Step1 - Identify Engulfing Sweep Candle
Step 2-Switch to a lower timeframe (15m or 5m).And you task identify optimal trade entry
Look for an entry pattern based on:
FVG (Fair Value Gap)
OB (Order Block)
FIB levels (0/0.25/0.5/ 0.75/ 1)
Wait for confirmation and take the trade.
Automating with TradingView Alerts
To avoid missing the pattern, you can set up alerts using a custom script. Once the pattern forms, TradingView will notify you so you can analyze the chart and take action. This approch helps me be more freedom
