Impermanent Loss TrackerThe indicator helps to track the percentage loss/gain of the quantity of the asset as a result of LP rebalancing due to price changes.
Calculations are based on the common AMM equation x * y = k.
This is the initial version of the indicator. It is certainly a subject to further improvement. If you have any suggestions send them here at andmax071@gmail.com.
Thank you for trying this out.
Liquidity

Demand & Supply Zones [eyes20xx]Demand & Supply Zones
This indicator helps to identify large moves driven by institutions.
What qualifies as a zone?
If the price moves (open to close) by more than a certain % in one candle or in a bullish / bearish run of candles, the zone is marked as a Demand or Supply zone .
0.8% is good for Crypto and Forex might be better with 0.4%. Play around with the % to match your requirements.
Active zones
A zone remains active until it is hit by the price. When it becomes inactive, the zone background becomes transparent.
Zone lines
Lines are displayed if the zone is active and within a certain % of the close. 3% is a good setting for Crypto.
A maximum of two lines are displayed for each zone type.

Ticker SummaryTicker Summary provides at-a-glance summary information about a ticker near the current bar on the chart:
P/E ratio
Fwd P/E ratio
PEG ratio
Floating shares vs. total shares outstanding
% of trading volume that was short over the last 3 days
Average True Range (ATR) over last 14 days
There are a few less common items of information:
How many ATR multiples the ATR is extended over the last 10 bars. This gives an idea of how far the stock is currently extended.
"R-frequency", explained below.
An optional "ATR Reticule" is shown near the price. This is useful for traders that use ATR as a guideline for price targets and stop losses. On the left is the # of ATRs the stock is currently above the session open. On the right is the # of ATRs the stock is extended above the 10-bar moving average.
R-frequency: a measure of liquidity relevant to your own trading size. It is the frequency at which 1-R of your trading account is traded for a stock. Formula:
(1-R worth of shares) / (average dollar value traded per second), where:
"1-R worth of shares" is how many shares you would buy for a stop loss of -1 ATR, with max risk dollar value based on the Balance and Max Risk % indicator options.
"Average dollar value traded per second" is the 14-day average of (avg(high, low and close) * daily volume)
R-frequency of a second or less is very liquid. If the value is higher (for example, over 60 seconds) the stock is less liquid and you may have some trouble filling limit orders quickly.

Volumetric colored candles with matching pivot point linesCandles are split into 10 categories based on their volume, and can be changed in the options. By default and in the images, white is very high volume, reds are high volume, yellows are medium volume, greens are low and dark-grey is very low.
Adjustments for scale are included in the options. The Magnitude option is a 10x multiplier, so 1=10, 2=100, 3=1000, etc., up to 9. There is also a Multiplier selection option where 1=1, 2=2, 3=3, 4=4, etc.
To attenuate for a given chart, these multipliers will need to be changed. In general, all white means you need to increase the Magnitude and all dark-grey means you need to decrease the magnitude. Somewhere between those two, the Multiplier can be used for further calibration. All this color coating is relational, like a spectrum. As you adjust you will see them maintaining their proportions as the candles switch color (ex. green become yellow while yellow becomes red).
I have also included pivot lines that follow the same logic for color coding. Two options exist for adjusting the pivot high and pivot low points respectively. They do not always correspond to the exact color of the candle producing them, but they should be a rough average (ie. red and green bars making yellow lines). They make for good indicators of how much liquidity may be at a certain support/resistance level. The lines can also be turned off altogether.
If your candles aren't looking right, go to settings of both regular candles and heikin-ashi, and uncheck both border and wick.
I still have some code to clean up and I plan on expanding upon this study. If you like my work consider tipping!

Average Trading Volume ValueCalculates Average Trading Volume and uses mark price to convert it between base/quote currencies
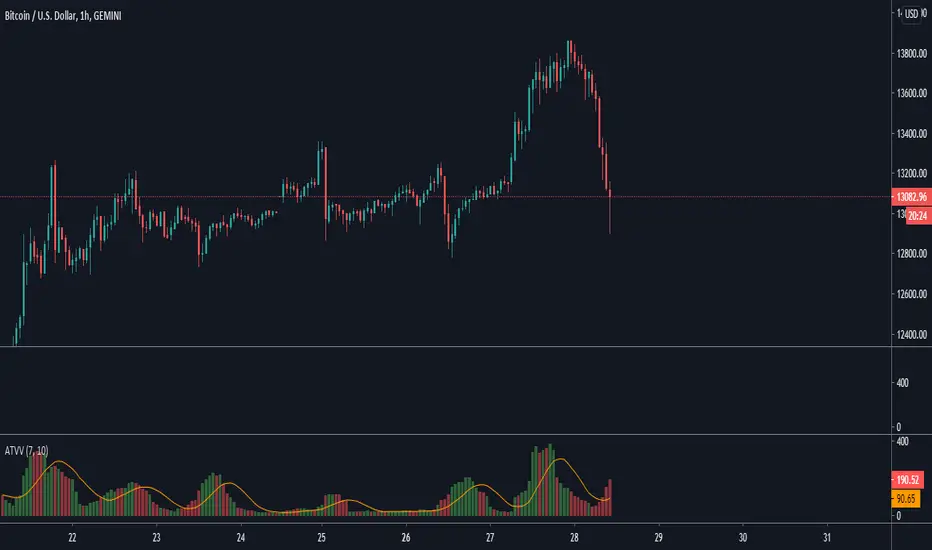
Multi Timeframe Rolling Bitmex Liquidation LevelsTrack Bitmex liquidations levels in real-time with a rolling VWMA or VWAP basis.
Allows the input of a different time frame if you wish.

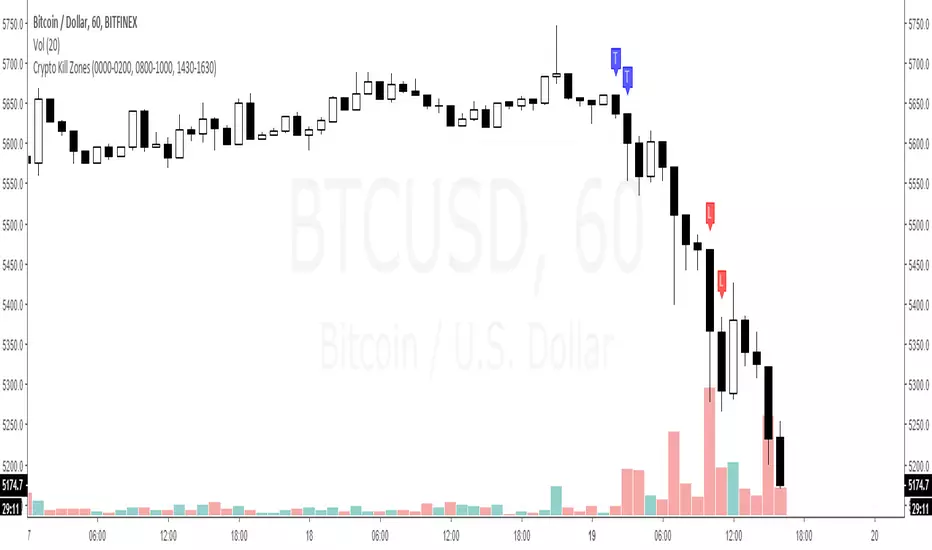
Kill ZonesThe Indicator is supposed to mark the first two hours of the:
Open session of Tokyo stocks market
Open session of the London stocks market
Open session of the NY stocks market
Go to the indicator's settings and set the open hours for your timezone.
Use on 1H timeframe.
GapologyThis indicator can be used as a simple measure of price action tradability. It's an alternative to volume that focuses on the gaps between close and open candle prices. The bigger the gaps, the more spread and slippage you'll get when trading.
