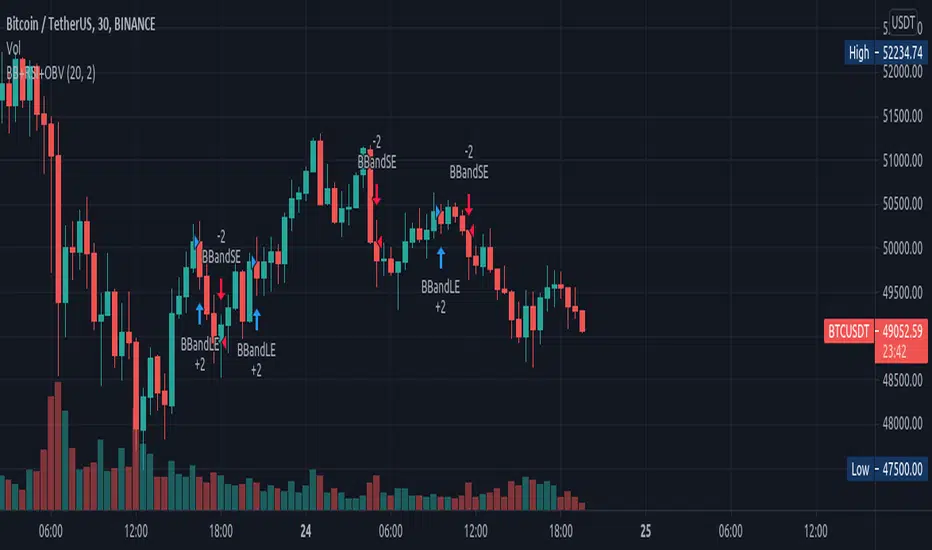
BB+RSI+OBVI use Bolinger Band and RSI and OBV
when Bolinger band midline cross and rsi is bigger than 50 and obv is going up i wrote this strategy to test this strategy
M-oscillator
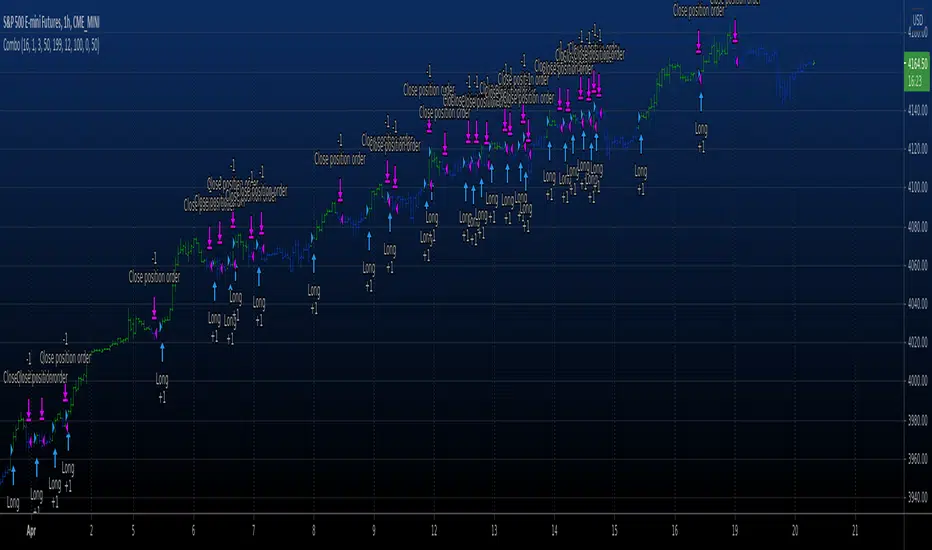
Combo Backtest 123 Reversal & Prime Number Bands This is combo strategies for get a cumulative signal.
First strategy
This System was created from the Book "How I Tripled My Money In The
Futures Market" by Ulf Jensen, Page 183. This is reverse type of strategies.
The strategy buys at market, if close price is higher than the previous close
during 2 days and the meaning of 9-days Stochastic Slow Oscillator is lower than 50.
The strategy sells at market, if close price is lower than the previous close price
during 2 days and the meaning of 9-days Stochastic Fast Oscillator is higher than 50.
Second strategy
Determining market trends has become a science even though a high number
or people still believe it’s a gambling game. Mathematicians, technicians,
brokers and investors have worked together in developing quite several
indicators to help them better understand and forecast market movements.
The Prime Number Bands indicator was developed by Modulus Financial Engineering
Inc. This indicator is charted by indentifying the highest and lowest prime number
in the neighborhood and plotting the two series as a band.
WARNING:
- For purpose educate only
- This script to change bars colors.

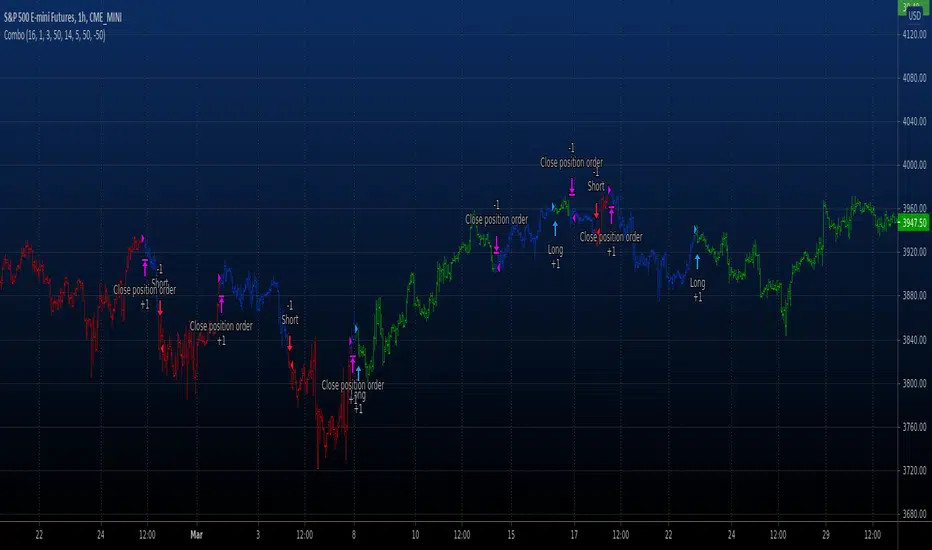
Combo Backtest 123 Reversal & Positive Volume Index This is combo strategies for get a cumulative signal.
First strategy
This System was created from the Book "How I Tripled My Money In The
Futures Market" by Ulf Jensen, Page 183. This is reverse type of strategies.
The strategy buys at market, if close price is higher than the previous close
during 2 days and the meaning of 9-days Stochastic Slow Oscillator is lower than 50.
The strategy sells at market, if close price is lower than the previous close price
during 2 days and the meaning of 9-days Stochastic Fast Oscillator is higher than 50.
Second strategy
The theory behind the indexes is as follows: On days of increasing volume,
you can expect prices to increase, and on days of decreasing volume, you can
expect prices to decrease. This goes with the idea of the market being in-gear
and out-of-gear. Both PVI and NVI work in similar fashions: Both are a running
cumulative of values, which means you either keep adding or subtracting price
rate of change each day to the previous day`s sum. In the case of PVI, if today`s
volume is less than yesterday`s, don`t add anything; if today`s volume is greater,
then add today`s price rate of change. For NVI, add today`s price rate of change
only if today`s volume is less than yesterday`s.
WARNING:
- For purpose educate only
- This script to change bars colors.

Combo Backtest 123 Reversal & Pivot Point V2 This is combo strategies for get a cumulative signal.
First strategy
This System was created from the Book "How I Tripled My Money In The
Futures Market" by Ulf Jensen, Page 183. This is reverse type of strategies.
The strategy buys at market, if close price is higher than the previous close
during 2 days and the meaning of 9-days Stochastic Slow Oscillator is lower than 50.
The strategy sells at market, if close price is lower than the previous close price
during 2 days and the meaning of 9-days Stochastic Fast Oscillator is higher than 50.
Second strategy
Pivot points simply took the high, low, and closing price from the previous period and
divided by 3 to find the pivot. From this pivot, traders would then base their
calculations for three support, and three resistance levels. The calculation for the most
basic flavor of pivot points, known as ‘floor-trader pivots’, along with their support and
resistance levels.
WARNING:
- For purpose educate only
- This script to change bars colors.

Combo Backtest 123 Reversal & Pivot Detector Oscillator Copyright by HPotter v1.0 20/04/2021
This is combo strategies for get a cumulative signal.
First strategy
This System was created from the Book "How I Tripled My Money In The
Futures Market" by Ulf Jensen, Page 183. This is reverse type of strategies.
The strategy buys at market, if close price is higher than the previous close
during 2 days and the meaning of 9-days Stochastic Slow Oscillator is lower than 50.
The strategy sells at market, if close price is lower than the previous close price
during 2 days and the meaning of 9-days Stochastic Fast Oscillator is higher than 50.
Second strategy
The Pivot Detector Oscillator, by Giorgos E. Siligardos
The related article is copyrighted material from Stocks & Commodities 2009 Sep
WARNING:
- For purpose educate only
- This script to change bars colors.
Stochastic TrendDear community,
I've made another simple trading bot for you to use. This bot is based on the Stochastic Oscillator. It only produces long trades currently.
I changed the oscillation period to a much longer one, which in turn creates opportunities to trade long term trends.
The bot goes long when the Entry lines is crossed from below and it will close its long position once the Exit line has been crossed from above.

Combo Backtest 123 Reversal & PFE (Polarized Fractal Efficiency) This is combo strategies for get a cumulative signal.
First strategy
This System was created from the Book "How I Tripled My Money In The
Futures Market" by Ulf Jensen, Page 183. This is reverse type of strategies.
The strategy buys at market, if close price is higher than the previous close
during 2 days and the meaning of 9-days Stochastic Slow Oscillator is lower than 50.
The strategy sells at market, if close price is lower than the previous close price
during 2 days and the meaning of 9-days Stochastic Fast Oscillator is higher than 50.
Second strategy
The Polarized Fractal Efficiency (PFE) indicator measures the efficiency
of price movements by drawing on concepts from fractal geometry and chaos
theory. The more linear and efficient the price movement, the shorter the
distance the prices must travel between two points and thus the more efficient
the price movement.
WARNING:
- For purpose educate only
- This script to change bars colors.
Combo Backtest 123 Reversal & Perfomance indexThis is combo strategies for get a cumulative signal.
First strategy
This System was created from the Book "How I Tripled My Money In The
Futures Market" by Ulf Jensen, Page 183. This is reverse type of strategies.
The strategy buys at market, if close price is higher than the previous close
during 2 days and the meaning of 9-days Stochastic Slow Oscillator is lower than 50.
The strategy sells at market, if close price is lower than the previous close price
during 2 days and the meaning of 9-days Stochastic Fast Oscillator is higher than 50.
Second strategy
The Performance indicator or a more familiar term, KPI (key performance indicator),
is an industry term that measures the performance. Generally used by organizations,
they determine whether the company is successful or not, and the degree of success.
It is used on a business’ different levels, to quantify the progress or regress of a
department, of an employee or even of a certain program or activity. For a manager
it’s extremely important to determine which KPIs are relevant for his activity, and
what is important almost always depends on which department he wants to measure the
performance for. So the indicators set for the financial team will be different than
the ones for the marketing department and so on.
Similar to the KPIs companies use to measure their performance on a monthly, quarterly
and yearly basis, the stock market makes use of a performance indicator as well, although
on the market, the performance index is calculated on a daily basis. The stock market
performance indicates the direction of the stock market as a whole, or of a specific stock
and gives traders an overall impression over the future security prices, helping them decide
the best move. A change in the indicator gives information about future trends a stock could
adopt, information about a sector or even on the whole economy. The financial sector is the
most relevant department of the economy and the indicators provide information on its overall
health, so when a stock price moves upwards, the indicators are a signal of good news. On the
other hand, if the price of a particular stock decreases, that is because bad news about its
performance are out and they generate negative signals to the market, causing the price to go
downwards. One could state that the movement of the security prices and consequently, the movement
of the indicators are an overall evaluation of a country’s economic trend.
WARNING:
- For purpose educate only
- This script to change bars colors.

Combo Backtest 123 Reversal & Percentage Volume Oscillator (PVO) This is combo strategies for get a cumulative signal.
First strategy
This System was created from the Book "How I Tripled My Money In The
Futures Market" by Ulf Jensen, Page 183. This is reverse type of strategies.
The strategy buys at market, if close price is higher than the previous close
during 2 days and the meaning of 9-days Stochastic Slow Oscillator is lower than 50.
The strategy sells at market, if close price is lower than the previous close price
during 2 days and the meaning of 9-days Stochastic Fast Oscillator is higher than 50.
Second strategy
The Percentage Volume Oscillator (PVO) is a momentum oscillator for volume.
PVO measures the difference between two volume-based moving averages as a
percentage of the larger moving average. As with MACD and the Percentage Price
Oscillator (PPO), it is shown with a signal line, a histogram and a centerline.
PVO is positive when the shorter volume EMA is above the longer volume EMA and
negative when the shorter volume EMA is below. This indicator can be used to define
the ups and downs for volume, which can then be use to confirm or refute other signals.
Typically, a breakout or support break is validated when PVO is rising or positive.
WARNING:
- For purpose educate only
- This script to change bars colors.

Full strategy Psar+ adx + cmf + rsi This ia full strategy made with a combination of a trender, volume, volatility and oscillator.
In this case we only go long.
Indicators used:
Default PSAR
Default CMF
Modified RSI logic, not using OB/OS
ADX with EMA applied
The rules are : we check if we are in a uptrend on psar, together with a positive value in volume, rsi is above the middle line(50), using a big length, and lastly the ADx is superior to the ema ADx
For exit, we check the opposite, like downtrend psar, negative value volume, rsi < 50, and adx < ema adx
If you have any questions let me know.

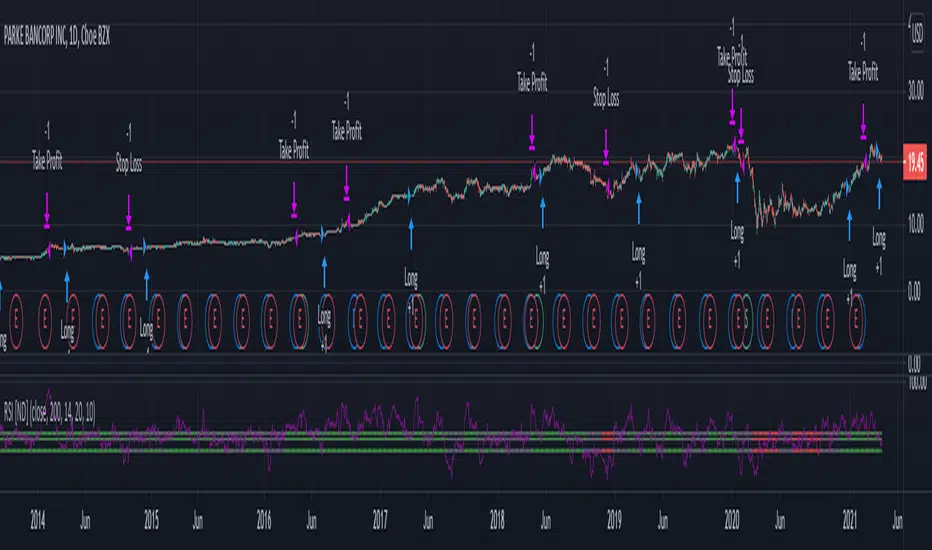
RSI Strategy [Nostradanis]Strategy based on an adaptation of the Relative Strength Index and slow exponential moving average.
Green lines: uptrend
Gray lines: lateral trend
Red Lines: downtrend
Use:
When RSI crosses up 40 and 50 lines can be a good long entry if ema trend is clearly bullish.
55 line confirms entry.
Designed for swing with under $20 shares but can be adapted to scalping
Combo Backtest 123 Difference between price and MA This is combo strategies for get a cumulative signal.
First strategy
This System was created from the Book "How I Tripled My Money In The
Futures Market" by Ulf Jensen, Page 183. This is reverse type of strategies.
The strategy buys at market, if close price is higher than the previous close
during 2 days and the meaning of 9-days Stochastic Slow Oscillator is lower than 50.
The strategy sells at market, if close price is lower than the previous close price
during 2 days and the meaning of 9-days Stochastic Fast Oscillator is higher than 50.
Second strategy
Percent difference between price and MA
WARNING:
- For purpose educate only
- This script to change bars colors.
RSI Trend CryptoDear community,
Today I want to present you one of my favorite and simple trading bots: The RSI Trend.
This bot is based on the RSI, which normally is used as a trend reversal indicator. However, here it’s used as a trend finding indicator, often with great success. This bot making long-only trades, which is quite successful in bull-markets like the one we’re currently in.
In case you want to use an emergency exit for your trade, toggle the Emergency Exit parameter. During bull-markets it’s better in the long term to keep this option off.
Currently the bot only makes one trade at a time (pyramiding = 1), for higher risk and higher rewards you can increase this parameter. More than 5 is not advised.
I’ve optimized this bot on 15min time frame. It has some decent results for most cryptos on this TF, feel free to test this out.
In case you want to hook this bot up to your exchange, feel free to edit the ALERT messages in the code.
Default Trading Rules:
Long: RSI crosses over 35
Close Long: RSI crosses under 75
Emergency Exit: RSI crosses under 10

Full CRYPTO pack macd, rsi, obv, ema strategyThis is a simple, yet very efficient crypto strategy, adapted to 4h time frame, on big coins like ETH and BTC. However it can be adapted to other markets, timeframes etc
For this strategy I use a combination of a trend line, an oscillator, price action and volume.
This strategy has both the opportunity to go long and short.
As well, it has a leverage simulator .
The rules are the next ones:
Long : we check that current candle is ascending and above the moving average, the macd is in positive range, rsi is below overbought level and volume is bigger than the moving avg of volume.
For short, we have the opposite long rules.
If you have any questions, please let me know !

[Strategy]Complex MA Deviation Rate Signal by MEGANEKOThis Indicator is SUPER upgraded script of Normal Moving Average Deviatin Rate.
As you know, Moving Average Deviation Rate is very powerful method when you take a position of Contrarian.
added Long and Short signal by Triangles by:
-OverShoot Signal
-ReturnMovement Signal
added std-third and std-fourth lines.
added colors between std-center line and the zero line.
Entry/Order systems are also built in.
- aleartcondition of Target -upper and -lower.
- Selector of Signals Triggered range.
- when one selected zero period of SMA interprets to make Normal MA Deviation rate of the other (Based) MA.
- Standard Deviation Line of -1,-2,-3,-4,-5,+1,+2,+3,+4,+5.
Other SUPER Features:
-Volatility LowCut Filter for Signals(both of Overshoot and ReturnMovement)
-MACD of Complex MA-Deviation-Rate and Cross alerts.
-CenterLine Slope Bullish/Bearish alerts.
-ON/OFF Switches of each features.
It is INVITATION ONLY for my friends of investments.

Carpe Diem [Strategy]Carpe Diem Strategy, a wave cycle strategy that only enters when markets are up trending.
The script uses 3 different trend detection indicators including volume which helps with confirmation.
This script has 10 variations built within it which are fitted for the coins differnt coinditions
The coins included are
BTC/USDT 4H
ETH/USDT 4H
LTC/USDT 4H
ADA/USDT 4H
BNB/USDT 2H
BAND/USDT 4H
BAT/USDT 3H
OGN/USDT 4H
ZIL/USDT 4H
BZRX/USDT 2H
How to use the Indicator
You can change what plots are shown in the settings Cog
When the wave lines are green, the market is up trending and will be looking for a trade whereas when they are red, the market is in a sideways or downtrend.
The buy signal is given by the fast wave either crossing over the slow wave line, or crossing over the value of 25.
The exit signal is when the wave crosses back under the 75 value
This strategy includes Fees and there is NO Repaint. The script is written in version 4
There is an option in the settings cog to choose from 10 Coins and timeframes which the Strategies have been optimised for.
There is also another option in the settings cog to change the backtesting range.
There is also another option to adjust the stop loss. I have left it on the Default value which I believe works best
This strategy performs best on the Binance listings

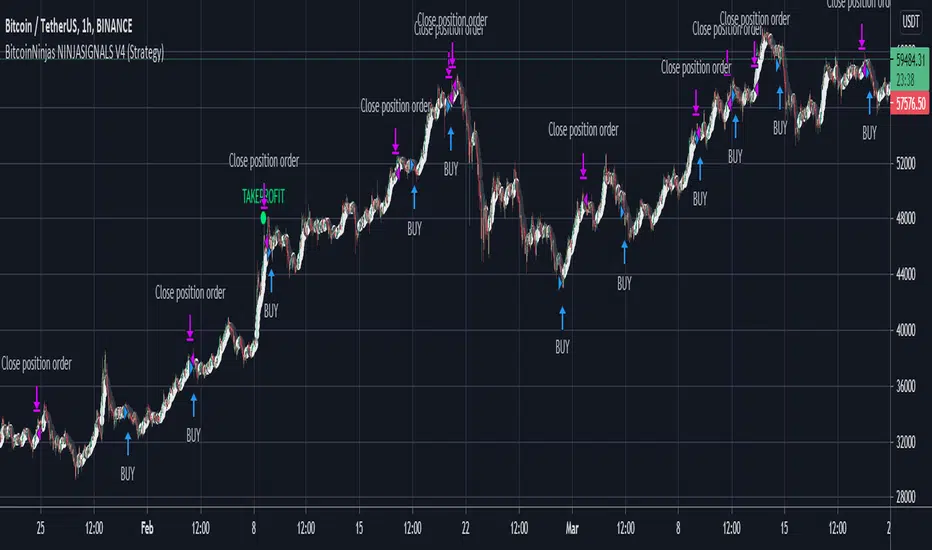
BitcoinNinjas NINJASIGNALS V4 (Strategy)BitcoinNinjas NINJASIGNALS V4 (Strategy)
(for Cryptocurrencies, Forex, GunBot, ProfitTrailer, Autoview, CryptoHopper, manual or automated trading, and more)
This is version 4 of our Ninja Signals trading script, with accompanying backtesting strategy.
BitcoinNinjas NINJASIGNALS V4 (Script)
•Allows users to easily set automated buy/long and sell/short alerts on TradingView for use with automatic and manual trading of cryptocurrencies, Forex securities, and more (alerts are compatible with automatic trading software such as GunBot, ProfitTrailer, Autoview, CryptoHopper, and more).
•Synthesizes many powerful indicators [e.g., Relative Strength Index (RSI), Stochastic RSI, Money Flow Index (MFI), Moving Average Convergence Divergence (MACD), etc.) into one powerful script to generate very precise buy and sell signals in virtually all market conditions.
•Features user-defined adjustable calibration settings, allowing traders to customize the script to fit any currency / security on any exchange available through TradingView.com, simply by adjusting settings.
•Buy/Long arrows, Sell/Short arrows, & EMA trendline can be customized or hidden, if desired.
•Complete with backtesting strategy version of script which allows users to test various trading strategies based on the alerts the script generates (see information and screenshots below).
•Backtesting strategy features a user-defined adjustable date range, so traders can estimate performance of the script over specific periods of time, such as the last week, month, or year.
•Script and backtesting strategy feature many user-adjustable settings including stop loss and take profit alerts, an ‘only sell for profit’ option (Gunbot-specific), many different buy and sell filters, and more. Simply adjust the script settings and the backtesting results will automatically refresh.
•Backtesting strategy allows for pyramid buying to test various average down / dollar cost average trading strategies. Simply adjust the number of pyramid buys and the quantity of each buy.
•Fully compatible with margin and futures trading for any currency / security on TradingView.com.
DISCLAIMER: By using our BitcoinNinjas ‘Ninja Signals’ planning script, you agree to the BitcoinNinjas 'Terms of Use'. No sharing, copying, reselling, modifying, or any other forms of use are authorized for our documents, script / strategy, and the information published with them. This informational planning script / strategy is strictly for individual use and educational purposes only. This is not financial or investment advice. Investments are always made at your own risk and are based on your personal judgement. BitcoinNinjas is not responsible for any losses you may incur. Please invest wisely.
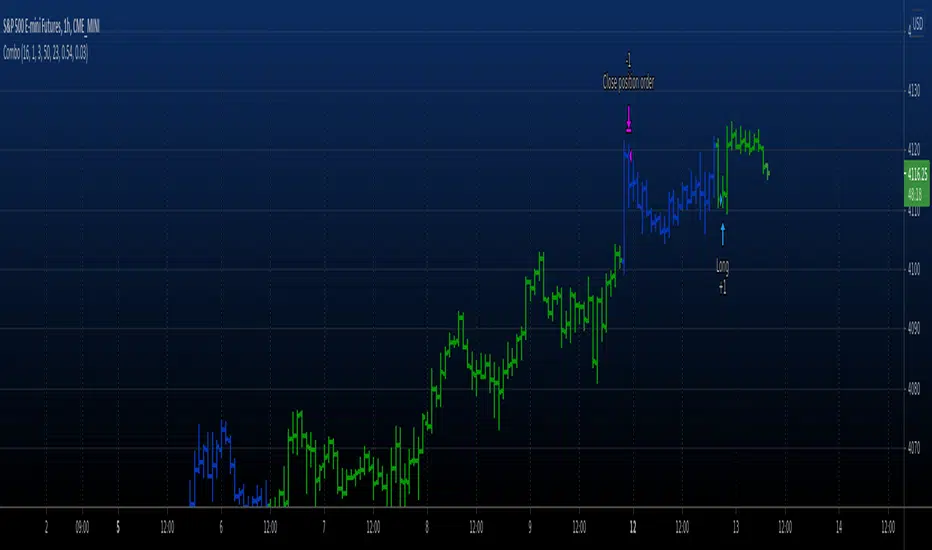
(IK) Stoch-60-15This strategy uses 60 minute and 15 minute stochastic data to determine entry and exit; it only executes long trades. I've only used this on BTC/USD, but I imagine the concepts employed should hold for any ticker
The script builds a simple Stochastic indicator for the current timeframe, and it also plots a single stochastic line for a higher resolution time frame. I've found good results trading on 15 minutes with a 60 minute higher resolution.
We enter a trade if the higher resolution stochastic is in an uptrend, if the current resolution stochastic is in an uptrend, and if the current stochastic value is less than 50.
We exit a trade when the current stochastic value crosses below 80 or the trailing stop loss is hit.
Stop loss is calculated with the input value, Stop Loss Percent. This value represents the percent of capital you're willing to lose before exiting a trade. A stop loss percent of 0.050 means your trade will exit if it falls 5% from the highest high since entering a trade. You will have at least 95% of your original capital left. There is no option to change a trailing stop loss to a set stop loss (in order to keep the code as simple as possible), however, you can turn it off by setting Stop Loss Percent to 1.
I tried to keep the script itself lightweight and very easy to understand, so it's not very customizable in regards to input options. You can change stochastic data, as well as the trailing stop percentage. The script can be adjusted to other timeframes, however this requires a small change in the code (details in script comments). Changing just the "Higher Resolution" input will not produce expected results
My hope is that by keeping it lightweight and simple, it will be easier for you to adjust to your specific needs, or work into a larger strategy.

RSI+PA+DCA StrategyDear Tradingview community,
This RSI based trading strategy is created as a training exercise. I am not a professional trader, but a committed hobbyist. This not a finished trading strategy meant for trading, but more a combination of different trading ideas I liked to explore deeper. The aim with this exercise was to gain more knowledge and understanding about price averaging and dollar cost averaging strategies. Aside that I wanted to learn how to program a pyramiding strategy, how to plot different order entry layers and how to open positions on a specific time interval.
In this script I adapted code from a couple of strategy examples by Coinrule . Who wrote simple and powerful examples of RSI based strategies and pyramiding strategies.
Also the HOWTO scripts shared by vitvlkv were very helpful for this exercise. In the script description you can find all the sources to the code.
A PA strategy could be a helpful addition to ease the 'stress-management to buy when price drops and resolution in selling when the price is rising' (Coinrule).
The idea behind the strategy is fairly simple and is based on an RSI strategy of buying low. A position is entered when the RSI and moving average conditions are met. The position is closed when it reaches a specified take profit percentage. As soon as the first the position is openend multiple PA (price average) layers are setup based on a specified percentage of price drop. When the price crosses the layer another position with somewhat the same amount of assets is entered. This causes the average cost price (the red plot line) to decrease. If the price drops more, another similar amount of assets is bought with another price average decrease as result. When the price starts rising again the different positions are separately closed when each reaches its specified take profit. The positions can be re-openend when the price drops again. And so on. When the price rises more and crosses over the average price and reached the specified take profit on top of it, it closes all the positions at once and cancels all orders. From that moment on it waits for another price dip before it opens a new position.
Another option is to activate a DCA function that opens a position based on a fixed specified amount. It enters a position at the start of every week and only when there are already other positions openend and if the current price is below the average price of the position. Like this buying on a time interval can help lowering the average price in case the market is down.
I read in some articles that price averaging is also called dollar cost averaging as the result is somewhat the same. Although DCA is really based on buying on fixed time intervals. These strategies are both considered long term investment strategies that can be profitable in the long run and are not suitable for short term investment schemes. The downturn is that the postion size increases when the general market trend is going down and that you have to patiently wait until the market start rising again.
Another notable aspect is that the logic in this strategy works the way it does because the entries are exited based on the FIFO (first in first out) close entry rule. This means that the first exit is applied to the first entry position that is openend. In other words that when the third entry reaches its take profit level and exits, it actually exits the first entry. If you take a close look in the 'List of Trades' of your Strategy Tester panel, you can see that some 'Long1' entries are closed by an 'Exit 3' and not by an 'Exit 1'. This means that your trade partly loses, but causes a decrease in average price that is later balanced out by lower or repeated entering and closing other positions. You can change this logic to a real sequential way of closing your entries, but this changes the averaging logic considerably. In case you want to test this you need to change, in this line in the strategy call 'close_entries_rule = "FIFO"', the word FIFO to ANY.
In the settings you can specify the percentage of portfolio to use for each trade to spread the risk and for each order a trading fee of 0.075% is calculated.

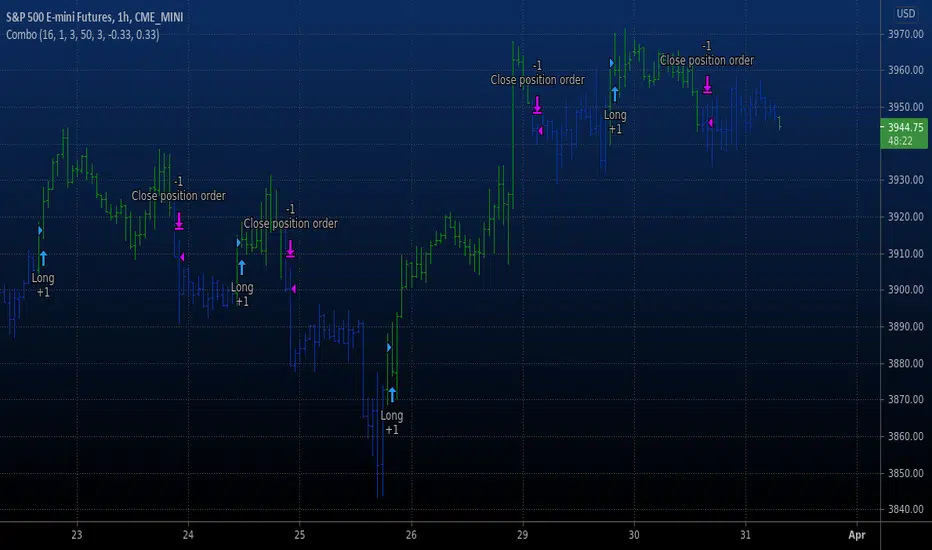
MACD BTC Long/Short Strategy v1.0This strategy will use only default MACD with Simple MA(Signal Line) mode 'ON' to determine when it's time to long/short using its histogram value.
Current version has 2 more entries added to increase more trades and profits along the way while maintaining low 'max drawdown' and high returns.
Entry will be opened when macd line(blue) crossed with signal line(red).
Entry will be closed when histogram increased/decreased opposite its previous histogram.
Re-enter will opened a position when histogram continues after X delay (Re-enter Delay setting).
Sculp will opened a position when histogram is still in light colors for X delay (Sculp Delay setting).

Combo Backtest 123 Percent change bar This is combo strategies for get a cumulative signal.
First strategy
This System was created from the Book "How I Tripled My Money In The
Futures Market" by Ulf Jensen, Page 183. This is reverse type of strategies.
The strategy buys at market, if close price is higher than the previous close
during 2 days and the meaning of 9-days Stochastic Slow Oscillator is lower than 50.
The strategy sells at market, if close price is lower than the previous close price
during 2 days and the meaning of 9-days Stochastic Fast Oscillator is higher than 50.
Second strategy
This histogram displays price or % change from previous bar.
WARNING:
- For purpose educate only
- This script to change bars colors.
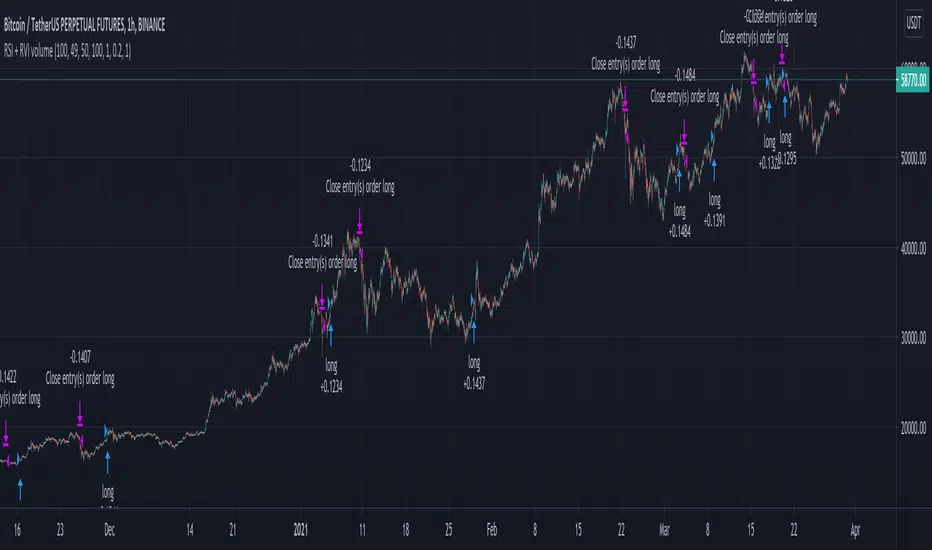
RSI and RVI on volume crypto BTC This strategy combine special version of RSI and RVI , where in this case , I am using the volume , for measuring the speed and change of volume to the price both up and down size together with the volatility spikes.
In this case instead of looking at the volume or volatility, I am combining them into one oscillator.
For best usage, I believe a big length of candles like 100 can get better results, and use it in this way as a lagging indicator.
Since most of the tests I made for futures, I applied a risk management in % of the price movement. For stop loss we have 20% while for TP, 100%. However in both cases, we will exit sooner, and thats going to be when condition from the oscillator says so.
For this we have a middle level, 50, which will act as both overbought and oversold areas.
At the same time I apply the posibility of using leverage into size calculations for more precise tests and try to get min-max out of it.
If you have any questions, please let me know !
Volume RSI Crypto This is a special version RSI, in this case , I am using the volume, which is measuring the speed and change of volume to the price both up and down size.
Volume RSI attempts to gauge price trend changes via changes in bullish and bearish movements.
Its formula is :
VoRSI = 100 - 100 / (1 + VoRS)
where VoRS is Volume Relative Strength over specified period which is calculated as a ratio between averages of Up-Volumes and Down-Volumes:
VoRS = (Average Up-Volume) / (Average Down-Volume)
The logic for this strategy is simple
We entry long when we have a crossover with the Overbought level and we entry short when we have a crossunder with oversold level.
If you have any questions, please let me knw !
