[TVExtBot]Volatility Breakout Plus Strategy(BackTest)It is based on the legendary trader Larry R. Williams' volatility breakout strategy.
The volatility breakout strategy is a short-term trading strategy that realizes rapid profits on a daily basis, following the upward trend of a strong upward trend that exceeds a certain level on a daily basis.
The Volatility Breakout Plus strategy is a strategy modified to a long-term trend by supplementing the existing Volatility Breakout strategy.
변동성 돌파 전략이란 전설적인 트레이더 래리 윌리엄스(Larry R. Williams)의 변동성 돌파 전략을 기본으로 개발한 전략입니다.
변동성 돌파 전략은 일일 단위로 일정 수준 이상의 범위를 뛰어넘는 강한 상승세를 돌파 신호로 상승하는 추세를 따라가며 일 단위로 빠르게 수익을 실현하는 단기매매 전략입니다.
이번 출시하는 변동성 돌파 플러스 전략은 기존 변동성 돌파 전략을 보완하여 장기 추세로 수정한 전략입니다.
※특징으로는 선물보다는 현물차트에 더 효과적입니다.
기본적인 설정은 기존 변동성 돌파 전략과 동일하고 장기 추세에서의 리스크를 줄이기 위해 익절과 손절 기능을 추가하였습니다.
Default Options(기본설정)
Slippage (슬리피지) : 3
Leverage (레버리지) : 1
BackTest Period (백테스트 기간) : 2018/01/01 ~ 2021/03/14
BeforeDay Open-Close Volatility (%) (전날 시가종가 변동률) : 6%
StopLoss (%) (손절) : 6%
TakeProfit (%) (익절) : 30%
Commission (거래수수료) : 0.06%
M-oscillator

Strange RSI (sRSI) Backtesting strategyThis is the backtesting strategy module for my Strange RSI (sRSI) oscillator. The main scheme is grounded on setting up a long strategy for RSI crossing above a certain number, and shorting when RSI crosses below a certain number. This module allows you to:
*change these crossing thresholds
*change the Take Profit limits for long and short strategies
*change the RSI length
In this way, you may optimize to the parameters which fit best to your goals.

Cyatophilum Strategy BuilderAn indicator to create strategies, backtest and setup alerts.
The user can choose one or multiple TA entry conditions, if more than one the conditions are combined with a logical AND.
The entries will open up a trade, which is then handled by a risk management system including Trailing Stop, Take Profit and up to 100 Safety Orders.
This indicator can be used to backtest 3commas DCA bots who are using TA presets, RSI or ULT.
Its main goal is to create strategies by combining indicators.
Let's dive into the details of what's included:
Entry Condition: MACD
Triggers an entry when macd crosses with the signal line.
Configure the fast, slow length, signal smoothing and timeframe to trigger the condition.
Entry Condition: RSI
Triggers an entry when the RSI is higher or lower than the long/short threshold.
Configure the length, timeframe, long and short threshold to trigger the condition.
Entry Condition: ULT (Ultimate Oscillator)
Triggers an entry when the ULT is higher or lower than the long/short threshold.
Configure the 3 lengths, timeframe, long and short threshold to trigger the condition.
Entry Condition: Bollinger Bands
Triggers an entry when the price is above the upper band for long and below the lower band for short.
Configure the length, standard deviation and timeframe to trigger the condition.
Entry Condition: MFI (Money Flow Index)
Similar to RSI, it triggers an entry when the MFI is higher or lower than the long/short threshold.
Configure the length, timeframe, long and short threshold to trigger the condition.
Entry Condition: CCI (Commodity Channel Index)
Another oscillator that triggers an entry when its value is higher or lower than the long/short threshold.
Configure the length, timeframe, long and short threshold to trigger the condition.
Trend Filters
Use one or two trendlines to filter your trades: go only long/short when the trendline is bullish/bearish.
Choose between the several trendlines: ema, sma, wma, hull ma, kama, alma, rma, swma, vwma, Tilson T3, and the unique Adaptive T3 and Adaptive Hull MA.
If this is not enough, you can use the external trendline feature to plug in any other indicator for your trendline.
The second trendline can be MTF and come from another symbol if needed.
Combining Indicators
Most of the time we will not be using a single indicator at a time, but instead, combine them in order to get stronger entries.
The entry conditions are combined using a AND logical gate, meaning all conditions must be true for the entry to trigger.
Here is an example using a combination of 2 indicators: Bollinger Bands and RSI.
We can see less entries are being triggered on the bottom chart than on the top chart because the bottom chart is combining the 2 indicators while the top chart is only using Bollinger Bands.
You can combine up to all 6 indicators if you want, but keep in mind that combining too many may lead to triggering no entry at all.
Risk Management and Trade system
The indicator will not trigger more than one long or short entry in a row.
To start a new trade, the indicator will wait for either take profit, stop loss or an opposite entry if no SL and TP is set.
Stop Loss and Take Profit
Configure your stop loss and take profit for long and short trades.
You can also make a trailing stoploss and a trailing take profit.
Safety Orders
Just like 3commas bots, you can create a strategy with up to 100 safety orders.
Configure their placement and order size using the price deviation, step scale, take profit type (from base order or total volume), and volume scale settings.
Note: only the 20 first safety order steps or so will be plotted due to graphic limiations. The steps after that still trigger alerts and backtest results.
Creating Alerts
The indicator is using the newest alert system:
1. Write your alert messages in the indicator settings (alert section at the bottom)
2. Click "Create Alert" as usual, but choose "alert() function calls only"
Data Window
Since the indicator is applied on top of the price chart, the oscillator indicators cannot be plotted. You can always add them on another pane but if you want to just see their values, you can use the Data Window to see the value of each oscillator on each bar.
Backtest settings
Used to get the results below:
Initial Capital: 100 000$
Base Order Size: 0.1 contract (BTC)
Safety Order Size: 0.1 contract (BTC)
Commission: 0.1%
Slippage: 100 ticks
pyramiding: 6
The indicator settings are plotted in the main chart panel.

TRSI STRATEGYThis strategy is based on our very first indicator TRSI .
Which is at the same time made of TRIX, RSI and EMA indicators.
Use TRSI to see how the strategy and indicator behaves on your chart.
Make sure to use the same values on strategy and indicator options.
Entry conditions
Buy and sell signals are generated when TRSI's lines cross above and below 60 and 40 line levels.
Buy - TRSI line crosses over its EMA line above 60 horzontal line
Sell - TRSI line crosses under its EMA line below 40 horzontal line
Close position when lines cross in backwards direction
Recommendet timeframe - 60 min.
Default values (for BTC):
TRIX - 14
RSI - 6
EMA -6
Top line - 60
Bottom line - 40
Supplementary indicators
In options menu of the strategy you may switch on two EMA and bollinger bands indicators to
make extra decision while analysign your chart. Useful if you have limitation on indicator quantity on the chart.
Repaint
The strategy doesn't use lookehead and time security functions.
The entries are generated on confirmation of bar close.
------------------------------------------------------------------------------------------------------------------------------------------
Данная стратегия основана на одном из наших первых индикаторов TRSI ,
который в свою очередь был сделан из трех других индикаторов TRIX, RSI, EMA.
Используйте TRSI на графике чтобы визуально понять как индикатор и стратегия ведут себя.
Используйте одинаковые параметры в индикаторе и в стратегии.
Вход в позицию
Сигналы на покупку и продажу генерируются при пересечении линий TRSI над и под уровнями 60 и 40.
Покупка - линия TRSI пересекает сверху вниз свою EMA над уровнем 60.
Продажа - линия TRSI пересекает снизу верх свою EMA под уровнем 40.
Закрытие позиции при обратном пересечении линий.
Рекомендуемый таймфрейм - 60 минут.
Настройки по умолчанию (для BTC):
TRIX - 14
RSI - 6
EMA -6
Top line - 60
Bottom line - 40
Дополнительные индикаторы
В настройках стратегии можно включить две EMA и полосы боллинджера для дополнительного анализа
при принятии решения входа в позицию. Полезно если у вас ограничение на количество одновременных индикаторов на графике.
Репэйнт
В стратегии не использованы lookahead и временные security функции, которые могут привести к репэйнту.
Входы в позицию генерируются по подтверждению закрытия бара.

Williams Alligator + RSI + T3CCIWilliams Alligator strategy is based on indicator developed by a legendary trader Bill Williams, an early pioneer of market psychology.
The strategy is based on a trend-following Alligator indicator, which follows the premise that financial markets and individual securities trend just 15% to 30% of the time while grinding through sideways ranges the other 70% to 85% of the time. Williams believed that individuals and institutions tend to collect most of their profits during strongly trending periods.
Although Alligator is a very strong tool it has a lot of weak signals and has lag span on entries and exits. We added RSI oscillator and T3CCI to clear market noises and weak signals. Moreover the approach we intoduced to the indicator allows to enter positions and close them earlier than orginal indicator which ensures stronger signals
The strategy supports traditional and cryptocurrency spot, futures, options and marginal trading exchanges. It works accurately with BTC, USD, USDT, ETH and BNB quote currencies. Best to use with 1D timeframe charts
The strategy can be and should be configured for each particular asset. You can change filters and risk management settings to receive the most advanced accurate alerts
Advantages of this script:
Good for long and Short positions
Produces strong long-term entries and closures of positions
Stable to short-term market fluctutions
Easy configuration with a user friendly interface
Backtests show high accuracy around 85.71%
High Net Profit percentage around 21.26%
High profit factor around 82.403
How to use?
1. Apply strategy to the trading pair your are interested in at 1D timeframe chart
2. Configure the strategy: change filters values and risk management settings until Strategy tester shows good results according to mathematical expectation
3. Set up a TradingView alert to trigger when strategy conditions are met
4. Strategy will send alerts when to enter and when to exit positions
Feel free to copy and use this script for your ideas and trading!

ATR + %R Scalping StrategyThe Average True Range is a single line indicator that measures volatility. The indicator was originally developed by J. Welles Wilder to measure the volatility of commodities within the futures market.
ATR does not measure price trends or price direction hence %R and Parabolic SAR indicators were added.
The strategy enhances standard Average True Range and %R composition with trend confirmation and filters which clear out market noises and manipulations from triggers.
The strategy supports traditional and cryptocurrency spot, futures, options and marginal trading exchanges. It works accurately with BTC, USD, USDT, ETH and BNB quote currencies. Best to use with 5 and 15 minutes timeframe charts and Limit orders.
The strategy can be and should be configured for each particular asset. You can change filters and risk management settings to receive the most advanced accurate alerts
Advantages of this script:
Strategy has high profit factor around 30.32
Backtests show high accuracy around 91.18%
High Net Profit percentage
Low Drawdowns
Weak signals are filtered
Dynamic Take profit and Stop loss
Fast deals around 50 minutes per trade
Can be applied to any market and quote currency
Easy to configure user interface
How to use?
1. Apply strategy to the trading pair your are interested in at 5m or 15m timeframe chart
2. Configure the strategy: change filters values and risk management settings until Strategy tester shows good results according to mathematical expectation
3. Set up a TradingView alert to trigger when strategy conditions are met
4. Strategy will send alerts when to enter and when to exit positions

Combo Backtest 123 Reversal & Money Flow Indicator This is combo strategies for get a cumulative signal.
First strategy
This System was created from the Book "How I Tripled My Money In The
Futures Market" by Ulf Jensen, Page 183. This is reverse type of strategies.
The strategy buys at market, if close price is higher than the previous close
during 2 days and the meaning of 9-days Stochastic Slow Oscillator is lower than 50.
The strategy sells at market, if close price is lower than the previous close price
during 2 days and the meaning of 9-days Stochastic Fast Oscillator is higher than 50.
Second strategy
Indicator plots Money Flow Indicator (Chaikin). This indicator looks
to improve on Larry William's Accumulation Distribution formula that
compared the closing price with the opening price. In the early 1970's,
opening prices for stocks stopped being transmitted by the exchanges.
This made it difficult to calculate Williams' formula. The Chaikin
Oscillator uses the average price of the bar calculated as follows
(High + Low) /2 instead of the Open.
The indicator subtracts a 10 period exponential moving average of the
AccumDist function from a 3 period exponential moving average of the
AccumDist function.
WARNING:
- For purpose educate only
- This script to change bars colors.

Trend Daddy Bitcoin Strategy - Optimized For Automated TradingOverview:
This algorithm is the end result of years of trading both bitcoin and traditional markets. Over the years I've learned that trying to catch a top or bottom of a move is nearly impossible and results in a lot of pain. Instead, I've learned the money is made somewhere in the middle trading the momentum. That is how I came up with the Trend Daddy algo. Combining multiple different indicators, this script is able to pick up on large trending moves while at the same time avoiding sideways chop.
Signals:
The signals this algorithm produces are simple long and short signals. Keep in mind, this script will NOT attempt to short the top of the market nor will it attempt to catch knives. The signals that are thrown out attempt to play the momentum of the market, not reversals. Always wait for a candle to confirm in order to enter a trade.
Time Frame:
Bitcoin markets are extremely volatile and it is not recommended using this script on any time frame lower than 4 hours, with daily or above being the recommended time frame.
Backtesting:
I have run hundreds of backtests on this algorithm but also keep in mind that backtests do not show future results. I try to be as realistic in my backtests and do not account for any compounding. In the published backtest I ran an account size of $10k USD, only trading $10k USD per trade with no compounding. With this extremely conservative strategy, from day one of Bitcoin being listed on an exchange, this strategy would return roughly 1535% or $15,351 over the past 9 years.
Disclaimer:
Trading in any markets, especially cryptocurrencies involves taking on a great magnitude of risk. Do not trade any money that you are not willing to lose. Furthermore, past performance does not guarantee future results. The best trading device is your mind. Hopefully, this algorithm is the next best thing.

Combo Backtest 123 Reversal & Modified Price-Volume Trend This is combo strategies for get a cumulative signal.
First strategy
This System was created from the Book "How I Tripled My Money In The
Futures Market" by Ulf Jensen, Page 183. This is reverse type of strategies.
The strategy buys at market, if close price is higher than the previous close
during 2 days and the meaning of 9-days Stochastic Slow Oscillator is lower than 50.
The strategy sells at market, if close price is lower than the previous close price
during 2 days and the meaning of 9-days Stochastic Fast Oscillator is higher than 50.
Second strategy
The related article is copyrighted material from
Stocks & Commodities.
WARNING:
- For purpose educate only
- This script to change bars colors.

Combo Backtest 123 Reversal & MASS Index This is combo strategies for get a cumulative signal.
First strategy
This System was created from the Book "How I Tripled My Money In The
Futures Market" by Ulf Jensen, Page 183. This is reverse type of strategies.
The strategy buys at market, if close price is higher than the previous close
during 2 days and the meaning of 9-days Stochastic Slow Oscillator is lower than 50.
The strategy sells at market, if close price is lower than the previous close price
during 2 days and the meaning of 9-days Stochastic Fast Oscillator is higher than 50.
Second strategy
The Mass Index was designed to identify trend reversals by measuring
the narrowing and widening of the range between the high and low prices.
As this range widens, the Mass Index increases; as the range narrows
the Mass Index decreases.
The Mass Index was developed by Donald Dorsey.
WARNING:
- For purpose educate only
- This script to change bars colors.

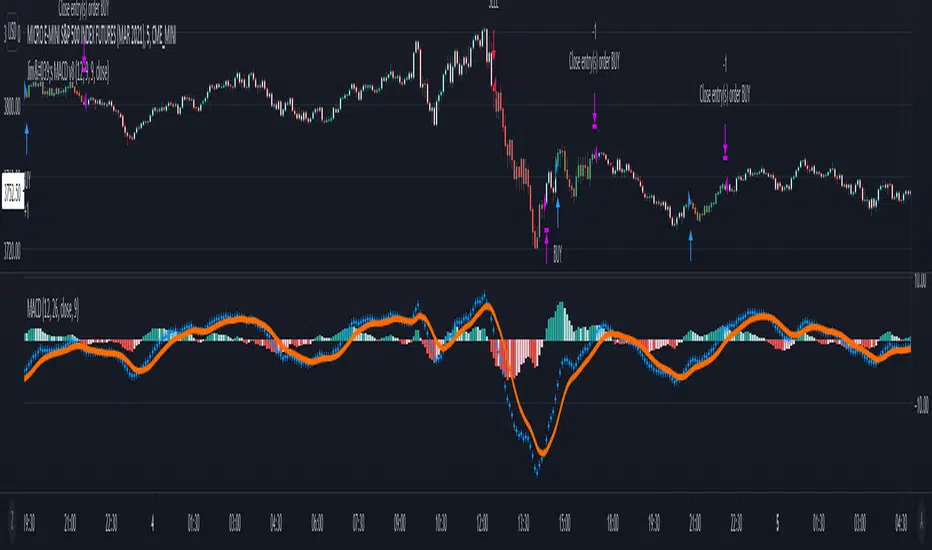
Jim's MACDMACD Buy/Sell Strategy
Filters bearish crossovers above the 0 line and bullish crossovers below.
Uses 34 ema to further filter the trades and take only longs above and only shorts below.
Apply at least 2:1 risk to reward ratio to account for losing trades.
Trade at own risk!
RSI Classic Strategy (by Coinrule)One of the questions hobbyist traders more often ask is: what is the perfect trading indicator?
Every indicator is just a tool, so its efficiency is proportional to your ability to read its signals and translate them into an actionable trading strategy. The RSI is likely the most flexible and easy to use among the technical indicators.
This trading strategy tries to catch short-term swings on the coins of your choice with a simple yet profitable setup.
Buy when the RSI is lower than 30 (you can adjust it to 35 in times of steep uptrend).
Sell when the RSI is greater than 65 (the target may range between 60 and 75 depending on the volatility of the coin).
Note that the buy signal comes when the indicator crosses below 30 and not when it crosses above 30 as it happens on the built-in RSI strategy on Tradingview.
The present script overperforms the built-in strategy, even adding trading fees and using a lower amount of capital for each trade (30%). That means that the system can deliver higher net-profits with lower risk levels.
A typical example of market conditions where this strategy works perfectly is as follows.
The first initial breakout indicates that a new leg up in the trend may start. Bitcoin starts to trade within a range which you can identify when it reaches the point 3. That is the perfect time to start the rule because
- trading within a channel anticipates possible swings up and down
- the trend is on the upside, providing low downside risk in buying the dips.
This strategy works well with selected coins of your choice, and it's a great fit on leverage exchanges like Binance Futures.
If you prefer to run it across all available coins on the market, instead, you may choose an optimized version.

ATH Oscillator StrategyThis idea stems from the belief that people want to reverse the trend when an all time high or low is hit. This strategy incorporates that by using ath and atl values based on the lookback period and the signal gets smoothed by the input smoothing type and length. I found that the best time to use this was on the 3m chart. But I am certain that higher time frames can be used if the settings are tweaked.
Settings:
Strategy -
simple(long,short,switch) - This strategy just uses the directional change of the signal using just longs, just short, or switching between the two.
range - This strategy uses the hlines on the chart to determine when to buy and sell. These can be adjusted using the Range Top / Bot values
div - This strategy uses a simple divergence of the signal line to time entries
Lookback - How many bars back to check the ath and atl
Smoothing - How smooth you want the signal
Smoothing Type - Different ways to smooth the signal
Range Top/Bot - Changes the height of the hlines for the range strategies
On Buy/Sell Signal # - Change when you enter. Increasing this number will move the signals to the left if there are consecutive signals. Useful to find bottoms and tops.
Chart: ETHUSD Perp Bybit
Strategy Properties: 100 base order, 100% equity
Notes: Use on 3-5m time frame for best results. Change settings if you want to try other coins like BTC or higher time frames

Combo Backtest 123 Reversal & Martin Pring's Special K This is combo strategies for get a cumulative signal.
First strategy
This System was created from the Book "How I Tripled My Money In The
Futures Market" by Ulf Jensen, Page 183. This is reverse type of strategies.
The strategy buys at market, if close price is higher than the previous close
during 2 days and the meaning of 9-days Stochastic Slow Oscillator is lower than 50.
The strategy sells at market, if close price is lower than the previous close price
during 2 days and the meaning of 9-days Stochastic Fast Oscillator is higher than 50.
Second strategy
Pring's Special K is a cyclical indicator created by Martin Pring.
His method combines short-term, intermediate and long-term velocity
into one complete series. Useful tool for Long Term Investors
Modified for any source.
WARNING:
- For purpose educate only
- This script to change bars colors.
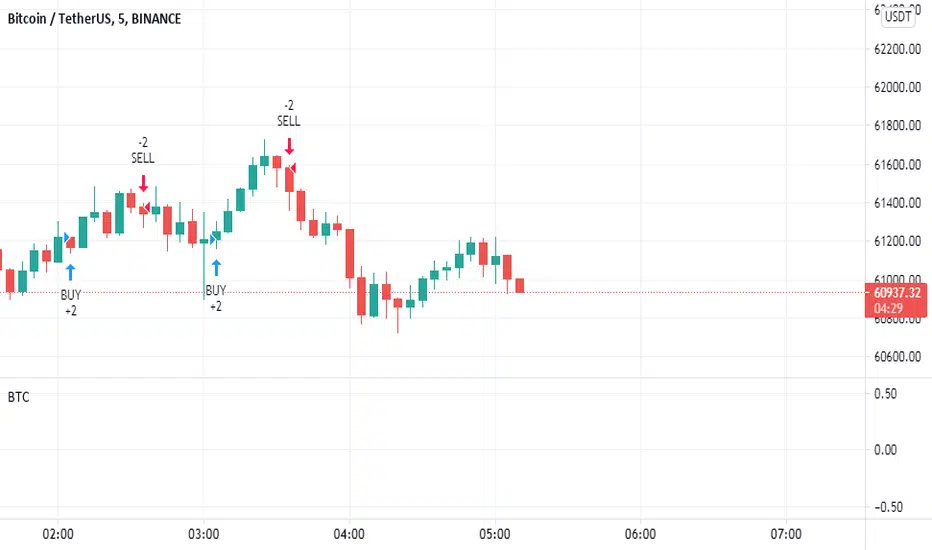
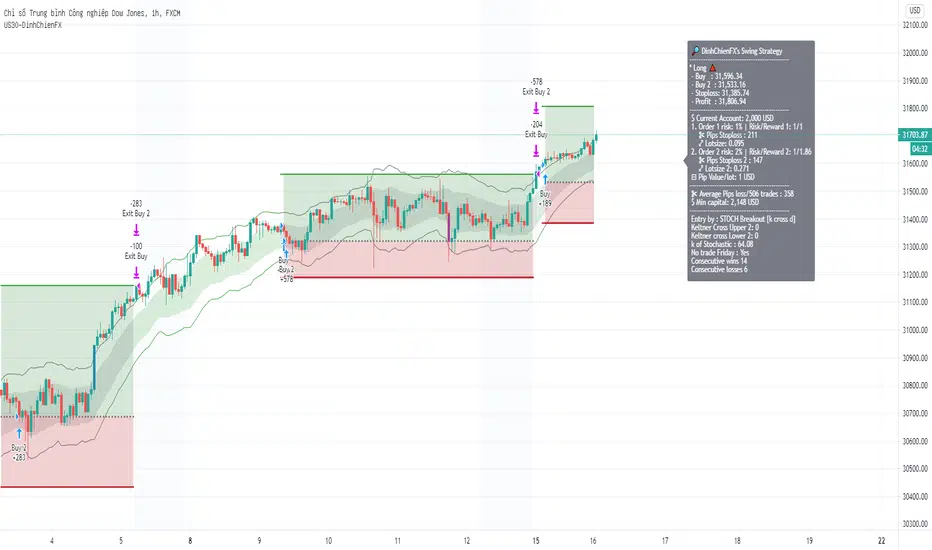
US30-DinhChienFX Swing [2 orders]Keltner basis: 20 | trend identification: Keltner Upper/Lower 2 | entry: Stochastic breakout k cross d | Stoploss: 2, Profit: 2 |
The strategy finds the rule in 4 years, every year, every quarter. The ratio of risk/reward 1/1 to give the success percentage over 55%.
Makes a second order has a better ratio. US30''s risk/reward: 1/1.86.
Look the right label: that rule has 14 times consecutive wins and 6 times consecutive losses in history.
-----------
+ A Long trend is when the price close & crossover the Keltner Upper 2 + k value of Stochastic indicator crossover 80.
+ A Short trend is when the price close & crossunder the Keltner Lower 2 + k value of Stochastic indicator crossunder 20.
+ to Entry when k value ( Stoch indicator) make correction and cross the d value ( Stoch indicator)
- Buy: d > 70
- Sell: d < 17
*** Use the link below to obtain access to this indicator
Buy and Hold entry finder StrategyHello everyone!
I proudly present the backtest Strategy Script for my "Buy and Hold entry finder" Script.
It basically shows you the outcome, if you would use my indicator in the past.
The buy signals are limited to 1 order per month.
Order Size: Allows you to choose, how much money you want to invest per month. (Please consider, it will only invest an x amount per Order, but it will not stack the amount you did not invest in an previous month ) (Example in my indicator)
Pyramiding: Just regulates, how often you can open an position.
Commission: Here you can set how much it will cost to open an position at your broker.
I coded a feature that allows you to set a Start Date and an End Date for your backtest. In the end of the backtest the script closes all positions.
If you got any question, feel free to ask in the comments or send me a message.
Sincerely, RS Titan.

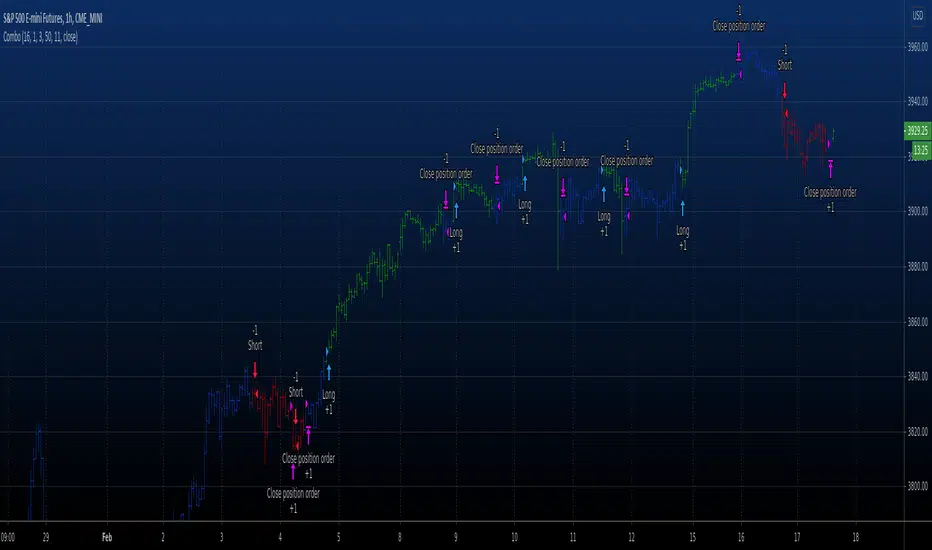
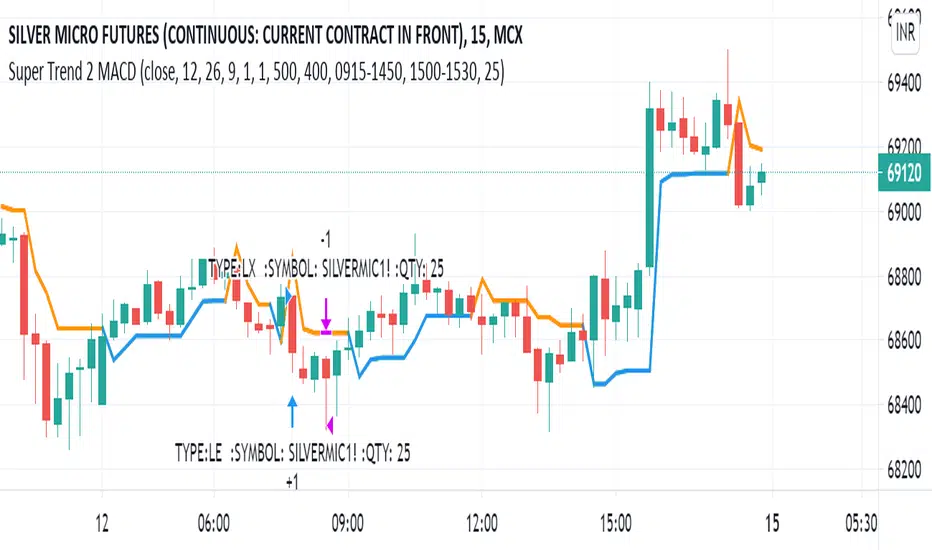
Super Trend 2 MACD pk singhalYou can automate complete strategies, and not just indicators using the TradingView free version. That’s right! explore 1000s of strategies from public library using free Tradingview and free APIBridge (paper trading). We will demonstrate this using SuperTrend strategy (not SuperTrend indicator).
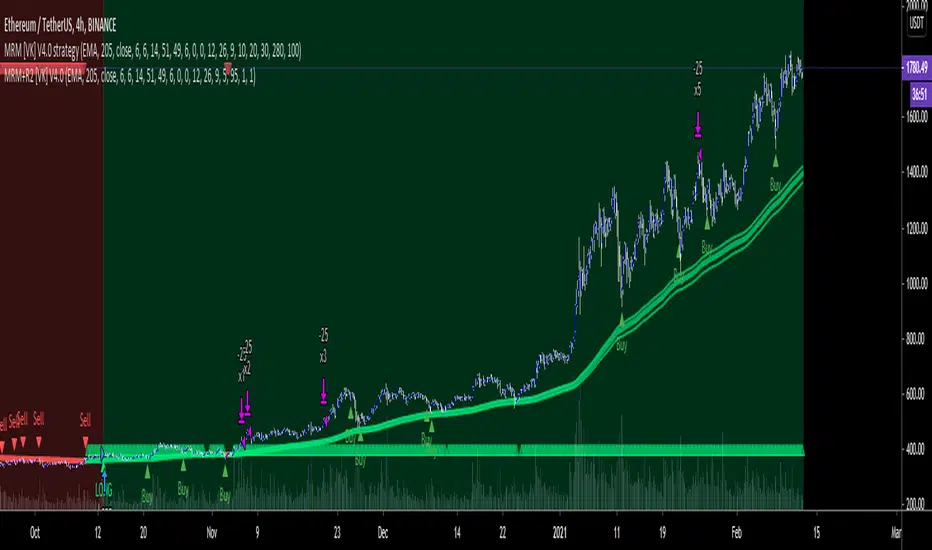
MRM [VK] V4.0 strategyMRM VK strategy
This strategy uses MA, RSI , MACD combined.
MACD and RSI can be used multi time frame to filter trend.
It is a very simple strategy which goes long/short when MACD , RSI and MA Trend Changes in higher Time Frame.
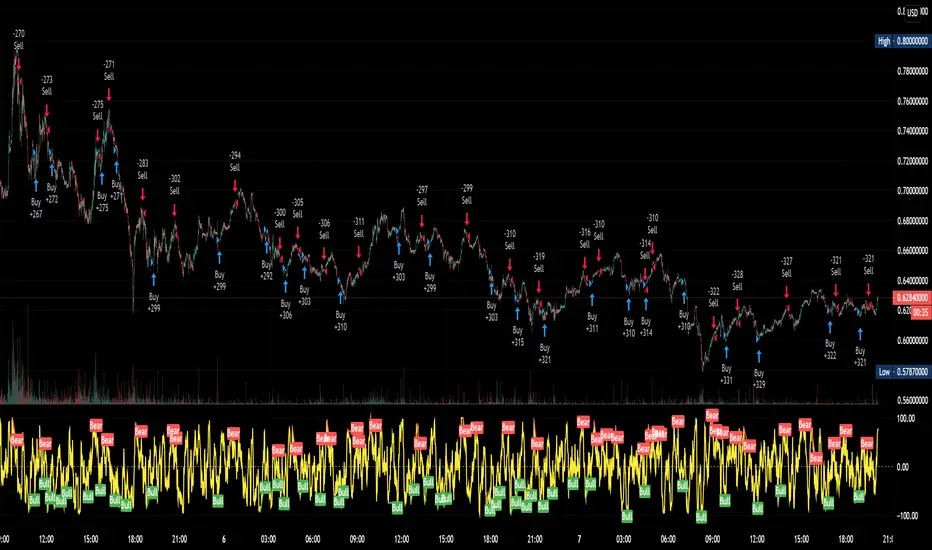
RSI-VWAP Indicator %█ OVERALL
Simple and effective script that, as you already know, uses vwap as source of the rsi, and with good results as long as the market has no long-term downtrend.
RsiVwap = rsi (vwap (close), Length)
The default settings are for BTC in a 30 minute time frame. For other pairs and time frames you just have to play with the settings.
█ FEATURES
• The option to start trading from a certain date has been added.
• To make the profit more progressive, a percentage of your equity is used for entries and a percentage of your position is used for closings.
• The option to trade in Spot mode has been added, since, for the TradingView backtest, the money is infinite and if you do not limit it somehow,
it would offer you much better profits than the live trading.
QuantityOnLong = Spot ? (EquityPercent / 100) * ((strategy.equity / close) - strategy.position_size) : (EquityPercent / 100) * (strategy.equity / close)
• The option to stop the system when the drawdown exceeds the fixed limit has been added.
Drawdown, as you already know, is a very important measure of risk in trading systems.
The maximum drawdown will tell us what the maximum loss of a trading system has been during a period. This maximum loss is determined by:
strategy.risk.max_drawdown(Risk, strategy.percent_of_equity)
• Leverage plotted on labels added.
█ ALERTS
To enjoy the benefits of automatic trading, TradingView alerts can be used as direct buy-sell orders on spot, or long-close orders with leverage.
Currently there are Chrome extensions that act as a bridge between TradingView and your Exchange or Broker.
This is an example of syntax for this type of extensions. Copy and paste a message like this into the alert window:
{{strategy.order.action}} @ {{strategy.order.price}} | e = {{exchange}} a = account s = {{ticker}} b = {{strategy.order.action}} {{strategy.order.alert_message}}
█ NOTE
Certain Risks of Live Algorithmic Trading You Should Know:
• Backtesting cannot assure actual results.
• The relevant market might fail or behave unexpectedly.
• Your broker may experience failures in its infrastructure, fail to execute your orders in a correct or timely fashion or reject your orders.
• The system you use for generating trading orders, communicating those orders to your broker, and receiving queries and trading results from your broker may fail.
• Time lag at various point in live trading might cause unexpected behavior.
• The systems of third parties in addition to those of the provider from which we obtain various services, your broker, and the applicable securities market may fail or malfunction.
█ THANKS
Thanks to TradingView, its Pine code, its community and especially those Pine wizards who post their ideas that helps us to learn.
If the world is heading toward a equitable new world economic order, let's get rich first ...
Happy trading!

Oscillator Evaluator (Analysis tool)Oscillator Evaluator (Analysis tool)
The oscillator evaluator is a tool that will help you analyse and compare the oscillator of your choice to another 2 oscillators.
By selecting the strategy with which you will analyze the oscillators, you will be able to see the behaviour of the oscillators in different aspects.
First there is a moving average increase or decrease strategy, that will give you a good idea of the correlation of the oscillator with the price.
The second is a commom 2 MA crossover strategy, that will give you and idea of the validaty of that oscillator as a strategy or as a trend filter.
The third strategy is a cross over 0 signal, that will go long on a crossover of 0 and short on a crossunder 0. This helps you see how good is the oscillator at evaluating suport and resistance areas and give you an idea of its balance.
The forth strategy is a Buy/Sell on extremes of the oscillator and will let you know how good is your strategy at spotting good places to buy and sell.
The fith strategy is to evaluate how goood the oscillator is as a mean reversion filter or how good it is at spotting small price changes.
The sixth strategy is similar to the last but is focused on how good is the oscillator spotting good places to take profits on trending strategies.
The 6 strategies in the script produce signals from the oscillator and from the oscillator only.
In conclusion this tool can be used to measure your oscillator and see if it really is as good as you think in comparison to others.
This script is not intended to be used as a full strategy but as a tool.

MA Divergences StrategyThis is the Strategy version of the Study I published. It is a Moving Average that can be applied to any plot to plot divergences on any oscillator, as well as perform backtesting. You'll need a REALLY good oscillator to perform live trades using this alone, but I think it is a valuable tool and had the Strategy hanging around and for some reason didn't upload it yet.
So here it is.
Turn Length to 1 to follow the oscillator without lag. Turn Length up if you are getting too many false signals or tweak the original oscillator settings.