ATA v4 StrategyAta strategy is include 3 different time frame = MTF
2 different moving average =MA
Oversold/overbought for relative strength index =RSI
Strategy exit for trailing stop loss %2 =TSL
MTF like 1 day, 4h and 5 min, between 2 moving averages like fibo numbers 21 and 34. Also strategy test for oversold up to 60 and overbought under the 25 with RSI. Stratefy exit include trailing stop loss %2 persantage for max. gain. It was created by XMAXPRO. This system is open to development.
M-oscillator

TheEvilPeanutStrategy'The Evil Peanut Strategy'
Description:
This is a strategy that use breakout for entry and exits. It will close the trade in any direction (long or short) if the indicators are through the roof.
How to use :
Simply follow the signals as confirmations for your trades.
It will take time, but we will make money peanut by peanut with it. =D
Don't hesitate to contact me if you find anything wrong with it or if you have suggestions too add to it.
Happy Trading!

Combo Backtest 123 Reversal & Directional Trend Index (DTI) This is combo strategies for get a cumulative signal.
First strategy
This System was created from the Book "How I Tripled My Money In The
Futures Market" by Ulf Jensen, Page 183. This is reverse type of strategies.
The strategy buys at market, if close price is higher than the previous close
during 2 days and the meaning of 9-days Stochastic Slow Oscillator is lower than 50.
The strategy sells at market, if close price is lower than the previous close price
during 2 days and the meaning of 9-days Stochastic Fast Oscillator is higher than 50.
Second strategy
This technique was described by William Blau in his book "Momentum,
Direction and Divergence" (1995). His book focuses on three key aspects
of trading: momentum, direction and divergence. Blau, who was an electrical
engineer before becoming a trader, thoroughly examines the relationship between
price and momentum in step-by-step examples. From this grounding, he then looks
at the deficiencies in other oscillators and introduces some innovative techniques,
including a fresh twist on Stochastics. On directional issues, he analyzes the
intricacies of ADX and offers a unique approach to help define trending and
non-trending periods.
Directional Trend Index is an indicator similar to DM+ developed by Welles Wilder.
The DM+ (a part of Directional Movement System which includes both DM+ and
DM- indicators) indicator helps determine if a security is "trending." William
Blau added to it a zeroline, relative to which the indicator is deemed positive or
negative. A stable uptrend is a period when the DTI value is positive and rising, a
downtrend when it is negative and falling.
WARNING:
- For purpose educate only
- This script to change bars colors.

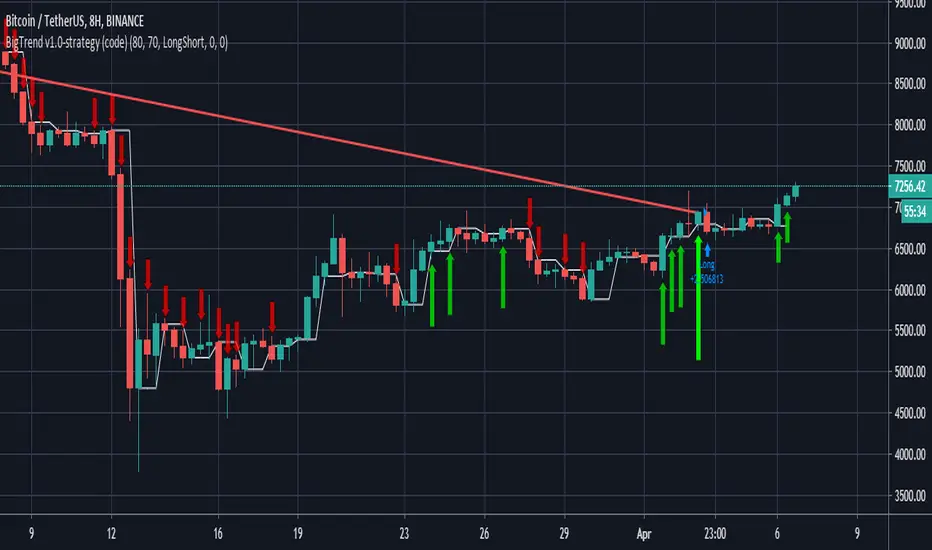
Long/ Short with Big Trend v1.0-strategyHello traders,
This script using multi MA and EMA , MACD , RSI ... for vote BUY or SELL.
If 80% signal vote for BUY, signal Long will been active
or 80% signal vote for SELL, signal Short will been active
Recommend using this script for Trend trader, not using for Scalping trader or Swing trader!
Best backtest in:
- BTC/USDT H8, D1
- LTC/USDT: D1
- ETH/USDT: H8
- BCH/USDT: H2, H4
- LINK/USDT: H8
...
With other symbols and time frame, you can do it yourself.
We are recommend using with min time frame H2 for all symbol or using H8 only.
Setting for backtest:
- Signal %: set percent for active signal. Recommend set 80 for big time frame or 90-95 for small time frame.
- Trade type:
+ LongShort (default): trade Long and Short if you trade with margin account.
+ LongOnly: if you trade with spot account, select Long only for backtest.
+ ShortOnly: if you trade with margin account and like short only.
- Take profit %: close order if profit > this value. Set to 0 for disable this function.
- Stop loss %: close order if profit < this value. Set to 0 for disable this function.
Combo Backtest 123 Reversal & DiNapoli Detrended Oscillator This is combo strategies for get a cumulative signal.
First strategy
This System was created from the Book "How I Tripled My Money In The
Futures Market" by Ulf Jensen, Page 183. This is reverse type of strategies.
The strategy buys at market, if close price is higher than the previous close
during 2 days and the meaning of 9-days Stochastic Slow Oscillator is lower than 50.
The strategy sells at market, if close price is lower than the previous close price
during 2 days and the meaning of 9-days Stochastic Fast Oscillator is higher than 50.
Second strategy
DiNapoli Detrended Oscillator Strategy
WARNING:
- For purpose educate only
- This script to change bars colors.

Best Supertrend CCI StrategyHello traders
Someone requested the strategy version of the Supertrend CCI indicator
It's a Supertrend not based on candle close but based on a CCI ( Commodity Channel Index )
How does it work?
Bull event: CCI crossing over the 0 line
Bear event: CCI crossing below the 0 line
When the event is triggered, the script will plot the Supertrend as follow
UP Trend = High + ATR * Factor
DOWN Trend = Low - ATR * Factor
This is an alternative of the classical Supertrend based on candle close being above/beyond the previous Supertrend level.
Hope you'll enjoy it and it will improve your trading making you a better trader
Dave

DPO RMA STRATEGYThis strategy uses tradingview's built-in "Detrended Price Osciilator" ( DPO )indicator script.
It takes the average of 6 different fib lookback periods. (55,89,144,233,377,610)
This is plotted in the purple line.
It then takes the RMA of the DPO and uses the RMA's to determine entry points with crossovers and crossunders.
It's an extremely easy indicator to use. You mostly only need to adjust the last 2 inputs (These are the RMA Smoother inputs)
Works well with most any market and with any timeframe.
Works great on Heiken Ashi if you keep orders under 150. But I can't post in heiken ashi format thanks to automated traders complaining to tradingivew that they can't make any money with heiken ashi candles
And then pine coders like this that are embraced with high regard because they realized that they can spam a heiken ashi chart with over 400 trades and magically it has excessive slippage.

Cyatophilum Intraday Breakouts [BACKTEST]Private indicator. Access can be unlocked by purchasing a subscription on my website which link is in my profile signature.
Here is the backtest version of the Triple Screen Strategy
Recap of the strategy:
The goal of this indicator is to be able to automate and backtest the strategy, all while staying on a single chart and without repainting.
Features:
Market Tide MACD configuration
Market Wave choice between 3 oscillator: Elder Force Index, Stochastic and William Percent Range
Automated Long and Short entries alerts
Integrated Trailing Stop Loss system fully configurable with automated exit alerts
Integrated Trailing Take profit system fully configurable with automated exit alerts
Indicator samples
Backtest
Strategy time period can be choosen in the parameters of the indicator.
Be aware that the chart is limited to 10 000 candles of the current timeframe for the backtest calculation.
Default initial capital: 10 000$
Default order size: 100% of equity
Default commission fees: 0.1% per transaction
Backtest results below.
Alerts
Entry Long: Triggers on green long labels.
Take Profit Long: Triggers on the "TAKE PROFIT" green flag if the long target is reached.
Stop Loss Long: Triggers on the "STOP LOSS" or "TSSL" label if the stop loss line has been crossed.
Exit Long: Triggers on either of Take Profit Long or Stop loss long.
Entry Short: Triggers on red short labels.
Take Profit Short: Triggers on the "TAKE PROFIT" green flag if the short target is reached.
Stop Loss Short: Triggers on the "STOP LOSS" or "TSSL" label if the stop loss line has been crossed.
Exit Short: Triggers on either of Take Profit Short or Stop Loss Short.
You can get access to this indicator by purchasing a subscription using the link below.
Thanks for reading!

IndianPivotBossPivotShiftThis Indicator has to be used as a censorship as under:
Do not go long (STRICTLY) when the following is observed:
(ie, either go short if any other indicator supports or do nothing)
a) If the histogram is lower than the previous histogram; in other words sloping downwards.
Do not go short (STRICTLY) when the following is observed:
(ie, either go long if any other indicator supports or do nothing)
a) If the histogram is higher than the previous histogram; in other words sloping upwards.
This can be used for intraday / swing / positional.
The histogram are constructed from combination of floor pivots. The histogram are different from Pivot based oscillators.
For intraday, select Daily from the parameters and use chart timeframe less than 15 min preferably.
For swing, select Weekly from the parameters and use chart timeframe more than 15 min preferably but less than daily charts.
For positional, select Monthly from the parameters and use daily time frame charts.
It is an effective indicator that potentially prevents you from taking wrong trades.
The computation mechanism of the indicator is confidential as it is proprietary.

Stochastic Pop and Drop by Jake Bernstein v1 [Bitduke]I found a simple strategy by Jake Bernstein, modified it a little and created a strategy with Risk Management System (SL+TP); After that I test it on the different cryptocurrency pairs.
About the Indicator
Basically it's the strategy of 2 indicators: Stochastic Oscillator to define the bias and Average Directional Index to confirm it.
One again, It uses Stochastic Oscillator to define the trading bias. In particular, the trading bias was deemed bullish when the weekly 14-period Stochastic Oscillator was above some default value (in him paper - 50) and rising and vice versa.
Once the trading bias is established, Steckler used the Average Directional Index (ADX) to define a slowdown in the trend. ADX measures the strength of the trend and a move below 20 signals a weak trend.
Modifications
I didn't implement Average Directional Index (ADX) and test just different sources for data, oscillator periods and different levels in relation to the crypto market.
So, it shows good results with two tight thresholds at 55 and 45 level.
The bar chart below the defining the bullish and bearish periods (green and red) and gives a signal to enter the trade (purple bars).
Backtesting
Backtested on XBTUSD , BTCPERP (FTX) pairs. You may notice it shows good results on 3h timeframe.
Relatively low drawdown
~ 10% (from 2019 to date) FTX
~ 22% (4 years from 2016) Bitmex
I backtested on the different altcoin pairs as well, but the results were just not good.
Relatively good results were shown by some index pairs from the FTX exchange ( FTX:SHITPERP ), but I think there is a few data for backtesting to be asure in them.
Bitmex 3h (2017 - 2020) :
i.imgur.com
FTX 3h (2019 - 2020):
i.imgur.com
Possible Improvements
- Regarding trading algorithm it would be good to check with strategy with ADX somehow. Maybe for the better entries
- As for Risk Management system, it can be improved by adding trailing stop to the strategy.
Link: school.stockcharts.com

Trend Artificial Intelligence Hello Everybody,
One thing that is important to understand is that every strategy needs to be tuned: for underlying, exchange, time frame etc.
There are so many indicators and tools ( moving average, Renko, RSI etc etc...) well proven and accepted by traders but you pick any of them and apply to any underlying it will not work. Why because they need to be tuned to specific factors.
This strategy is tuned using Artificial Intelligence models for Oanda Exchange for Euro/USD currency with time frame of 1 min ( this is very important)
Don't trust me check out its performance and you will know. Getting 10-20% return per month is not impossible.

Trend Balance Point System by Welles WilderThis is the original Trend Balance Point System created by Welles Wilders in 1978, rules can be found in his book New Concepts in Technical Trading Systems.

eb.Market Strength (trend is friend) v3 strategyHello traders,
This script using multi MA and EMA, MACD, RSI... for vote BUY or SELL.
If 80% signal vote for BUY, signal Long will been active
or 80% signal vote for SELL, signal Short will been active


HA smoothed eliminator v2 This script is published to show the difference between Heiken ASHI and Japanese candlesticks. I do not recommend using it in trading. the indicator is taken from here

Noro's BottomSensivity v0.6 strategy + rsi + AlarmThe original indicator is Noro's BottomSensivity v0.6
I simply turned noro's bottom sensibility 6.0 indicator, which I consider a great tool to find market bottom, into a strategy.
I also added an additional RSI filter with inputs that can be set by the user for entry and exit from the market.
I have tried to insert an alarm so that I can be notified when this particular purchase condition is formed.
I also tried to insert an additional filter that would allow me to make further pyramid purchases only after a certain percentage of drawdown from the first entry so as to reduce the average purchase price but I was not able ... if someone could implement this I would appreciate it.
Well..this is the first time that I try to program / modify a strategy / indicator, there are certainly some gross errors (as in my English too), please forgive me, I will appreciate the corrections that more experienced users will want to make.
I wish you all a good day, pfjons

Strategy - Backtest Uber ASH - Absolute Strength Histogram [UTS]Backtesting of Uber ASH - Absolute Strength Histogram
Backtest with focus win/loss profitability. Formula: profitability = win / (win+loss)
Do not put too much weight on trade PNL as the value is not necessary correct.
For example: on SL or TP hit an open position is marked as to be closed but executed on the open a new candle, thus leads to incorrect PNL.
Default equity 50k
Default 2% Risk per trade
Default currency USD
Define backtest interval precisely by month, year, day
ATR (len: 14, smooth: SMA)
ATR based Stop-Loss, if hit trade will be closed and considered as loss
ATR based Take-Profit, if hit trade will be closed and considered as win
If TP or SL is hit trade is closed and of course considered as win/loss
---
DM me / Tip (see Signature) or Subscribe for access

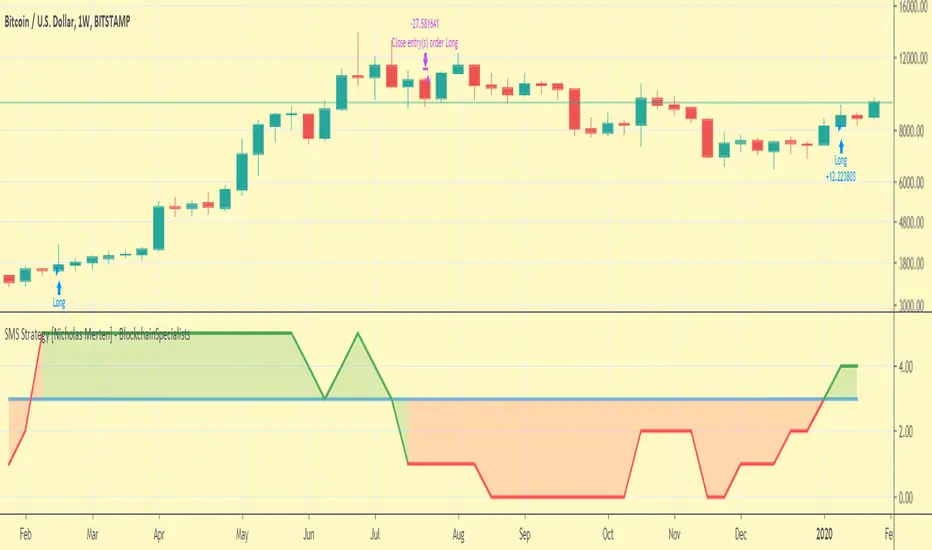
SMS Strategy [Nicholas Merten] - Blockchain SpecialistsHi, this is my interpretation of the indicator previous coded by u/SandRocks99 - His version can be found by searching:
"SMS Indicator"
*Please check out this indicator first*
My version of the SMS strategy functions as a TradingView Strategy to show where Long Positions (or Short Positions) could be entered. It also allows for every indicator variable to be altered and fine tuned to try and improve the strategy.
Also, as a bonus I've made an optional addition of a Percentage Trailing Stop.
To fix how it looks please go into Style Settings and un-check every box excluding 'Points Required' and 'Strategy Points'.
Any issues let me know.
EASYMOKU INDICATORThis is the popular Ichimoku Indicator with an easier way to adjust the settings that can help you in your trading.
Components of the Ichimoku indicator:
Tenkan Sen: Basically it is a moving average that goes from 7 to 9 periods.
Kijun Sen: Like Tenkan Sen, we are facing a moving average, but this time from 22 to 26 periods.
Chikou Span: It is the one that represents the current price, but reflected in 22 to 26 periods back.
Senkou Span A: Unlike Chikou Span, this line is drawn over the next 22 to 26 periods, and its calculation is obtained from the average between Tenkan Sen and Kijun Sen. It is a projected average in the future.
Senkou Span B: It is the result of calculating the average between the maximum and minimum over the last 44 to 52 periods, representing the following 22 to 26 periods (as well as the Senkou Span A)
As with Occidental trading systems, based on the crossings of averages, with the Ichimoku we will use the crossing of the Tenkan Sen (fast moving average) with the Kijun Sen (slow moving average) as buying and selling signals.
Strategy of this script:
A strong bullish signal is when price and Chikou Span rises above Kumo cloud and Tenkan Sen cross above Kijun Sen.
A strong bearish signal is when price and Chikou Span falls below Kumo cloud and Tenkan Sen croos under Kijun Sen.

MA strategyTrading strategy on moving averages. Based on Mean reversion. These algorithmic strategies are based on a concept that assumes a regular return of the price to a certain average level, provided that a sufficiently long time distance is considered. The main objective of such strategies is to determine the expected level of price return. Interconnected with Envelopes.

AllinStrategy v5.0 ::: Allin® MarketEnergy™You need two indicators for it to work: AllinTension 5.0 and AllinStrategy 5.0 and use them in synergy.
They measure and gather information and then present them in an intuitive way for better opportunity spotting and a better and quicker decision making about buy or sell entries in certain markets.
In works with crypto, stock, fiat and futures market.
I will explain how it works o a page but as a thumb rule: the more GREEN you see turning up like an energy the more LONG situation is and the more RED you see turning up like en energy the more SHORT the situation is.
The best thing about a product of mine is that it can be backtested. Results of backtesting yields up to 85% of accuracy and risk-reward ratio up to 5X or more.
Indicator - AllinTension 5.0
This indicator will enable you to actually feel the market on several levels. Exploiting informations from different timeframes and different oscillators with different setting and average them out.
With this indicator you will either confirm the sensed direction or you will skip the opportunity because signals are not properly aligned. To be able to resist FOMO is really crucial here. Opportunities are in abundance. There will be more. A lot more. Really.
How to read it and properly use it?
For more in depth understanding on how it works and proper usage of it. There is lot of information on the page.
Strategy: AllinStrategy 5.0
This strategy indicator is used as a backtesting platform for different types of various settings for a selected pair.
Backtesting means you can test each TimeFrame (best 1-9min) with various AllinTension indicator settings. You will get a result for profitability in the last period (but it is not that important anything but for maybe feeling bad you missed it), success rate in percent (anything above 70% is good enough) and you have to watch the ratio of the max dropdown and average trade size (least acceptable is -5x, better is 2x or less).
So you will learn which strategy (TF and indicator setting) has steadily preformed best while being profitable in the past and assume it will do that in the same manner with same accuracy in the future. It sometimes changes so you need to preform rutine testing after some bigger market movements.
With this you will find the best preforming TImeFrame for each window. You will adjust settings for each window differently to diversify view on the market. My personal best setting are for the first window 4-16-64, second window 3-9-27, third window 2-8-32 and forth last window 5-20-80.
So ALLinStrategy is a visual representation of the market and the most important thing, it includes a feature "Strategy Tester" to backtest chosen strategy. The results may surprise you and they can all be proven!:) So what do you do in this case? :):)
But to really understand the market and given signals from this Strategy, you will need indicator ALLinTension or you are going blindfolded guess trading.
How to read it and properly use it?
For more in depth understanding on how it works and proper usage of it There is lot of information on the page.
For strategy to work you first have to find profitable and accurate enough TF (more than 70% should do the trick)and indicator settings (there are some favourites) and apply it to your executing strategy.


New RenaissancePrelim version of MACD long entry and exit with custom time frame selector.
To do:
Add Stoch and Stoch RSI criteria.
