[BERA] POWER STRATEGYHey below my new strategy test, hope you like.
Work better with BTC
H1 and H4 timeframe.
How this work?
RSI based script.
-Modified length and different metrics for long and short.
Moving Averages.
-RSI panel below with color labels to identify the rsi levels.
-Simple trailing stop included.
Entry orders and exit orders for both -long and -short.
The default setup is the best perfomance i've find testing it.
If you are interest in the script contact me.
M-oscillator

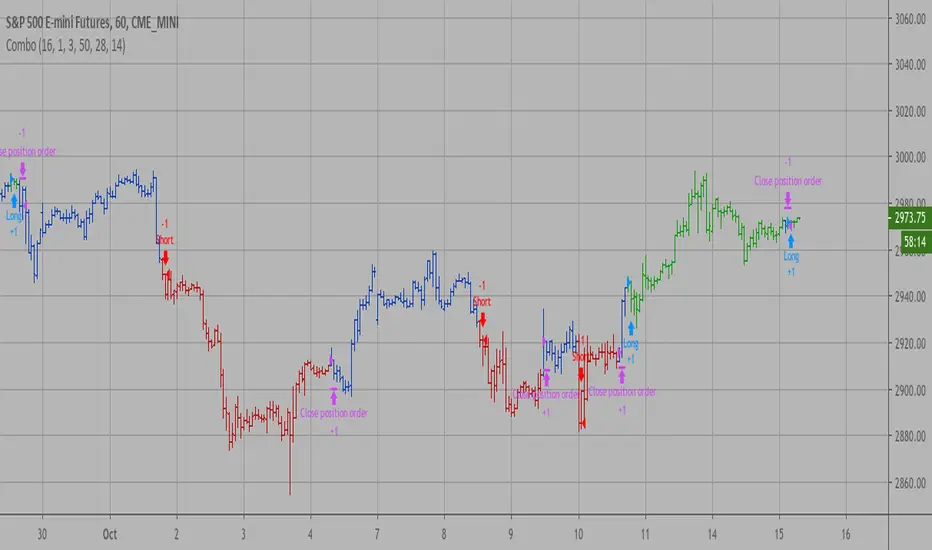
Combo Backtest 123 Reversal & DMI & Moving Average This is combo strategies for get a cumulative signal.
First strategy
This System was created from the Book "How I Tripled My Money In The
Futures Market" by Ulf Jensen, Page 183. This is reverse type of strategies.
The strategy buys at market, if close price is higher than the previous close
during 2 days and the meaning of 9-days Stochastic Slow Oscillator is lower than 50.
The strategy sells at market, if close price is lower than the previous close price
during 2 days and the meaning of 9-days Stochastic Fast Oscillator is higher than 50.
Second strategy
The related article is copyrighted material from Stocks & Commodities Aug 2009
WARNING:
- For purpose educate only
- This script to change bars colors.
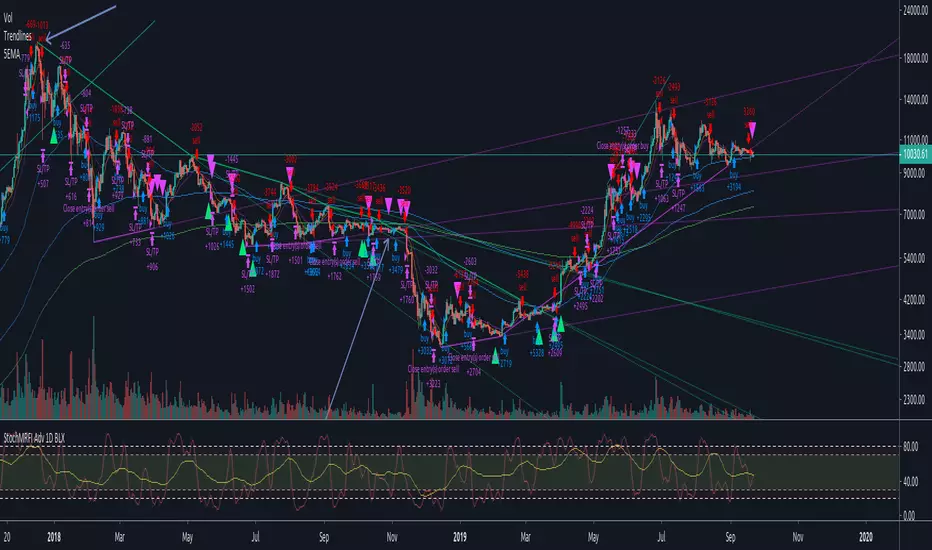
omid Strategy (Get over 1000% profit on Swing Trading)Make the highest possible profit in the market without any pressure, you will not need any other trading tool with this strategy, all the market noise has been eliminated.
*This strategy is tailored to the btcusd market and the default settings are proportional to the daily timeframe.
** You can change the settings to get the best results in other markets or timeframe.
***Get in position and relax for months.

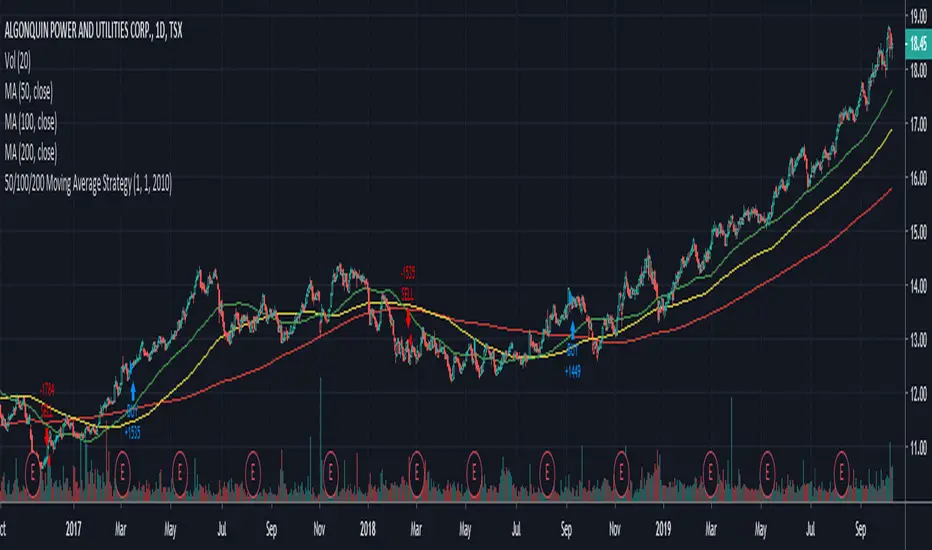
Easy to Use 50/100/200 Day Moving Average StrategyWhenever you see someone publish a chart or idea, what's the one thing you almost always see? Moving Averages!
Many investors focus on these indictors solely as entry and exit points, so here's an easy to manipulate strategy to backtest and see if this is feasible on your security.
CODE VARIABLES
LINE 2 - Here you can change your currency and amount you want to invest on each entry.
LINE 8/9/10 - Here we establish the 50 (Fast), 100 (Medium) and 200 (Slow) day variables. These can be adjusted to your choosing.
LINE 13/14/15 - Here we establish what date we want to start backtesting from. Simple change the defval on each line to change the date (In the code below we start on Jan 1st, 2010).
LINE 20/23 - Here, within the crossover and crossunder functions, we set which MA's must cross to enter and exit a trade. Below we have the 50 day moving above and under the 200 day. Simple change the variables to FastMA, MediumMA and SlowMA to your choosing.
NOTE: As a beginner you may not want to short stock, therefore LINE 5 was added to only allow long positions.
Hope this helps, from one beginner to another.
Cheers!
BlackMagic [BTC]BlackMagick is a trend following script looking to enter on retracements when a trend has been defined and should only be used on BTC/USD
Entries are marked with the X symbol
Stop-loss is a red circle
take profit is a green circle
The background colour of the entry defines which direction the trade should be placed green for long, red for short.
You can configure the stop loss which uses a 20-period ATR multiplied by 2.2 (this is configurable)
Take profit is derived by a Risk-Reward ratio, which is a default of 2 (this is configurable)

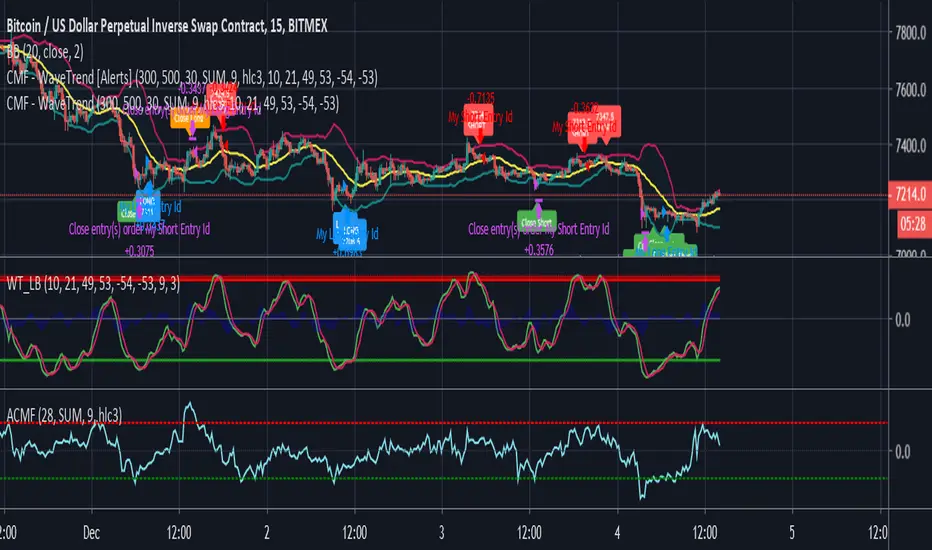
[BACKTEST]Traders Dynamic Index Indicator Alert by JustUncleLBy request, this script is a "strategy" version of my "Traders Dynamic Index Indicator Alert" script, made available for backtesting to help find optimal trade settings for a particular asset.

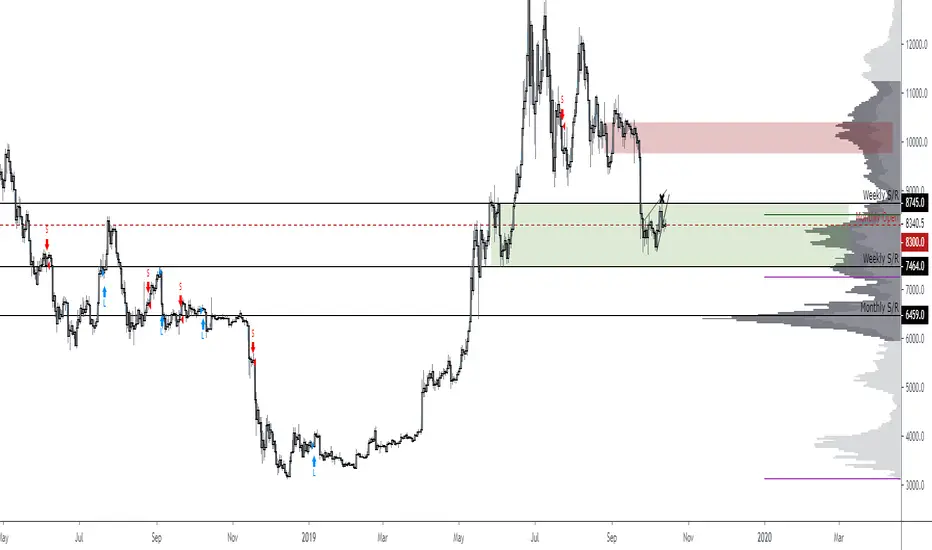
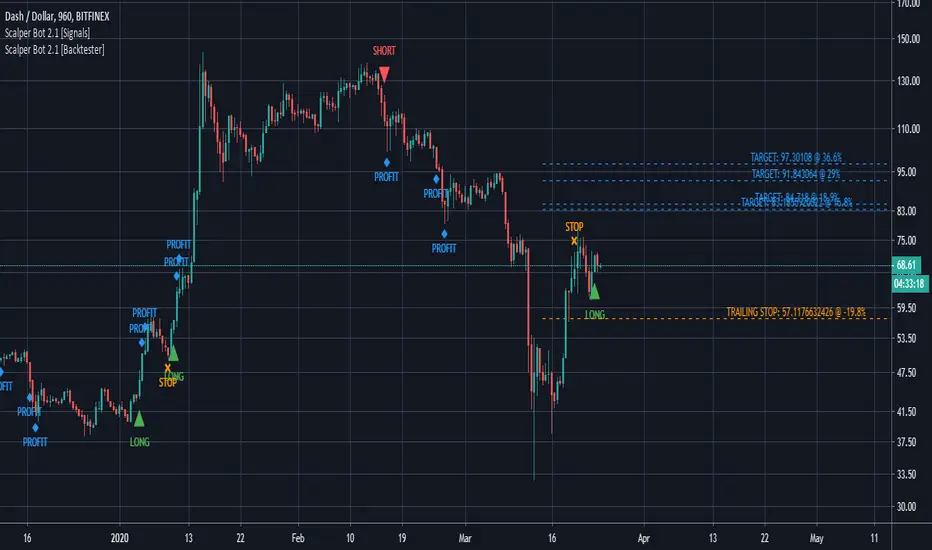
Scalper Bot [Backtester]Scalper Bot is a scalping strategy, looking for market turning points between support and resistance pivots
Scalper Bot is developed for Crypto markets. It has not been tested on forex or any other markets, however it is not limited to Crypto markets.
It can also be used on any trading pair, on any exchange and in any time frame.
Scalper Bot comes complete with 3 alerts:
- LONG: LONG indicates that the market could potentially go up
- SHORT: SHORT indicates that the market could potentially go down
- CLOSE: CLOSE is a trailing stop loss and indicates that the market is no longer moving in the anticipated direction and that the current position should be closed. The same CLOSE signal is used for both LONG and SHORT
When setting up alerts, LONG and SHORT alerts should be set up to give an alert on ONCE PER BAR CLOSE, whereas the CLOSE alert should be set to ONCE PER BAR
Scalper Bot is a margin trading script, and caution should be exercised when using margin trading
Commission in the backtester is set to 0% as each exchange and each trading pair has its own commission structure. Be sure to change this value for backtesting purposes to the required commission.
---INVITE-ONLY SCRIPT---
This is an invite-only script, if you would like to try out this bot, send me a message
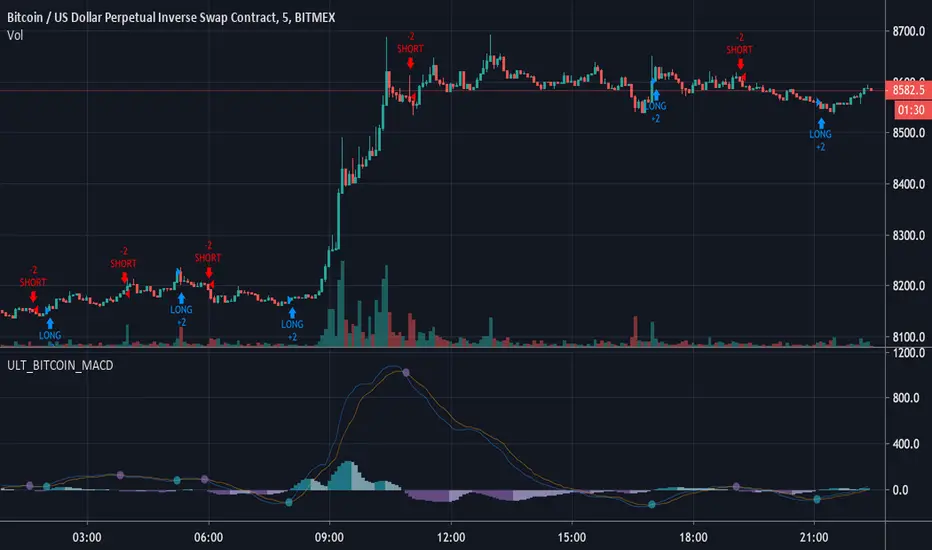
ULT_BITCOIN_MACDUltimate Bitcoin MACD aggregates macd, signal, and histograms across all USD bitcoin exchanges. The result is the most accurate look at bitcoin price action.
WARNING:
1. can have long load times to aggregate data
2. Only functional on USD based bitcoin assets
🚀 Alpha_Century_X 🚀 - Scalping God - Silent Whale v8The red triangle shows that a short signal,
The green triangle shows a long signal.
The green bar on the bottom shows that there is an uptrend.
The red bar on the top shows that there is a downtrend.
Follow the trend and wait for the signal to enter.
There are only four signals on the chart, so, this is a very easy to use indicator.

Strategy based on the principles of Price ActionIt is considered the percentage of candles with low and high closure for a certain period. Then, a moving average is built from these values. When the moving average of the ratio of tall candles to low candles is greater than the ratio of low candles to high, then long (that is, when the green line crosses the red). And vice versa - a condition for short. It also works on crypto with other settings. Idea for improvement: you can make partial exit by taking, at certain profit levels, the chart will be more stable. Result with a commission of 0.004% You can create an optimizer, and use this strategy on any liquid asset. (Sorry for google translator)

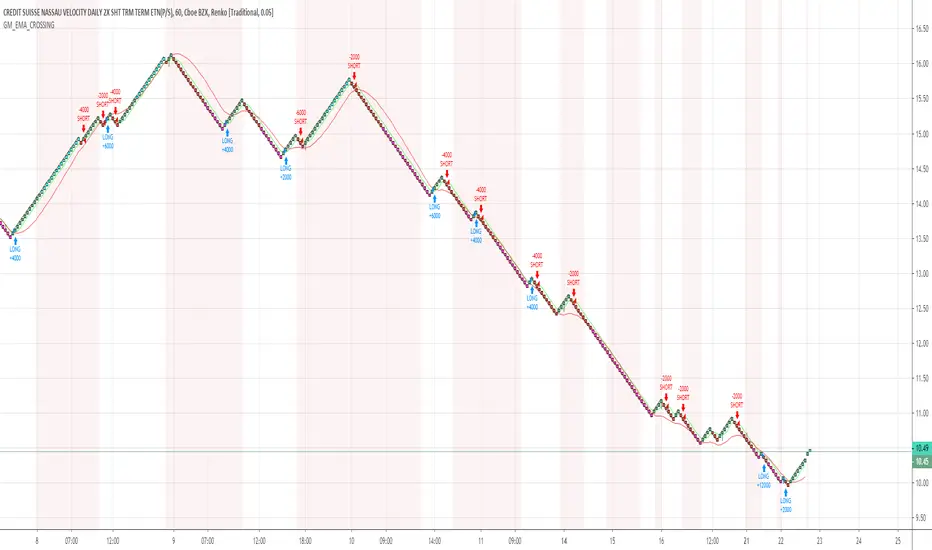
GM_EMA_CROSSINGThis is a simple Renko Strategy. The settings used were for Traditional (1.2) bars, tested on $SPX500USD. Around 70% profitable depending on timeframe, and bar size selected. Adjust the capital and suggested contract system depending on needs. The colored bars seen show blue for overbought conditions and pink for oversold conditions. If you like this strategy, please like and +rep!
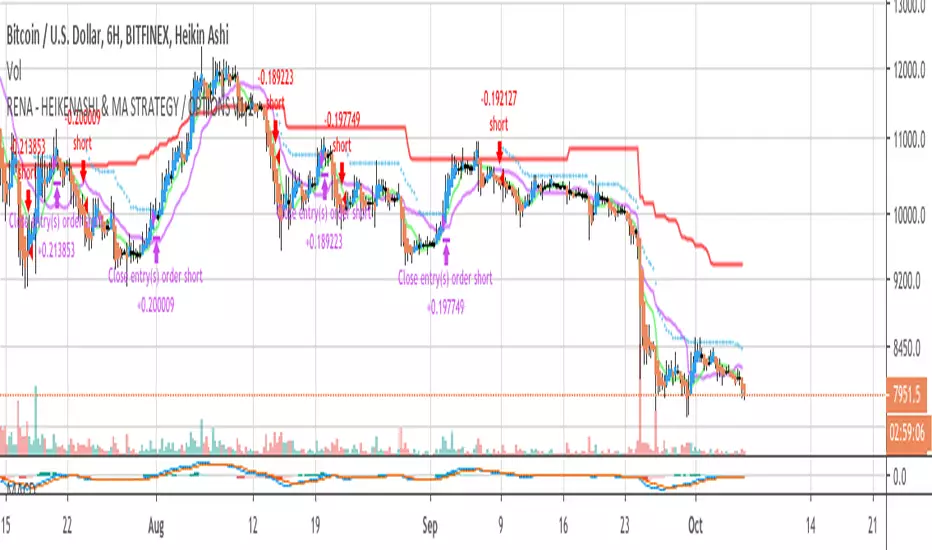
RENA - OPTIONS V1.2A swiss army knife type script, lots of indicators etc, good for crypto markets.
Study with alerts baked in can be found here
pm me for source code
happy trading xo
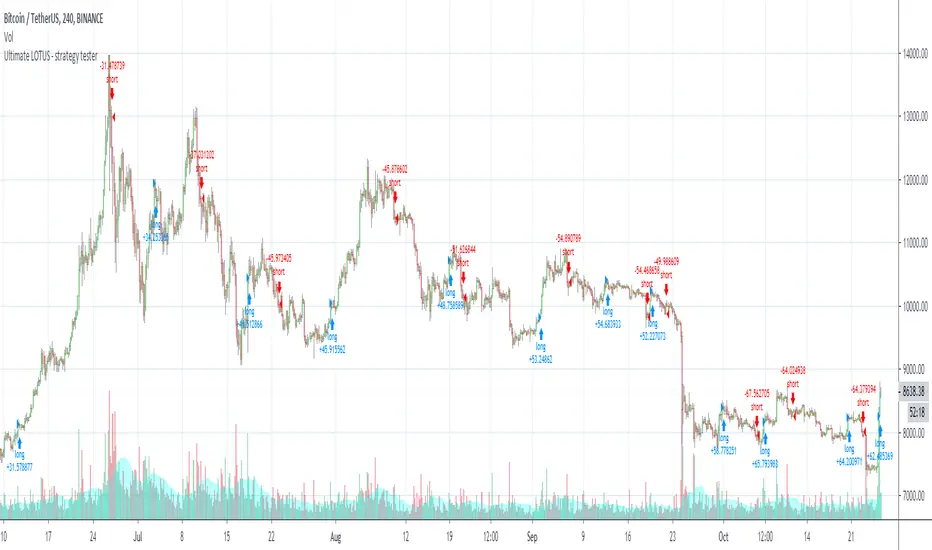
Ultimate LOTUS - strategy tester
Welcome to the Ultimate LOTUS - Strategy Tester.
This indicator is used for back-testing. Once you have found settings that you like, you can use my other published indicator "Ultimate LOTUS" to set alerts.
How to use: Apply to any chart, on any time frame. You will see LONG and SHORT signals on the chart. A LONG signal represents an entry/buy in, and a SHORT signal represents an exit/sell.
You can use the Express - Strategy Tester to scalp on low time frames such as the 5m, 15m, 30m etc. Or use it on higher time frames such as the 1hr, 2hr, 4hr.
You can use regular candles but Heikin Ashi are recommended for better accuracy.
You cannot set alerts with this indicator!
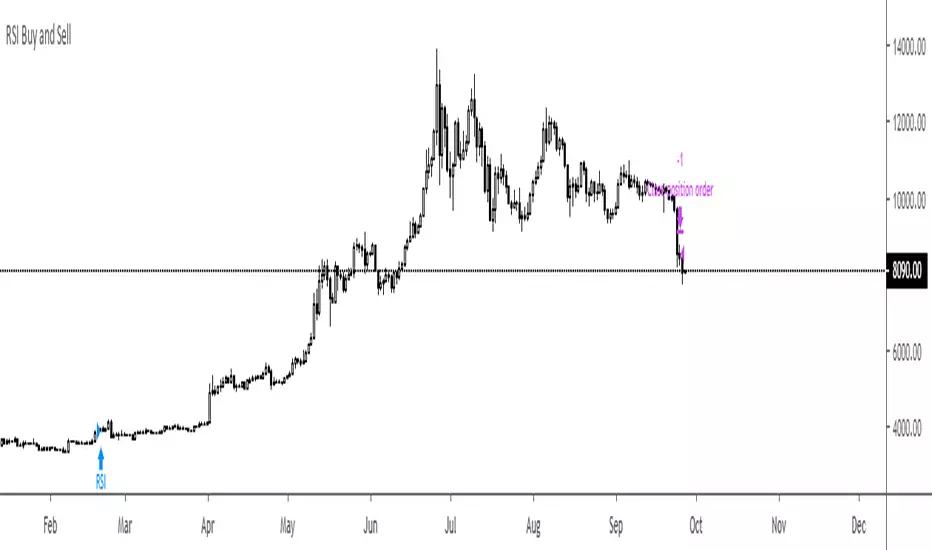
RSI Buy and SellThis is sooooooooo simple.
Buy when RSI is above 70 and don't sell til it'sunder 30.
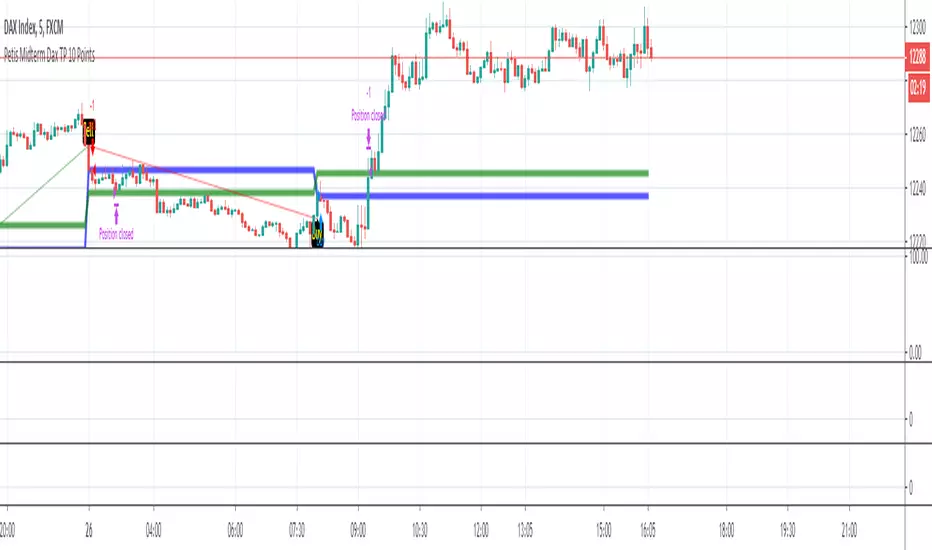
Petis Midterm Dax TP 10 PointsScript für ausschließlich!!! den Dax ( Ger30 )
Zeiteinheit ausschließlich!!! 5 Minuten.
Gewinne möglichst konsequent mitnehmen. Sollte eine Position weit ins Minus laufen, dann hedgen. Gegenpositionen ggf aufstocken.
Wichtig: erst mal ansehen, dann verwenden. Ein Gefühl dafür bekommen! Idealerweise mit Scheinen traden, nicht mit CFD.
SL setzten, wenn man besser schlafen kann. Erfahrungegemäß 40 Punkte. Meist kommt dann aber auch schon ne Gegenposition.
Moneymanagement beachten!
Dont trade an drive.
Dont trade and travel.
Nicht überhebeln.
Die Statistik gilt für 1€ pro Daxpunkt.
Zeitraum ca. 3 Monate.
Ich übernehme keine Haftung für das Script!
Ich übernehme keinen Support.
BTC Daily Strategy BFStrategy based on code by @CredibleHulk so thanks for that.
This is a strategy for the Daily Bitcoin chart which uses the MACD, RSI, Stochastic RSI and a moving average.
The conditions for long or short signals depend on the indicators above crossing user-defined thresholds.
Long signal = (Stochastic RSI k value is below Stochastic Sell Threshold) AND EITHER (MACD delta crosses above MACD Threshold OR RSI crosses above RSI Threshold)
Short signal = (MACD delta crosses below 0) AND EITHER (Close Price - an SMA of the ohlc4 values crosses below the DMA threshold OR Stochastic RSI k value is above Stochastic Sell Threshold)
INSTRUCTIONS
Green background = go long
Red background = go short
You can adjust stop loss values for long or short signals in settings as well as all parameters for the indicators.

Kite Crossing Oscillator, backtester (v2.1)This is an older version of Kite-Crossing-Oscillator-backtester/ .

Combo Backtest 123 Reversal & CMOfilt This is combo strategies for get a cumulative signal.
First strategy
This System was created from the Book "How I Tripled My Money In The
Futures Market" by Ulf Jensen, Page 183. This is reverse type of strategies.
The strategy buys at market, if close price is higher than the previous close
during 2 days and the meaning of 9-days Stochastic Slow Oscillator is lower than 50.
The strategy sells at market, if close price is lower than the previous close price
during 2 days and the meaning of 9-days Stochastic Fast Oscillator is higher than 50.
Second strategy
This indicator plots a CMO which ignores price changes which are less
than a threshold value. CMO was developed by Tushar Chande. A scientist,
an inventor, and a respected trading system developer, Mr. Chande developed
the CMO to capture what he calls "pure momentum". For more definitive
information on the CMO and other indicators we recommend the book The New
Technical Trader by Tushar Chande and Stanley Kroll.
The CMO is closely related to, yet unique from, other momentum oriented
indicators such as Relative Strength Index, Stochastic, Rate-of-Change, etc.
It is most closely related to Welles Wilder`s RSI, yet it differs in several ways:
- It uses data for both up days and down days in the numerator, thereby directly
measuring momentum;
- The calculations are applied on unsmoothed data. Therefore, short-term extreme
movements in price are not hidden. Once calculated, smoothing can be applied to the
CMO, if desired;
- The scale is bounded between +100 and -100, thereby allowing you to clearly see
changes in net momentum using the 0 level. The bounded scale also allows you to
conveniently compare values across different securities.
WARNING:
- For purpose educate only
- This script to change bars colors.