TEMA/HMA/VWMACD - Short Strategy 4HAs we can discover by studying the history of BTCUSD, the fall is always swift. Confirmation of this - today's collapse. In this strategy, an attempt is made to catch such drop by using quick entry and quick exit.
Let's describe what this strategy consists of:
• TEMA (you can find this strategy separately on this page or on platform)
• VWMACD
• HMA
• Take-profit and Stop-losses
Logic:
Firstly we VWMACD (the difference between VWMACD and simple MACD is only in the way of calculating moving average) and plot it as a histogram.
Then HMA is adding as a trend filter. For easy understanding let's plot it now on chart separately.
Next step is to create and add TEMA. After it is needed to subtract slow TEMA from fast TEMA and plot this value around 0 on histogram. This is the main decision for the implementation of the short trade.
ENTRY the trade:
When VMACD is below 0 and price (src = close) is below the HMA and TEMA below 0.
CLOSE the trade:
When VWMACD is upper than 0 or price is upper than HMA or TEMA is upper than 0
You can find more strategies on tradingammo.pro.
M-oscillator

Combo 2/20 EMA & Accelerator Oscillator (AC) This is combo strategies for get a cumulative signal.
First strategy
This indicator plots 2/20 exponential moving average. For the Mov
Avg X 2/20 Indicator, the EMA bar will be painted when the Alert criteria is met.
Second strategy
The Accelerator Oscillator has been developed by Bill Williams
as the development of the Awesome Oscillator. It represents the
difference between the Awesome Oscillator and the 5-period moving
average, and as such it shows the speed of change of the Awesome
Oscillator, which can be useful to find trend reversals before the
Awesome Oscillator does.
WARNING:
- For purpose educate only
- This script to change bars colors.

Elegant Oscillator Backtest [loxx]Elegant Oscillator Backtest : John Elhers Elegant Oscillator from TASC's February 2022 edition of Traders' Tips.
Backtest for this:
What is it?
Normalized, Inverse Fisher Transform that oscillates between -1 and 1
How does this help me?
Helps the trader identify reversions to the mean
Backtest Features:
-Baseline filtering. 10+ moving averages to choose from
-ATR qualifier boundaries above/below the selected baseline
-1-3 take profit levels with stop loss
-Trailing take profit using ATR offset
-Post Signal, Baseline Cross signals
-Continuation Longs and Shorts
-Regular Longs and Shorts
-Backtest date ranges
-Ability to change how much is removed from trade at each take profit
*** Make sure the take profit % removed adds up to 100% between the number of TPs selected

Voyssnich ManuScriptHello,
After using Tradingview for a couple years and messing around with Pinescript for over a year now, this is my first real script, the “Voyssnich ManuScript”.
This Strategy was inspired by Voss Predictor Script (by user : midtownsk8rguy, which is inspired by the Whitepaper entitled “A PEEK INTO THE FUTURE” by John Ehlers ).
This strategy combines multiple Voss Predictors (Oscillators) with each different settings into 1 Oscillator. Although it visually looks like a MACD Oscillator I find that it produces much better results. The strategy inputs are the # Bars of Prediction, Fast Moving Average (of the Oscillator). and Slow Moving Average (of the Oscillator).
I use this strategy to trade the 1min. chart on cryptocurrency majors (Decent market cap. size Altcoins like BNB, SOL, AVAX, LINK, Etc.). It also performs decently on ETH, BTC and some stocks. You can probably test the settings to adapt it to any time frame as well, but remember that it was created to be use on low time frame.
You can choose the inputs for the Stop Loss, Take Profit and Trailing Stop. You will especially need to change the default inputs if you use the strategy on different time frame than the 1min.
There is also an EMA filter that you can choose to use or not.
I could have published this strategy as an Indicator which seems more popular on TV, but I think the most powerful thing about TV is the ability to backtest, which is something you can do with this strategy. If the Quantity appearing with every trade bother you, you can put it off into the Properties in Strategy Settings. In the strategy tester you’ll see that it uses 100% of equity for every trade (which is not recommend by Tradingview), but I find that it’s the best way to compare different strategies and test settings, but obviously DON’T PUT 100% OF YOUR MONEY IN THIS STRATEGY. You can also change the commission % (trading fees), which is default 3.6% (0.036) based on the exchange I use. Be careful with the commission %, because due to the high number of trades this strategy produces, the commission % can have a very high impact on the results depending on the exchange you use.
Disclaimer: If you use this strategy for real trading, you are responsible for your trades.
PS: The name of the Strategy is inspired by “Voss Predictor” and one of the weirdest books on earth, the Voynich manuscript, you can dig into that rabbit hole if you want.

Combo 2/20 EMA & Absolute Price Oscillator (APO) This is combo strategies for get a cumulative signal.
First strategy
This indicator plots 2/20 exponential moving average. For the Mov
Avg X 2/20 Indicator, the EMA bar will be painted when the Alert criteria is met.
Second strategy
The Absolute Price Oscillator displays the difference between two exponential
moving averages of a security's price and is expressed as an absolute value.
How this indicator works
APO crossing above zero is considered bullish, while crossing below zero is bearish.
A positive indicator value indicates an upward movement, while negative readings
signal a downward trend.
Divergences form when a new high or low in price is not confirmed by the Absolute Price
Oscillator (APO). A bullish divergence forms when price make a lower low, but the APO
forms a higher low. This indicates less downward momentum that could foreshadow a bullish
reversal. A bearish divergence forms when price makes a higher high, but the APO forms a
lower high. This shows less upward momentum that could foreshadow a bearish reversal.
WARNING:
- For purpose educate only
- This script to change bars colors.
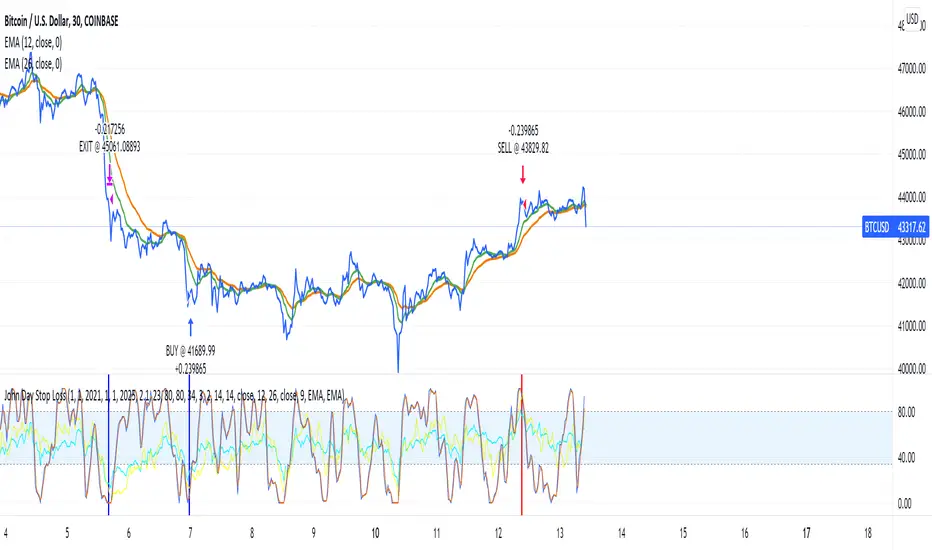
BTC 30m ScriptWhat are your thoughts on this script? I connected it to Coinbase Pro via AWS lambda for auto-trading. I'm waiting for BTC to start bullish again before turning it on in production. Thoughts? Thank you! John
Divergence for Many Indicators v4 STHello Traders.
This is the Strategy version of Divergence for Many Indicators v4, an easy and comfortable indicator.
- - - -
*It's been modified a little bit from the original.
*I got permission from the original author.
*I'm not good at English, I'm sorry.
- - - -
< 4 things to check >
1. Since repainting is not performed, the first imprinted signal can be accurately seen.
2. It does not respond to continuous diversions.
3. If the opposite diversity is not imprinted, caution is required as it is designed not to indicate liquidation. Be careful when reading the figures shown in the strategy tester.
4. Added stop loss and take propirane.
< What changed? >
1. pivot period 5 - > 9
2. Money Flow index and Chaikin Money Flow are released.
- - - -
KOR SUB
< 4가지 확인 사항 >
1. 리페인팅이 없으므로 첫 번째로 각인된 신호를 정확히 볼 수 있습니다.
2. 연속된 다이버젼스에 대해서는 반응하지 않습니다.
3. 반대의 다이버젼스가 각인되지 않으면 청산 표시를 하지 않도록 설계되어 있으므로 주의를 요합니다.
4. 스탑 로스와 테이크 프로핏 항목을 추가하였습니다.
< 무엇이 변경되었나? >
1. 피봇 페리어드 값이 조금 수정되었습니다.
2. MFI & CMF 가 체크 해제된 상태입니다.
THANK YOU ^^

CCI Level ZoneThis strategy uses CCI 1000 as zones Buy sell if greater than level 100. will be seen as an uptrend If it's lower, it's a downtrend.
So we will use RSI. To trade in its zones, using the RSI crosses the level line, and when the RSI crosses the level line, it waits to buy with Stochastic.

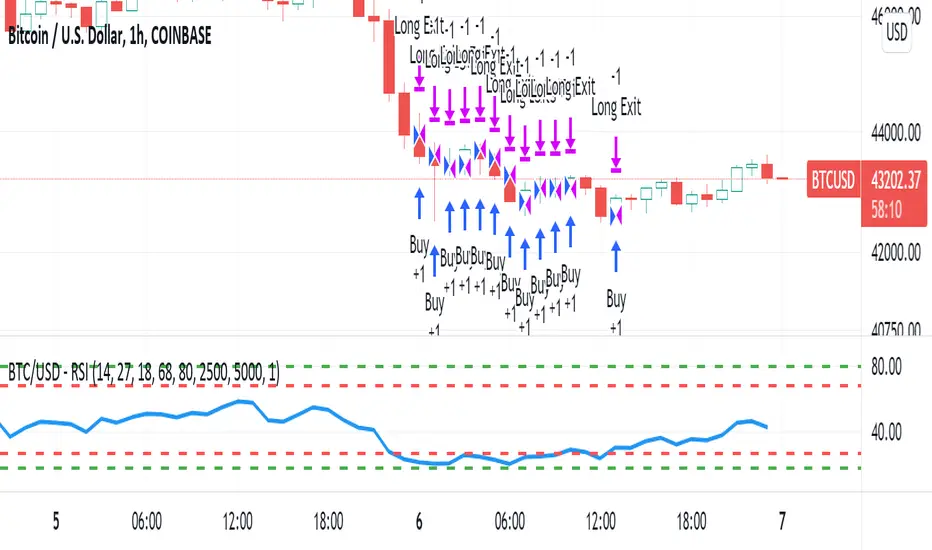
BTC/USD - RSIIF RSI (14) reaches 68 ... sell 1 lot size ( with TP 250 points and SL 500 points)
IF RSI (14) reaches 27 ... buy 1 lot size ( with TP 250points and SL 500 points)
IF RSI (14) reaches 80 ... sell 1 lot size ( with TP 250 points and SL 500 points)
IF RSI (14) reaches 18 ... buy 1 lot size ( with TP 250points and SL 500 points)
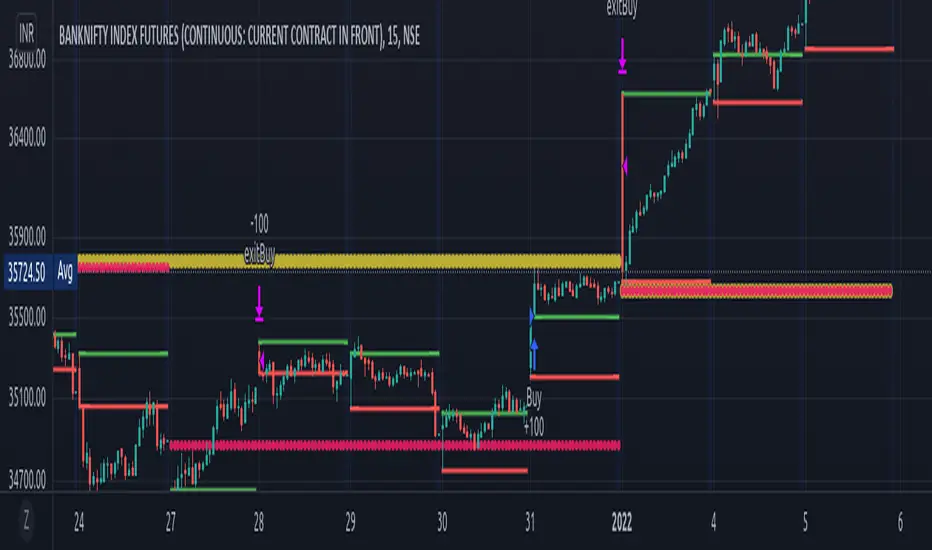
yuyutsu-banknifty-beta"yuyutsu-banknifty-beta" indicator is a strategy especially made for NSE/BSE Banknifty. Strategy has various sub strategies which can be selected to check back tested accuracy and profit factor. Strategies works best on 3m /15m for intraday. Sub strategy "Swing" can be applied on either nifty and banknifty.
I have also added checkboxes for 3m/15m which implictly selects best combination for desired results.
Below are the sub strategies which user can use and perform back testing.
HMA
Daily Weekly Closing
Daily Monthly Closing
Pivot
Previous day open close
Gap up/down
75m analysis
ORB
Swing
TDI
VMWA
VWAP
Ripster clouds
Holyscalp v.3 A MACD 15 min trading strategy,
I set two macd trends that must match in trend direction to be traded,
along with that they must follow the moving average trend set in place
the trades trigger with an atr stop loss indicator "atr+" by zedartoftrading to be exact
It automates fully through autoview/oanda broker
the ma breach settings look back however many bars set in place and see if the bars are closing in opposite trend to the moving average
*TIP get another chart with same forex pair and take and change the candle sticks to heikin candles and set chart to 1D and trade only with that trend for the 15min settings, you can disable short trades by setting the threshold limit to 1 and to disable long trades set threshold to -1
Dec 31, 2021
Release Notes: for my use only
an hour ago
Release Notes: It trades based on these parameters I set in place.
1. The long term macd trend and the short term macd trend must match
2. The atr+ can not be more than 3x the previous atr.
3. It must trade with the trend set in place, I have two moving averages to choose from, to disable the second moving average set it to 1.
4. Don't touch the hammer and star fib level leave at zero, need to code that separately
5. the MA breach looks back a certain amount of bars to try and stop trading while its consolidating. I set at 1:0
an hour ago
Release Notes: Just updated the default settings, Remember they are set for optimization for 15mins but the same rules and parameters still apply to longer time frames, just change the moving averages to your liking if you want to move up timeframes.

TFO + ATR Strategy with Trailing Stop LossThis strategy is an experiment to learn what happens when The Trend Flex Oscillator (by Dr. John Ehlers) is used in conjunction with a volatility indicator like ATR. It was designed with cryptocurrency trading in mind.
The way I coded this experiment makes it unsuitable for bear market conditions.
When applied to a bull market, this trend-following strategy will open long positions when oversold price action appear to be reversing. It will typically close a position within a few days unless it gets caught in a bear market, in which case it holds on for dear life. I have tried to make back-testing very simple, but you should never trust it. It's merely and interesting tool for adjusting the many parameters that I've made editable in the configuration window. Those values include the ATR and TFO parameters, as well as setting a trailing stop loss. When closing a position, the strategy can optionally be told to ignore the trend analysis and only obey the trailing stop loss value. I've made an attempt to allow the user to define the minimum profit necessary to allow the strategy to close all all positions. In my observations, the 2H candlestick charts seem to produce the best results, although the parameters of the strategy could theoretically be adjusted to suit other time periods.
In summary...
This strategy has a bias for HODL (Holds on to Losses) meaning that it provides NO STOP LOSS protection!
Also note that the default behavior is designed for up to 15 open long orders, and executes one order to close them all at once.
Opening a long position is predicated on The Trend Flex Oscillator (TFO) rising after being oversold, and ATR above a certain volatility threshold.
Closing a long is handled either by TFO showing overbought while above a certain ATR level, or the Trailing Stop Loss. Pick one or both.
If the strategy is allowed to sell before a Trailing Stop Loss is triggered, you can set a "must exceed %". Do not mistake this for a stop loss.
Short positions are not supported in this version. Back-testing should NEVER be considered an accurate representation of actual trading results.
// portions © allanster (date window code)
// portions © Dr. John Ehlers (Trend Flex Oscillator)
This code is provided for educational purposes only. The results of this strategy should not be considered investment advice.
The user of this script acknowledges that it can result in serious financial loss when used as a trading tool

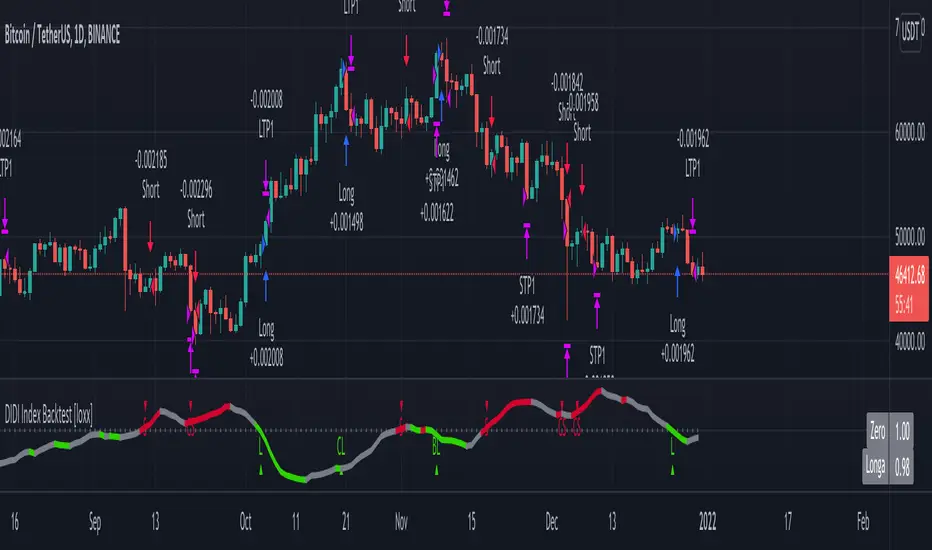
DIDI Index Backtest [loxx]DIDI Index Oscillator with Zero-line cross signals, continuations, and Baseline filtering
Indicator developed by Brazilian and analyst Odir Aguiar (Didi), consists of "Moving Averages", known for the famous needles Didi, which allows the visualization of reversal points.
Backtest for the following indicator:
Features
-Includes the following moving averages
ALMA
EMA
DONCHIAN
EAEF
EDSMA
EECEMA
EMA
EPMA
FRAMA
HMA
INSTANT
JMA
KAMA
Kijun v2
LSMA
MAMA
McGinley
MF
RMA
SMA
SSMA
T3
TEMA
TRIMA
VWMA
WM
ZLEMA
-Baseline filtering internal to indicator
-Has logic to account for Post Signal Baseline Crossover (PSBC) rules
-Has both short and long regular and continuation signals
-ATR-based stop loss and take profits
-1-3 take profit settings
-Moving stop loss after take profits
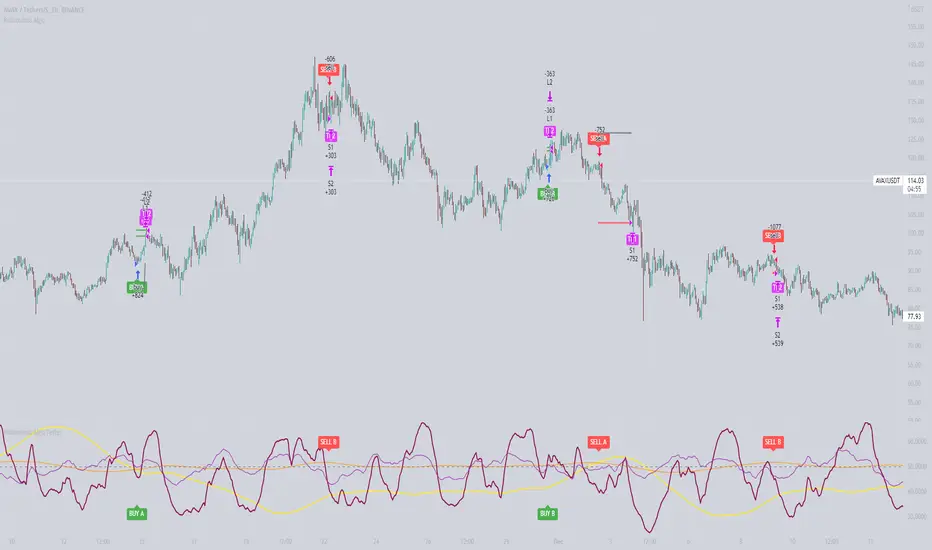
Ridicoulous Algo v1We present you a newly developed Indicator!
In this strategy we use a combination of two setups to catch the highs and lows and follow the right direction at all times. We also take data from the price action from a second source, which can be chosen in the dropdown menu or via plain text (Cryptocap:BTC, Cryptocap:BTC.D etc).
The oscillator is based on a baseline of 50, where below 50 is bearish and above 50 is bullish. The signal itself is filtered by an EMA so we don't get sell signals in uptrend and vice versa. The data from the second source gets represented as a channel so we can print it like an oscillator. The take profit/stop loss is chosen with an amount in %. The signal line is a mix of the SMA and the EMA.
The backtest result shown is simulated with using 20% of the capital and a 5x leverage trading Avax Futures on Binance.
Please be aware that past results are no guarantee for future performance!
The alarms come as an AiO (All in one) alarm with SL and TP's that can be predefined.
With the right setup you can easily create very strong strategies on many different pairs!
And we are here to help you find them...
Here are some setups we actually got
prnt.sc Cotiusdtperp
prnt.sc BTCusdtperp
prnt.sc ETHusdtperp
prnt.sc BTCPERP
prnt.sc LTCUSDTPERP
Please be aware that past results are no guarantee for future performance!
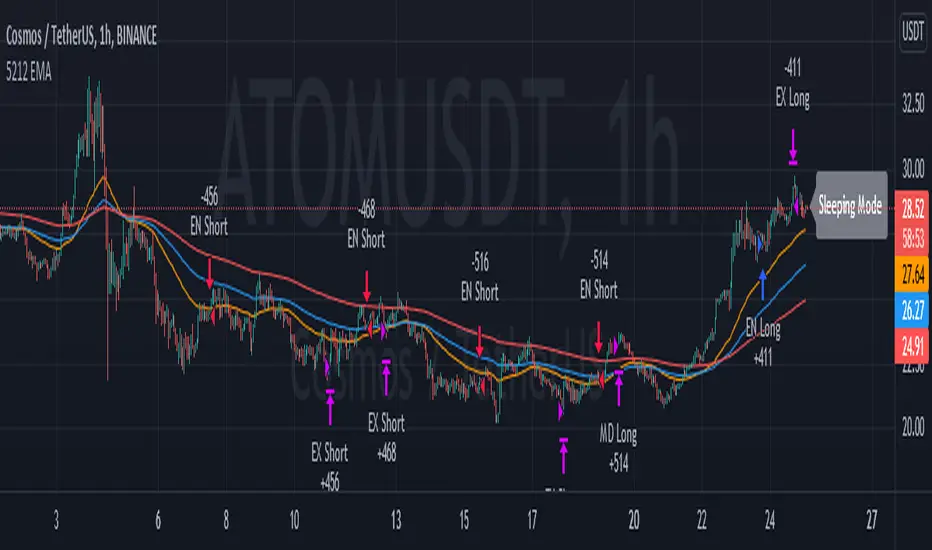
5212 EMA Strategyver 01
23 December 2021
This strategy using :
- 3 EMA period 50, 100, 200
- stochastic RSI slow
Long Cond :
- Stochastic RSI cross below 20
- EMA 50 > 100 > 200
Short Cond :
- Stochastic RSI cross above 80
- EMA 50 < 100 < 200
Sleeping Mode
- EMA 50 between EMA 100 & EMA 200
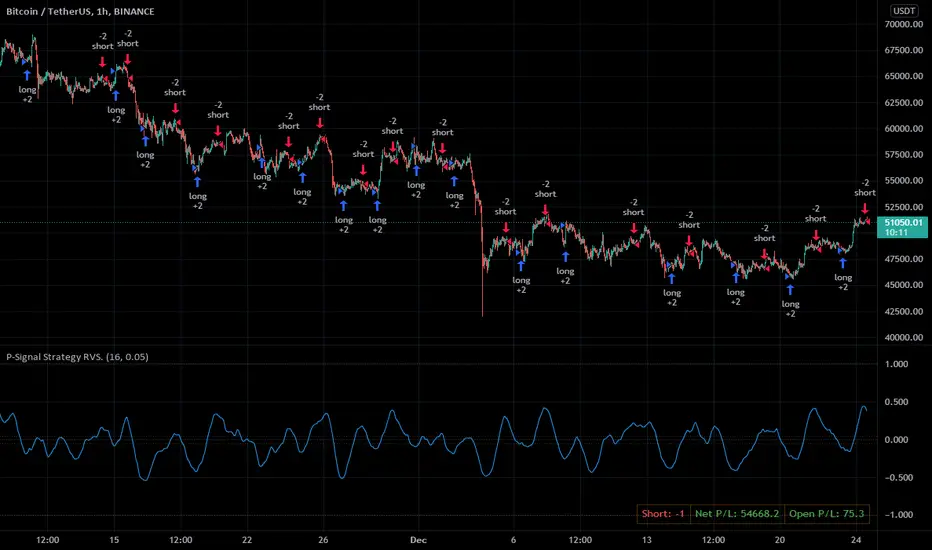
P-Signal Strategy RVS.For Christmas and New Year,
for P-Signal users - the PINE code of a reverse (trigger) strategy!
Strategy parameters.
==================
1. Cardinality – the number of points (from 4 to 200) that make up a set of elementary events (bar). This is the main parameter that determines success.
2. |ΔErf| - a size of the Δ region (from 0 to 1) of the error integral near zero. Helps save on commissions.
3. Observation time – the deputy speaks for himself.
NB: In the strategy, process_orders_on_close = true, order executes after a bar closes and strategy calculations are completed. Also Barstate.isconfirmed, i.e. the script is calculating the last (closing) update of the current bar.
Usage advice.
============
Set your exchange commission (0.2% by default). Start your search by increasing the parameter Cardinality. If in the Performance Summary two parameters Net Profit and Commission Paid are of the same sign and order, you are in luck, you have found a suitable probabilistic space. Further, you can reduce the losses from the commission using the parameter |ΔErf|.
Do not forget to publish the idea, for example: P-Signal Strategy RVS: BTCUSDT 1h (16, 0.05).
Note.
=====
P-signal is theoretical. It works in a probabilistic space endowed with energy (entropy).
TENKAN BOLTTENKAN BOLT
7 major point in this indicator are as follows :-
•Tenkan-sen
•Ichimoku Cloud
•Exponential Moving Average
•Change of Volume Analysis (calculated in background)
•Modified Keltner Channel (calculated in background)
•RSI Divergence (calculated in background)
•Entry and Exit Point
www.tradingview.com
There will be 2 types of Long entry alert and 2 types of Short entry alert.
•The first one is marked as "Long" or "Short" only which indicates the signal calculated by Keltner Channel, Tenkan-sen and change of volume in sudden time.
•The second one is marked as "Long Divergence" and "Short Divergence" which indicates signal by RSI Divergence in my own way (not aggressive).
The idea of this script is only trade the highest probability setup and I shall call it the "High Probability, Probability Trading". This is definitely not a buy or sell call as the idea of the script is to give a good direction for trader and to learn the high probability trading setup which includes the volatility of the market.
This script specifically created for Futures Crude Palm OIL (FCPO) market and may works differently in different market. It works great in 1 minute time-frame and 3 minute time-frame
(with slight adjustment).
Kindly contact me for usage. Thanks!

EMA Cross + Divergence strategy (Div. signals by The Divergent)A sample strategy demonstrating the usage of The Divergent divergence indicator and The Divergent Library .
The Divergent is an advanced divergence indicator which you can easily incorporate into your own strategies.
In order to use this strategy (and to use the signals in your own strategy), you need to have the Pro version of The Divergent applied to your chart.
For more information, please see the comments inlined in the code.

Up & Down Trend Trading Strategy - BNB/USDT 15minThis strategy will focus on up trend trading and down trend trading based on several indicators such as;
for up trend
1. SAR indicator
2. Super trend indicator
3. Simple moving average for the period of 100
down trend
1. RSI Indicator
2. Money flow index
3. Relative volatility index
4. Balance of powder

3RSI 3CCI BB 5orders DCA strategy+This strategy is just an attempt to find the indicator values for the trading bot service that I use (link in profile). Due to the use of the “request.security” function in the code, the indicators can be redrawn, but this is not important in history. The strategy used only 5 orders for the "DCA" - bot, located at the same distance in the price overlap range. I only use this strategy when trading in pairs against bitcoin.
Эта стратегия – просто попытка подобрать значения индикаторов для сервиса торговых ботов, который я использую (ссылка в профиле). Из-за использования в коде функции «request.security» возможна перерисовка индикаторов, но на истории это не важно. В стратегии использовано всего 5 ордеров для «DCA» - бота, находящихся на одинаковом расстоянии в диапазоне перекрытия цены. Я использую данную стратегию только при торговле в парах к биткоину.

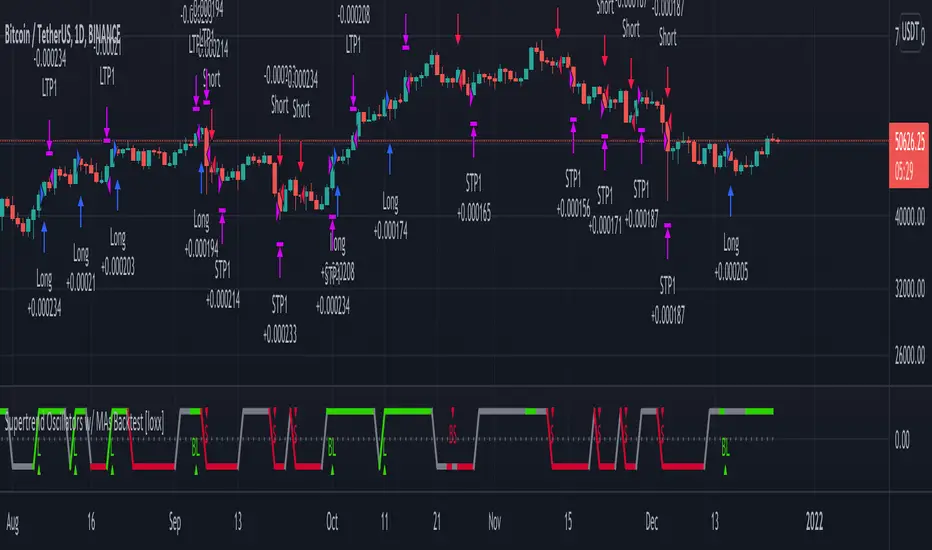
Supertrend Oscillators w/ MAs Backtest [loxx]Backtest for the following indicator:
Features
-3 selectable TPs with ATR
-Adjustable ATR and TPs levels
-Show shorts shorts or longs
-date ranges
Instructions:
-When you select the % per TP you must make sure they add up to 100% between the ones selected or no data will show
-Used to backtest corresponding indicator linked above
Future updates:
-Add lines for TPs and SL
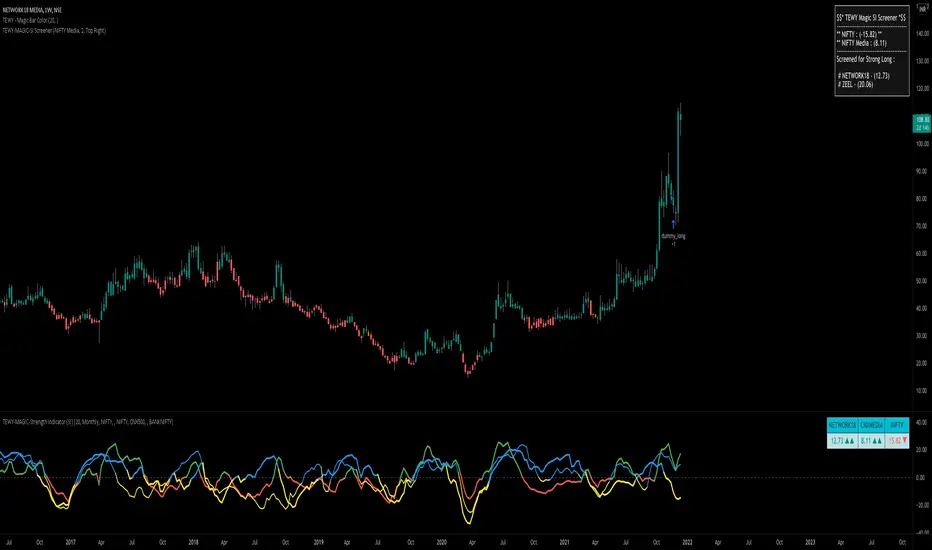
TEWY - Magic Strength Indicator (SI) ScreenerDetail about this indicator
This is screener to identify outperforming Stocks/Ticker based on the indicator "TEWY - Magic Strength Indicator (SI)" I deployed earlier. So please checkout that indicator description to understand more about this screener logic.
Below are the parameters that you may need to use to get outperforming indices/tickers.
1. Screener Set Name :
• Here you can see few of the predefined Index/Ticker sets i created, which you can use to screen Index/Ticker.
• If you select Set for 'Indices' you will get the list of Indices which are out performing NSE:NIFTY. Once you know which index is outperforming, then select the Set for that Index which I already given in the dropdown. That you will get the list of outperforming stock under that index.
• If you want to see all scripts of selected Sector Index that are outperforming NIFTY and may or may not be be outperforming Sector index, then please uncheck the box for "Outperforming Child Index Also". This will get you all the list of Stocks/Tickers which are outperforming Main Index NIFTY.
• If you want to see out-performers for specific period of time then change "How Many Outperforming Candles/Bars" as per your choice
• If you want to see under performers for Short trades then select "Find Short Trades" checkbox
• If you want to see the scripts which are just changed there signal then select "Latest Only" checkbox
Always respect RISKS and follow stop loss. In market stop loss is the only friend of yours.
I have given a sample illustrational image below, which should help you understand this indicator.
Best of luck