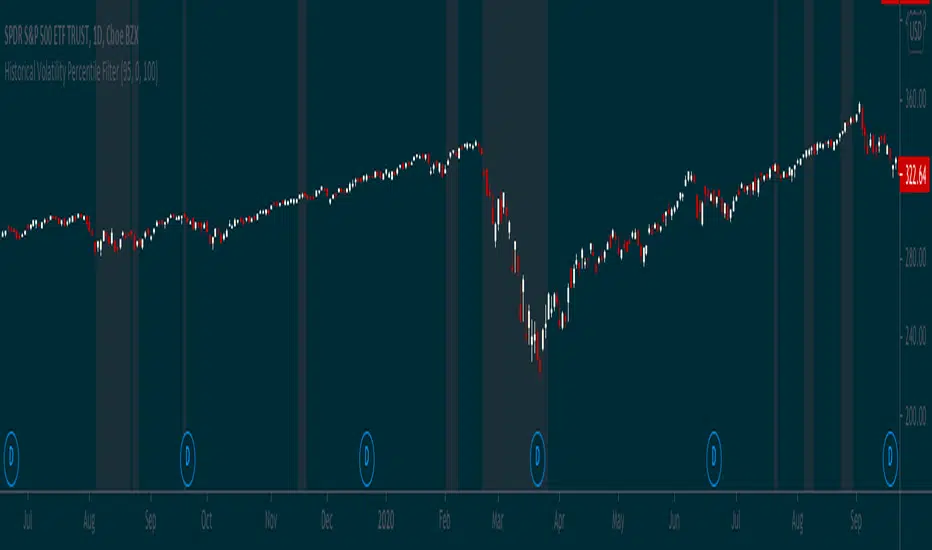
Historical Volatility Percentile FilterThis indicator provides a simple market regime filter for Historical Volatility. Depending on the strategy that you are using, it is useful to know how your strategy will perform at different
ranges of volatility, as this can greatly impact your performance. For instance, some of my long-only mean reversion strategies will only take trades where the volatility percentile is not extremely high, as this can often indicate fundamental changes in the security or the start of a big market correction. Some strategies may work better when volatility is higher
Feel free to use the following code along with your strategies to help improve performance and reduce the volatility of your gains in the long term.
Market
Market Cap - simpleThis is a simple market cap indicator . it allows you to see the actual market cap of a stock, live, on the chart, right next to the stock price.
The indicator uses the data provided by Tradingview to calculate the market cap based on the simple calculation of outstanding shares times the price, at any given time.
The indicator can be used to compare the actual value of a stock at different times when sometimes you might discover that the market cap when the price is low is actually higher than the market cap when the price was high. That scenario might happen when the amount of outstanding shares has been changed as time goes by.
That conclusion is another nice benefit to having the indicator, on top of just having the Market Cap right in front of your eyes, always up-to-date, changing as the price is changing as well.
transparency= the higher the value, the more transparent the indicator will be. this feature allows you to see the indicator if you want to, but not letting it interrupting your chart.
Hope you enjoy it and good luck!


Initial Balance Markets Time ZonesThe below script is based on Initial Balance.
Initial Balance is based on the highest and lowest points of Price Action (PA) within the first 60 minutes of trading. There is so much information available online, reference Initial Balance, that I have not provided a reference.
Most indicators I have seen have been solely based on UTC 0000 Initial Balance. My aim with this indicator was to be able to visualize how other time zones market openings Initial Balance affect PA.
The three market openings I chose to code in are:
London 0800 to 0900
New York 1430 to 1530
Asia 0000 to 0100
Within the script I have given the user the option to select to see with a green or red background when PA is above all zones Initial Balance high (green) or PA is below all zones Initial Balance low (red).
Alerts are also coded in, to prompt the user that PA has gone above or below as per above.
The Initial Balance high and lows also offer another form of areas of confluence.
Below are some examples of IB in action:
LTC
NULS
UNFI
DEXE

Pre and Market OpeningsPre and Market Openings is to enable you to quickly visualize the opening markets and how they could influence trading.
The below script has used the market time data from the below links:
Tokyo/Asia www.tradinghours.com
London www.tradinghours.com
New York www.tradinghours.com
The below script aims to plot:
Daily Asia Open
Weekly Asia Open
Daily London Open
Weekly London Open
Daily New York Open
Weekly New York Open
Using background colour it also shows market sessions (pre-market) for London and New York and regular for London, New York and Asia.
There is also plotted text for days of the week and sessions.
As you can see from the picture below that these market openings can act as support and resistance:
BTC
ETH

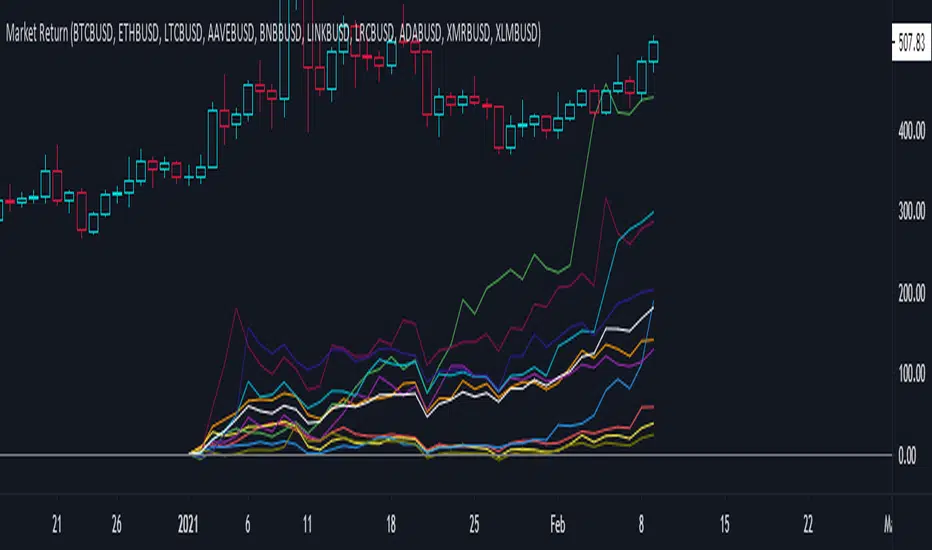
Market ReturnThis script calculates the market return for a specific period. It consists of two calculations which are:
1. Calculate market return of each asset - formula => (final value - initial value)/initial value
2. Calculate the aggregate average market return of chosen assets
The purpose of this script to see how much you would gain if you buy and hold the asset for a specific period.
Fundamental Metric to MarketThis script is supposed to be a quite basic way to find, from a fundamental standpoint, overvalue or undervalued stocks.
The script shows either Book to Market (inverse of P/B), EV /EBITDA, Earnings Yield (inverse of P/E) or Sales to Market (inverse of P/S).
For example, P/B is calculated as Close price / Book Value per share. As a contrarian investor you generally want to buy low P/B stocks and sell high P/B stocks. The problem is when a company has a negative Book Value. This might be the case when a company has written of a large amount of goodwill, which in turn wiped out their Book Value.
Instead you can use Book to Market, which is simply the inverse of P/B. It is calculated as Book Value per share / Close price. When using Book to Market you, generally, want to buy shares with high Book to Market values and sell those with low values. Because of the calculation, companies with negative Book Value will have negative Book to Market values and is therefore easy to identify.
The Fundamental Metric to Market indicator shows a colored background between the highest / lowest point of earlier values and the current value. When the background is mainly green the stock is probably undervalued, and the opposite is true when the background is red.
THIS IS NOT TRADING ADVICE, AND YOU SHOULD ALWAYS DO YOUR OWN RESEARCH
GOOD LUCK AND HAPPY TRADING

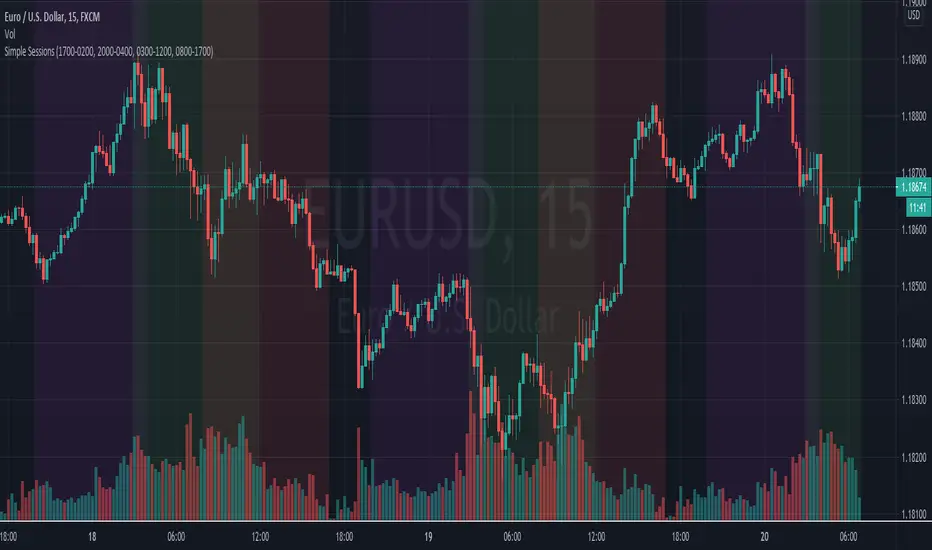
Simple Sessions## Background ##
Simple Sessions is based on the very awesome "Sessions on Chart" by Aurocks_AIF.
I really liked how the background colours worked but wanted to simplify it by removing some parts that I didn't use. I then simplified much of the code, put it into my standard template format and re-published. Hopefully the code is a bit cleaner and easier to read now.
## Usage ##
The default indicator shows the following sessions:
* Sydney in Navy
* Tokyo in Purple
* London in Green
* New York in Red
The good news is that using Green and Red for London and New York, gives a nice distinct yellow for the overlapping sessions. Sydney and Tokyo are by in similar colors by design.
By default, only London and New York show, but you may turn on Sydney and Tokyo in the settings.
## Use, Share, Like, etc #
Have fun!
-- chilts
Automated - Fibs with Market ordersThis script was recently shared for limit only orders here:
This version does not worry about keeping orders in the books and moving them around, instead it will simply market in and out.
I am sharing this to reveal the difference between the 2 setups.

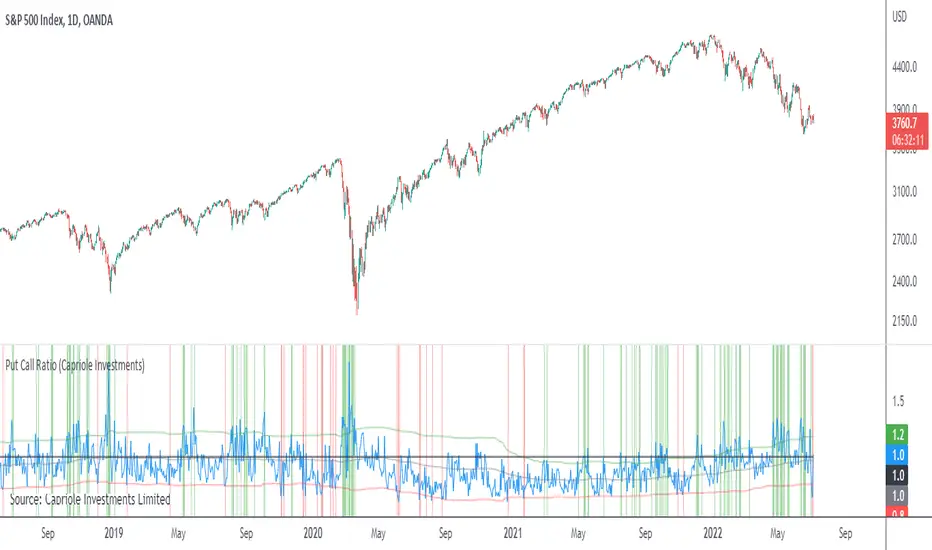
Put Call RatioPlots the CBOE Put Call Ratio and marks up locations of extremities.
Useful as a factor of confluence in identifying extremities in the market.
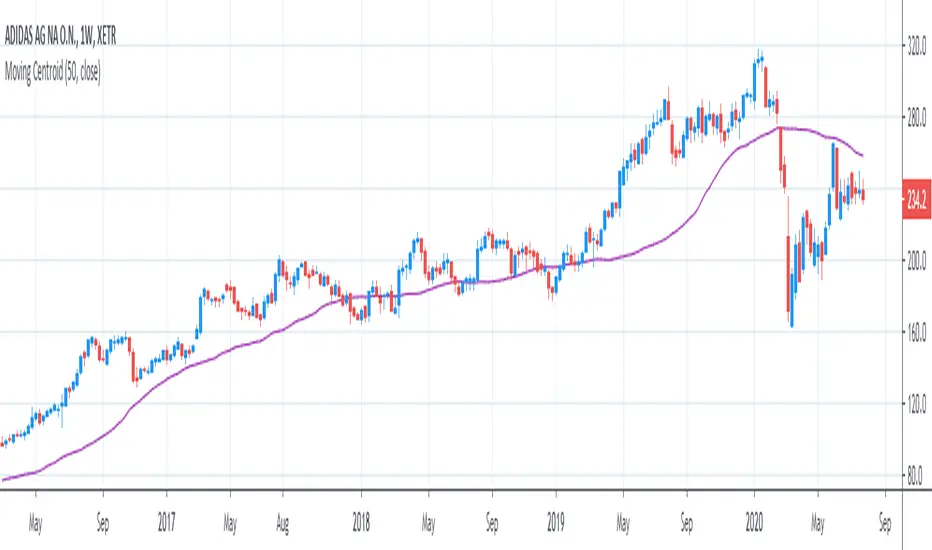
[R&D] Moving CentroidThis script utilizes this concept. Instead of weighting by volume, it weights by amount of price action on every close price of the rolling window. I assume it can be used as an additional reference point for price mode and price antimode.
it is directly connected with Market (not volume) profile, or TPO charts.
The algorithm:
1) takes a rolling window of, for example, 50 data points of close prices:
2) for each of this closing prices, the algorithm will check how many bars touched this close price.
3) then: sum of datapoints * weights/sum of weights
Since the logic is implemented in pretty non-efficient way, the script sometimes can take time to make calculations. Moreover, it calculates the centroid taking into account only close prices, not every tick. of a given rolling window That's why it's still experimental.
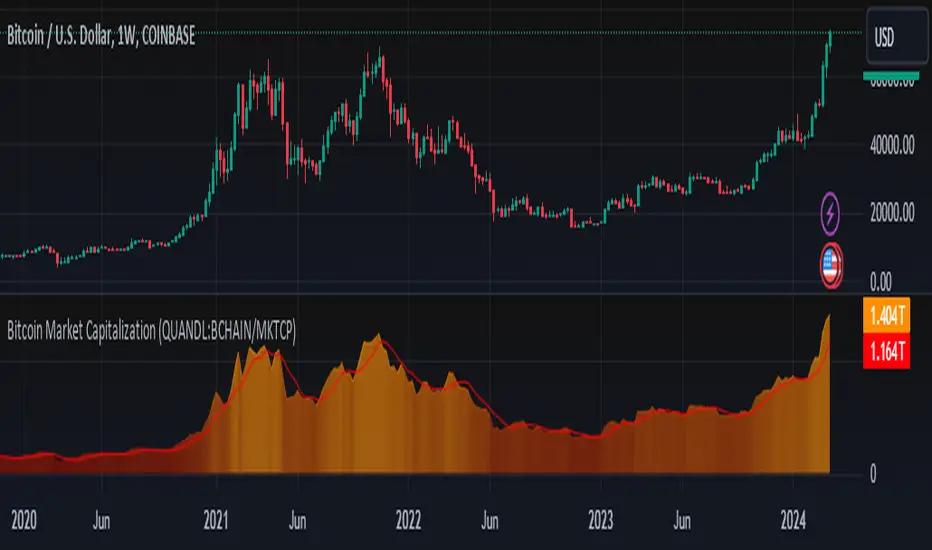
Bitcoin Market Capitalization (QUANDL:BCHAIN/MKTCP)Simple script that graphically represents the Bitcoin Market Capitalization
Blockchain data made available at QUANDL .
Its logic is simple, search the data in the QUANDL database and plot it on the chart.
Crypto Trading Hours UTC based on Berlin time (UTC +2)Although crypto markets trade 24/7, there are spikes in volume according to the general hours at which different parts of the world do the majority of their trading.
This Script highlights the US, European and Asian markets when they are most active. The normal market hours are always from 08:00 to 16:30 local time.
US market opens at 8:00 Silicon Valley local time, and closes at 16:30 New York local time.
European market opens at 8:00 London local time, and closes at 16:30 Frankfurt local time.
Asian market opens at 8:00 Hong Kong local time, and closes at 16:30 Sydney local time.

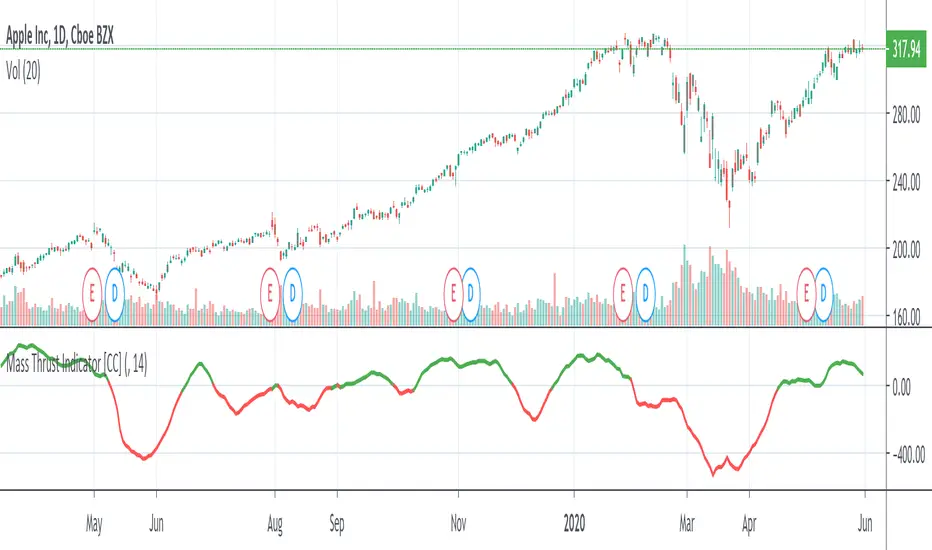
Mass Thrust OscillatorThis is a custom indicator that turns my Mass Thrust Indicator into an oscillator which is loosely based on Tushar S. Chande's Market Thrust Oscillator (Stocks & Commodities V. 10:8 (347-350))
Let me know if you would like a custom script or if you want to see me publish any other indicators!

Mass Thrust IndicatorThis is a custom indicator of mine that I based loosely on Tushar S. Chande's Market Thrust Indicator (Stocks & Commodities V. 10:8 (347-350)). Buy the stock if the indicator is green and sell when it turns red.
Let me know if you would like to see more scripts or if you have custom requests!
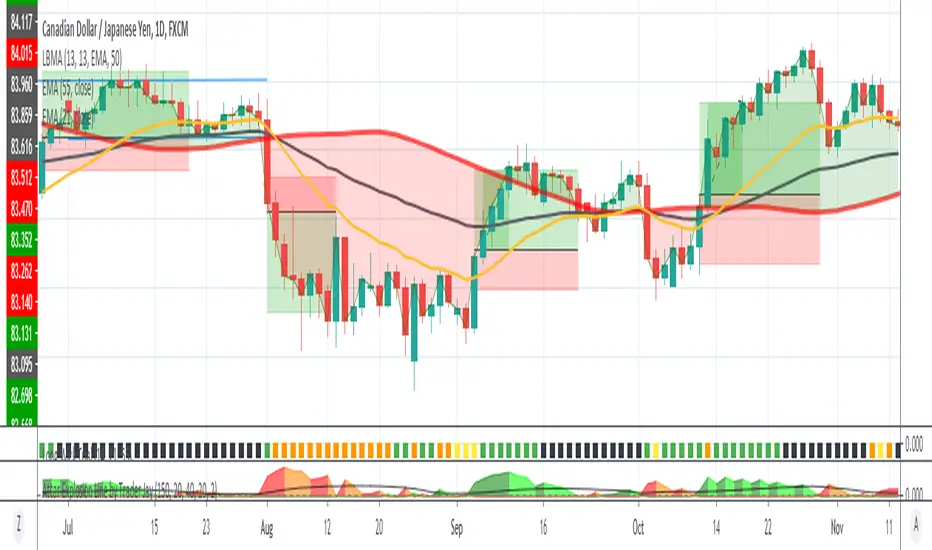
Long Wick TrialI've created this as a confirmation indicator to help know when market conditions are favorable to enter a trade. It measures volume, volatility, and ATR. It is not intended to tell you when to enter/exit the market, but use it with another indicator such as the mirror macd to filter out many losses and avoid entering the market during low volume or excessive volatility that may trip your stop loss.
Green = Favorable Market conditions
Yellow = Enter with caution, the market is moving sideways but is slightly trending
Orange = Enter with caution, the market is trending but extremely volatile and may trip stop loss early
Black = Shouldn't enter market here, market is moving sideways and volume is also low.
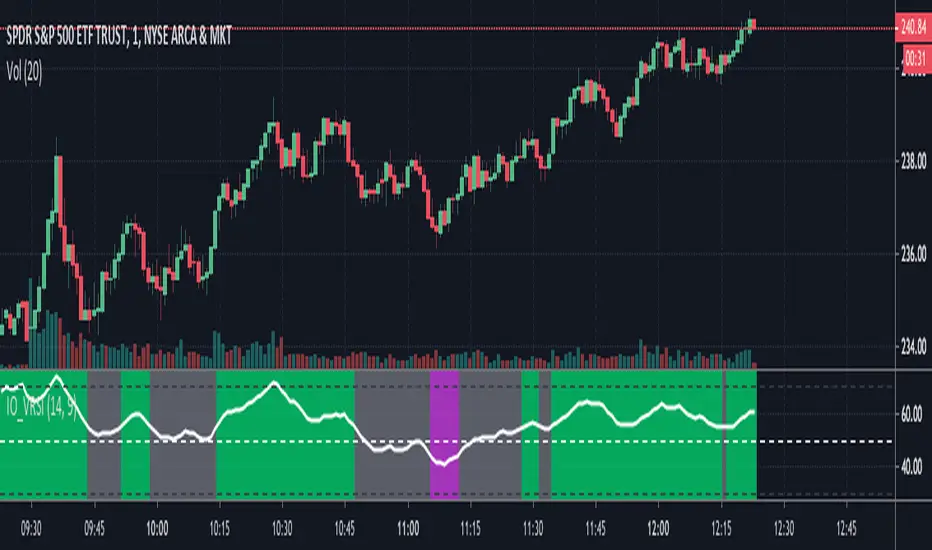
IO_VRSIOriginal Idea by Invsto
In this indicator, I explore the core concepts of RSI and extend it with smoothening to determine volatility.
Usage:
LIME/GREEN : High Volatility and BULLISH trend
RED/FUCHSIA : High Volatility and BEARISH trend
GRAY: Low volatility/Potential Chop Zone
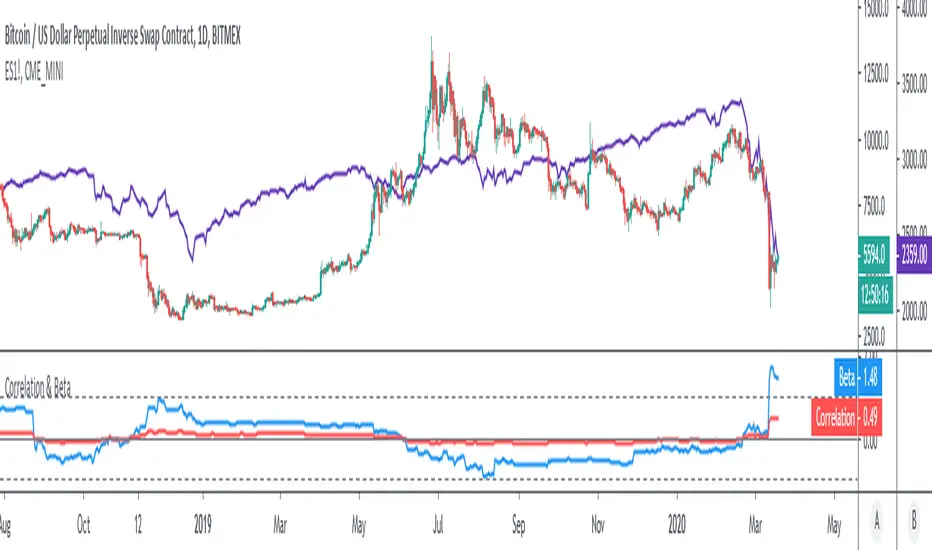
Correlation & BetaDisplay the correlation coefficient and/or Beta of an asset to a specified market.
Options to:
- Specify market (S&P500 futures by default)
- Display one or other metrics
- Modify assessment period (200 bars by default)
- Calculate on price, returns or log-returns
Yield Curve Inversion MonitorIdentifies when the US Treasury Yield Curve inverts (2 and 10 year bond rates).
When they ‘invert’ long-term bonds have a lower interest rate than short-term bonds. In other words, the bond market is pricing in a significant drop in future interest rates (which might be caused by the US Fed fighting off a recession in the future).
In the last 50 years, every time the US treasury yield curve inverted a recession followed within 3 years. On average the S&P500 gained 19.1% following the inversion and peaked 13 months later. In other words, as far as investors are concerned, the recession began roughly one year later.
However, once the market peaks, it then drops 37.6% on average, wiping out all those gains and more.
...Looks like 2020 is shaping up to be another prime example.

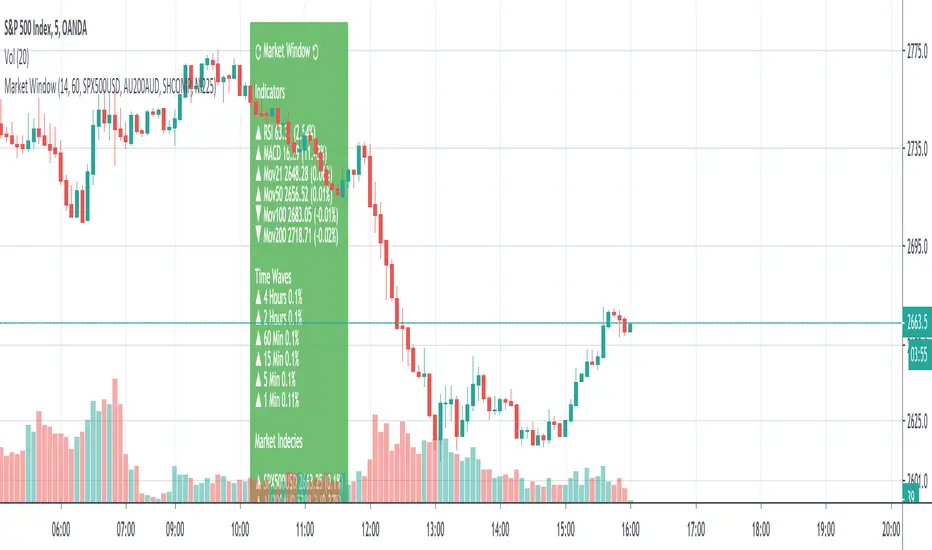
SMU Market Window with Price WavesSMU Market Window is a standalone panel of major indices, indicators, and, most importantly, the status of all timeframes 1 minute, 5 minutes, etc. all in one window.
Market window can be used on its own or in conjunction with the new version of Quantum Thermoballs Turbo Charged (to be released soon).
Since this scripts queries multiple time frames and multiple incendies, it takes 1-2 seconds to load. Once loaded it works like a clock.
Enjoy and always share knowledge so our Pine TV community can grow and reac a new high.
Zahorchak MeasureCreator: Michael G. Zahorchak.
References:
The Art of Low Risk Investing by Michael G. Zahorchak, 1977. Unfortunately, it's all but impossible to find a copy these days.
The Complete Guide to Market Breadth Indicators by Gregory L. Morris, 2006. A fantastic resource for those interested in Technical Analysis or creating their own trend based system.
Two articles by Greg Morris on the Zahorchak Measure. I can't link to them under the House Rules, but they are easily searchable.
The Zahorchak Measure (ZM) is designed to give you a market bias (either uptrend or downtrend) which you can use to determine a trade bias for ETF's or stocks.
ZM works by taking multiple moving averages of the NYSE Composite, a moving average of the NYSE advance decline line, and examining the relationship between those elements. Broadly, the market is considered to be in a uptrend when ZM is above zero, and a downtrend when below. However, there are many ways to interpret the indicator.
The version created by Greg Morris is more akin to a binary indicator in that ZM jumps from number to number. This version is smoothed to create an oscillator as it reduces whipsaws (at the expense of lag). You can set the EMA Length to 1 to go back to the original.
Some notes:
Michael Zahorchak called it the "Zahorchak Method", whereas Greg Morris uses the term "Measure". I'm not totally clear on the change, but Mr. Morris made some changes (covered below), so that may explain the altered name.
The original indicator used moving averages of 5, 15, and 40 weeks. I have converted these to daily numbers as that's the time frame I most commonly trade. You can convert the numbers back by dividing by 5.
The original indicator used the Dow Industrials for the moving averages, however Greg Morris switched to the NYSE Composite due to the advance decline line being based on the NYSE.
Greg Morris removed the 5 period moving average of the NYSE Composite, as it created increased volatility at market tops and bottoms. I tested ZM with the 5 period MA added back in, and I believe removing it creates a superior indicator.
I've added both Multi Time Frame functionality, and the ability to alter moving average lengths. Play around and see what you can come up with.
ZM oscillates between -10 and +10. There are some interesting levels creating between these two numbers (apart from the obvious zero level) - see what you can come up with.
All credit goes to Michael Zahorchak and Greg Morris for the indicator creation. I have simply reproduced their work for the TradingView community as this great indicator wasn't available.
Any queries let me know in the comments or PM me.
DD.

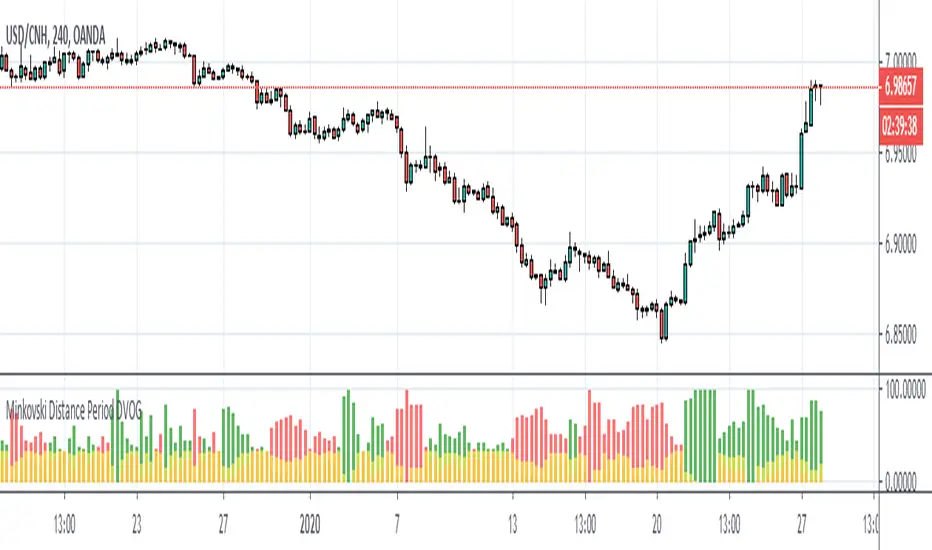
Minkovski Distance Period DVOGThis script was created by building my Dependent Variable Odd Generator script on the Minkovski Distance Adaptive Period.
I have tried this on MACD before.
Script related to MACD :
I used an older version that does not use Dow Factor to suit multi timeframe analysis.
In this way, market situations provide the opportunity to see histograms in an adaptive period as a Multi Timeframe.
Minkowski Distance Function Original Script by RicardoSantos :
Regards.