MMA mainpanelI stumbled on the MMA in the “Active Investing” course notes by Alan Hull (who invented the Hull Moving Average)
alanhull.com
He writes on page 13:
“Multiple moving averages, MMAs, are a sophisticated tool that can be used in a range of applications. MMAs are a series of lines that track and filter the weekly price movements. They consist of 2 sets of lines that allow Technical Analysts to observe and compare the immediate behavior of price activity with the long term behavior of the price activity. Exponential moving averages are used for this type of analysis. The price bars in the following chart have been switched off to improve readability of the MMA lines.”
“Once we have found a share that has an acceptable 'Rate of return' we must make a qualitative judgment of the trend. We are looking for a strong and consistent trend that is not likely to reverse shortly after we enter the market. The following points are critical;
- The long term group must be spreading apart or running parallel with each other.
- The long term group must be pointing upwards.
- The straighter the long term group of lines are; the less volatile the trend is.
- The short term group can pullback (ie. compress together) but if they cross into the long term group then the trend is weakening and may be about to break.
This type of qualitative analysis is only used when entering the market and the idea is to avoid volatility. We want to 'Buy and Hold' and not get bounced in and out of the market. Judging the quality of trends is the most subjective function we will have to perform.”
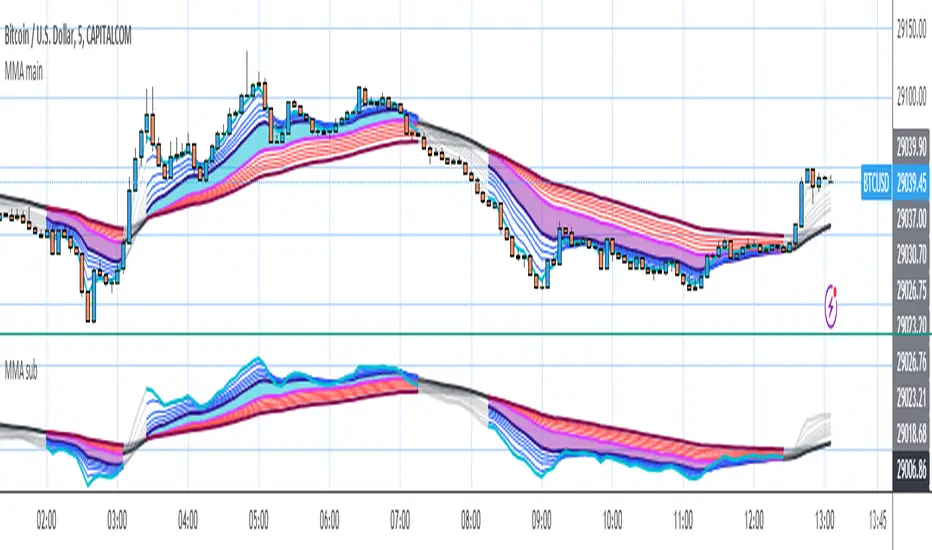
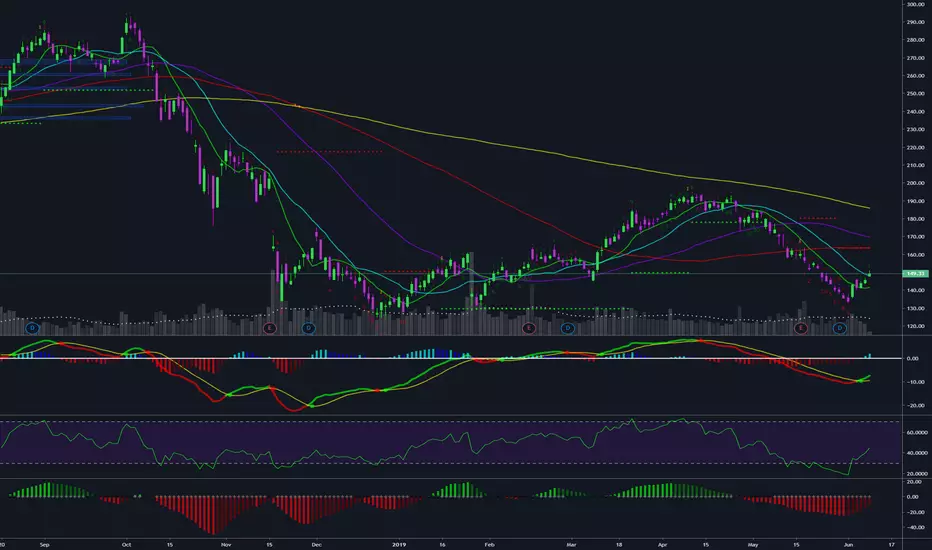
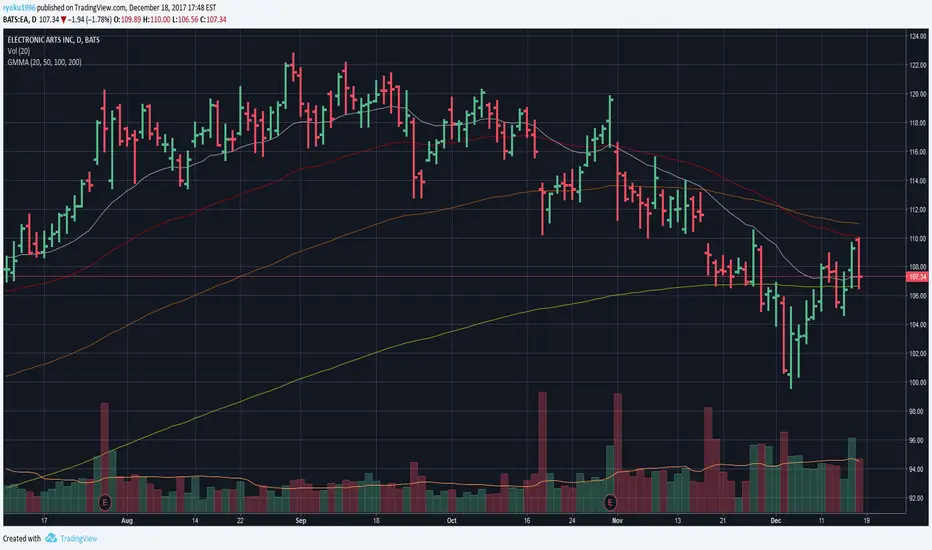
Because I tend to close positions too soon, I tried MMA. I found that it can help me to stay in position as long as the trend is going on. TradingView offers several scripts for MMA, this version differs from the others because I added color zones and linecolor changes to mark the trend according to Alan’s norms:
An uptrend is marked with a blue zone when the short term group is above the long term group and the long term group is sorted correctly and ema50 points up. The zone is purple when vice versa in downtrend. When there is no trend no zone is colored, but the lines are made gray.
Because of Alan’s idea to show MMA without price bars, I created both an overlay version for the main panel and a version for a sub panel.
MMA
Multi moving average (by S. G. Lee)- Multi moving average with one indicator
- You can choose SMA/EMA
- You can change length
- You can change color, thickness

Multiple Moving AveragesThis is an indicator with 4 moving average slots and 6 exponential moving average slots
It also has bollinger bands and a volume weighted moving average slot
Feel free to edit this and add/remove some and publish your own


Multiple Moving AveragesThis script shows multiple moving averages and has an indicator when they are about to cross. Depending on the scale you probably will need to adjust the values to have a working cross indicator.
Multiple Moving AveragesThis script plots up to five Moving Averages , either Simple or Exponential (9, 20, 50, 100 and 200 days period by default).

Multiple Moving Averages A&GMultiple Moving Averages A&G in an indicator
1.- ema 4
2.- ema 9
3.- ema 18
4.- ma 200
5.- ma 200
everything is customizable!!
ENJOY
By: AlexVille

SMA/EMA 12|26|50SMA/EMA 12|26|50
Exactly as title says
SMA is bold
EMA is light
Orange 12
Green 26
Blue 50

ETH/BTC MMAs Daytrade strategy 15min UT 0.05% feesPlayed around with Moving Averages, with the goal to bounce on trendlines and trend reversals.
Time Unit : 15 min
Candle Type : Heikin Ashi
Commission : 0.05% on trades (Binance fees)
Initial capital : 1k €
Do you think this could work?

Guppy Multiple Moving AverageAn implementation of the Guppy Multiple Moving Average, as originally described by Daryl Guppy.
Alert presets have been added for convenience, including
- Price enters investor group
- Price rises over investor group
- Price falls under investor group
- Trader-group rises above Investor group
- Trader-group falls below Investor group
Learn more about interpretation and uses of the GMMA in some of Daryl's books, I have thoroughly enjoyed reading "Trend Trading" and am looking forward to reading more of his works.

Renko GuppyI like renko blocks and I like guppy mma's so I decided to put together a study for using them with each other while I'm using other bar types.
Additionally, I added two line plots for two different renko sizes of your choice. This has a nice benefit of being able to see how price appears to be ranging between the "block sizes".
Being able to see the lines contract, especially within these "ranging" zones, gives you a great indication of an impending breakout.
The example you see above shows the guppy block size set to 15, the white line is 50 and the blue is 100. It should hopefully illustrate the idea.
The current close price (red line) can also be optionally plotted as a separate moving average, or simply the close price. I defaulted it to a 3 period EMA to smooth it out a bit so it flows a bit better with the guppy ma's. It's helpful to see how price is actually moving around within these Renko blocks.
Pick either Traditional or ATR block sizes.
There are the fast (5) / slow (5) moving averages.
Pick your poison: EMA (default), SMA, WMA, SMMA, DEMA, TEMA, HullMA, ZEMA, TMA, SSMA
There's some options to disable/enable things as you see fit.
The defaults are set to my own needs so you'll probably want to change block sizes for you preferences/symbols/timeframes.
Note: This is presumably only usable for those of you with access to Renko charts on here.

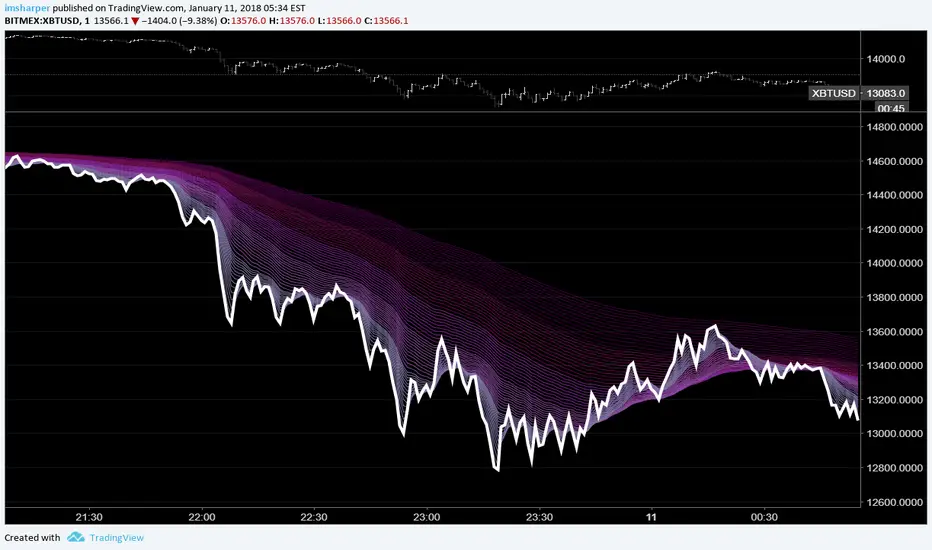
Rainbow MA StudyI've been interested in 'Multiple Moving Averages' lately and came across another script on here for a Rainbow MA.
Unfortunately its source is private and I wanted to try things out with other MA types so I put this together.
I also wanted to make it a seperate study so I could view regular bars without the clutter.
The general rule of thumb with these is the larger the price movement the wider the lines become giving you sort of a wave effect.
When the lines bunch up together you know there's going to be a breakout opportunity that will present itself.
Partly art, partly practical, entirely overkill. Enjoy!
The anchor multiplier should basically allow you to view things in relation to another time period, but it takes forever to load and will likely time out.
Since there are 63 MA's being calculated and plotted changing options on the fly takes some time to process and load.
I'm also pretty new to pine script so it's probably not the best implementation.
MA types: EMA (default), SMA, WMA, VWMA, SMMA, DEMA, TEMA, HullMA, ZEMA, TMA, SSMA
Play around with these to see some different effects.
The white line is the current close price.
Color 1 МАs: 2,3, 4, 5, 6, 7, 8, 9, 10, 11, 12, 13, 14, 15
Color 2 MAs: 17, 19, 21, 23, 25, 27, 29, 31, 33, 35, 37, 39, 41
Color 3 MAs: 44, 47, 50, 53, 56, 59, 62, 65, 68, 71, 74
Color 4 MAs: 78, 82, 86, 90, 94, 98, 102, 106, 110, 114, 118, 122
Color 5 MAs: 126, 131, 137, 143, 149, 155, 155, 161, 167, 173, 179, 185, 191, 197
You can more easily change the colors at the top of this source code instead of one by one in the settings.
If you want this on your main chart instead of a separate window you'll just need to change overlay=true in the study.
References & Thanks:
JustUncleL:
For the timeframe anchor, MA variants, and generally awesome work. This is more practical.
StickyCheeba:
For the idea.
Here's some shots to get an idea of the differences.
HullMA:
VWMA:
SSMA:
TMA:
Super Guppy MMA [MFWIC]I compiled the new and improved Guppy Multiple Moving Averages. Hope it has some value. Plan your trade and trade your plan!

Indicators: Rainbow Charts Oscillator, Binary Wave and MAsRainbow Charts, by Mel Widner, is a trend detector. It uses recursively smoothed MAs (remember, this idea was proposed back in 1997 -- it was certainly cool back then!) and also builds an oscillator out of the MAs. Oscillator bands indicate the stability range.
I have also included a simple binary wave based on whether all the MAs are in an upward slope or not. If you see any value above 0.5 there, the trend is definitely up (all MAs pointing up).
More info:
www.traders.com
Here's my complete list of indicators (With these 3, the total count should be above 100 now...will update the list later today)
