End Point Moving Average [EPMA]The End Point Moving Average was introduced in the October 95 issue of Technical Analysis of Stocks &
Commodities in the article "The End Point Moving Average", by Patrick E. Lafferty.
The Time Series Forecast takes this value and the slope of the regression line to forecast the next day and then plots this forecasted price as today's value.
For interpretation refer to Mr. Lafferty's article.
Please note
From line 10 starts my personal experemental modifications to this script, all above is original formula by Patrick E. Lafferty.
Moving

Momentum RibbonThe Momentum Ribbon is a collection of Moving Averages which indicate the severity of pull-backs in a given market.
As the ribbon spreads apart, it indicates more and more significant support/resistance for a trending market. As it is compressed back together, it displays a blue colour to indicate a "cooling" of trend momentum.
Adjustable Moving Average periods and types! You can customize the parameters of your ribbon to your heart's content!

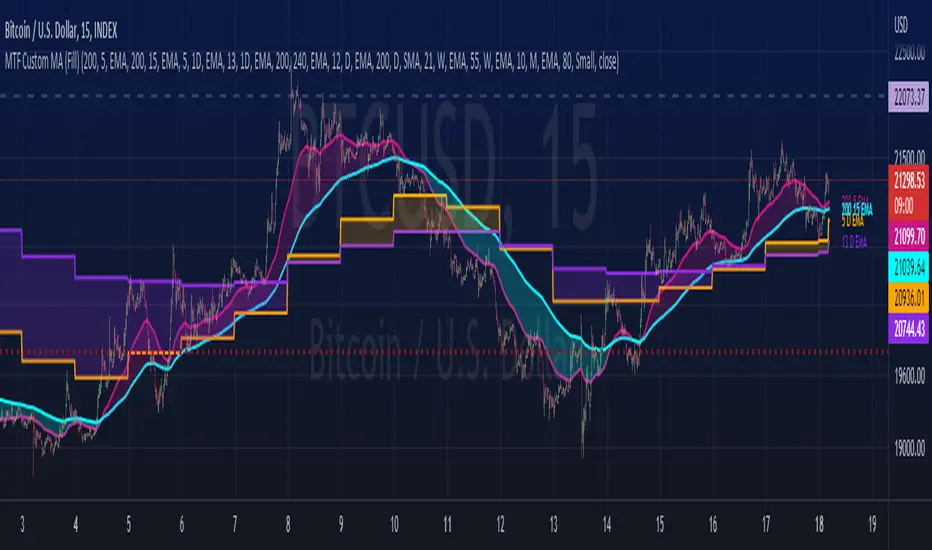
MTF Custom Moving AveragesThis user-friendly indicator allows up to 8 moving averages ( EMA or SMA ) from any timeframe, on any time frame. There are plenty of other MTF MA indicators, each with their own pros and cons. I wanted to make one without the cons:
- Independently set each MA to Exponential or Simple
- No preset lengths
- No preset timeframes
- Optional labels to help keep track of the period/length/type of each plot
- Clean, intuitive input layout
- More than enough MAs available to use one indicator for several use cases... just check/uncheck the ones that are relevant to each chart
Watch for death crosses on the 4hr while monitoring the "Bull Market Support band" (Weekly 21 EMA and 20 SMA ) and checking the Monthly 10 EMA for major support or resistance. Toggle between half of the available MAs for long term BTC trends and use the others for your alts. Use this one indicator to support multiple strategies.
Please leave a comment if you find it useful or have suggestions!
Inspired by the first MTF indicator I found: Weekly Moving Average by TommyTompsen.
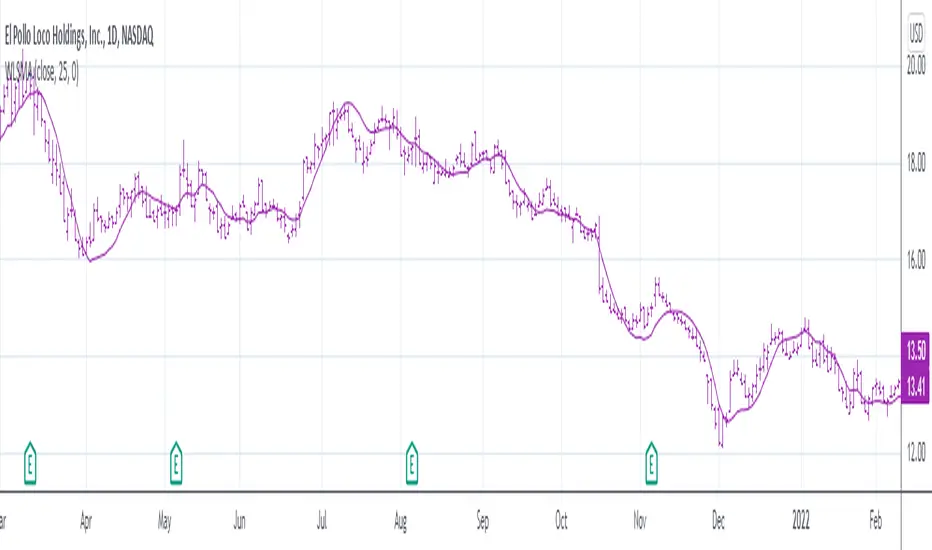
Weighted Least Squares Moving AverageLinearly Weighted Ordinary Least Squares Moving Regression
aka Weighted Least Squares Moving Average -> WLSMA
^^ called it this way just to for... damn, forgot the word
Totally pwns LSMA for some purposes here's why (just look up):
- 'realistically' the same smoothness;
- less lag;
- less overshoot;
- more or less same computationally intensive.
"Pretty cool, huh?", Bucky Roberts©, thenewboston
Now, would you please (just look down) and see the comparison of impulse & step responses:
Impulse responses
Step responses
Ain't it beautiful?
"Motivation behind the concept & rationale", by gorx1
Many been trippin' applying stats methods that require normally distributed data to time series, hence all these B*ll**** Bands and stuff don't really work as it should, while people blame themselves and buy snake oil seminars bout trading psychology, instead of using proper tools. Price... Neither population nor the samples are neither normally nor log-normally distributed. So we can't use all the stuff if we wanna get better results. I'm not talking bout passing each rolling window to a stat test in order to get the proper descriptor, that's the whole different story.
Instead we can leverage the fact that our data is time-series hence we can apply linear weighting, basically we extract another info component from the data and use it to get better results. Volume, range weighting don't make much sense (saying that based on both common sense and test results). Tick count per bar, that would be nice tho... this is the way to measure "intensity". But we don't have it on TV unfortunately.
Anyways, I'm both unhappy that no1 dropped it before me during all these years so I gotta do it myself, and happy that I can give smth cool to every1
Here is it, for you.
P.S.: the script contains standalone functions to calculate linearly weighted variance, linearly weighted standard deviation, linearly weighted covariance and linearly weighted correlation.
Good hunting
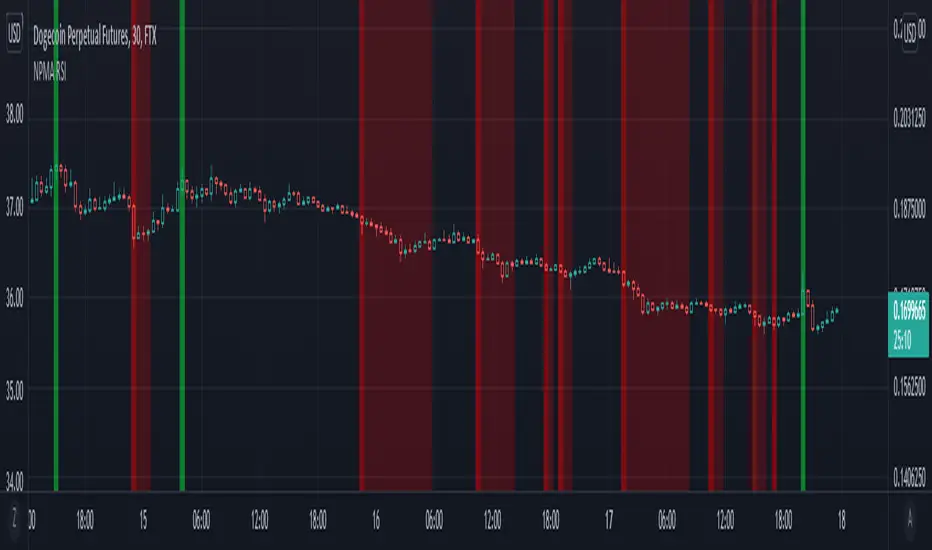
NPMA Relative Strength IndexRecently been amased by the potential of percentile nearest rank. You can apply this to almost any indicator to find extremes, this script might the simplest form of using it while being very powerful. The background will color green when the rsi is in the top percentage ranges of last X amount of bars. I'm currently searching optimal settings to apply this to a simple 3commas bot. Feel free to comment good settings and help the community out making profitable bots.
Moving average percent measureit's just an average moving multiplied by a percentage. this is good for measuring the acceleration of price movements

EMA Index Cross by Hassonya
While the indicator is working on any stock chart, it shows the two ema average breakdown/breakup of the index or any other stock with an arrow. In this way, you will be able to follow the ema intersections of the index chart while working on a normal stock chart.
I will add other moving average options if you like it.
I hope you will be satisfied using it.
TURKISH
------------
Gösterge, herhangi bir hisse senedi grafiği üzerinde çalışırken, endeksin veya başka bir hisse senedinin iki ema ortalama dağılımını/dökülmesini bir okla gösterir.
Bu sayede normal bir hisse senedi grafiği üzerinde çalışırken endeks grafiğinin ema kesişimlerini takip edebileceksiniz.
Eğer beğenirseniz başka ortalama seçenekleri de ekleyeceğim.
Güle güle kullanın.

MAROC Fast/SlowNot sure if a similar indicator already exist, so I created my own. After creating this indicator, I realize it looks very similar to MACD. However, it strictly uses Hull moving average in its calculation for the lines.
MAROC is simply Moving Average Rate of Change. This is a trend-following indicator that calculates the rate of change on two Hull moving averages. By default it calculates the ROC on 60-period HMA (green and red) and 180-period HMA (blue and orange). The zero line represents the confirmation of change in trend. Above zero is up trend and below zero is down trend. Note the difference between the "trend reversal" and the "confirmation of a trend". I like to define trend reversal by the change in direction
The colored squares on the zero line has 4 colors that represents the overall trend. Here I include the slowdown of MAROC as the start of a trend.
- bright green = when both the slow and fast MA are trending up
- faded green = when slow MA trending up, but fast MA trending down
- faded red = when slow MA trending down, but fast MA trending up
- bright red = when both the slow MA and fast MA are trending down
Trend changes triangles are shown to signal the change in trend direction (trend reversal). Green and blue triangles are trend reversal to the upside. Red and orange triangles are trend reversal to the downside.
This indicator includes the option of displaying buy(long) and sell(short) signals that follows these rules. Use at your own discretion, as it may not apply well with your market or ticker.
- Long = Bright green square and either fast or slow MAROC changes trend direction to the upside
- Short = Bright red square and either fast or slow MAROC changes trend direction to the downside
Enjoy~! Please let me know if you find this useful and which market / ticker and timeframe you are using it on~ :)

Fibonacci Moving AverageThe Fibonacci Moving Average is a powerful indicator that takes into account many underlying moving averages to give out an approximate short-term/long-term view of the markets. Its strength lies with dynamic support and resistance levels. I have created this indicator in order to improve trend-following entry positions.

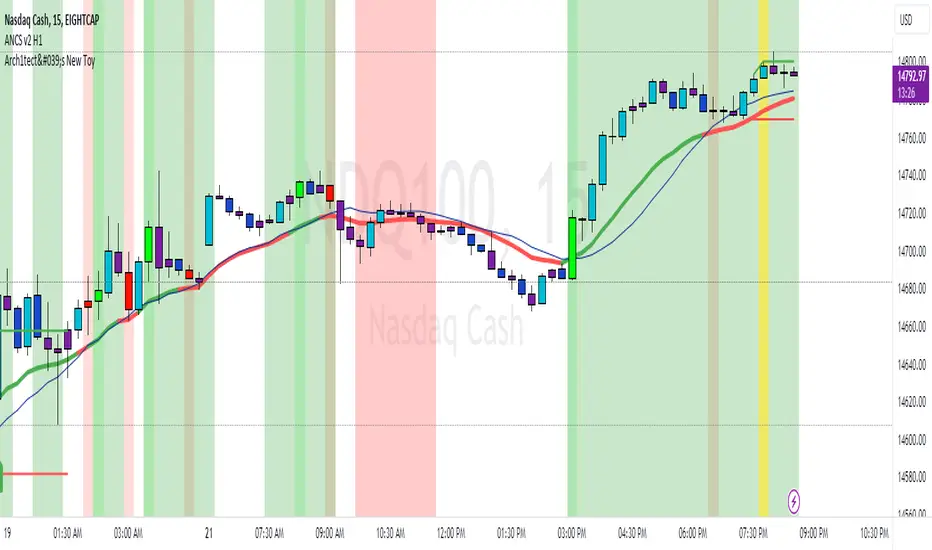
Arch1tect's New ToyDescription:
Arch1tect's New Toy tries to predict market trends by simply utilising 2 moving averages crossovers.
How it works:
Buy signals are triggered when the faster MA crosses over the slower MA from the downside to the upside.
Sell signals are triggered when the faster MA crosses under the slower MA from the upside to the downside.
How to use:
Take buys when buy signal is triggered AND close existing sell position
Take sells when sell signal is triggered AND close existing buy position
Note:
Settings are optimised for XAUUSD on the M1 chart.
Extra:
Alerts are included.
You can toggle between EMA , WMA and SMA to your liking.
Strategy Tester version:
Arch1tect's New Toy (Strategy Tester Version)Description:
The version of Arch1tect's New Toy indicator with Strategy Tester added.
This indicator tries to predict market trends by simply utilising 2 moving averages crossovers.
How it works:
Buy signals are triggered when the faster MA crosses over the slower MA from the downside to the upside.
Sell signals are triggered when the faster MA crosses under the slower MA from the upside to the downside.
How to use:
Take buys when buy signal is triggered AND close existing sell position
Take sells when sell signal is triggered AND close existing buy position
Note:
Settings are optimised for XAUUSD on the M1 chart.
Extra:
Alerts are included.
You can toggle between EMA, WMA and SMA to your liking.
Indicator version:

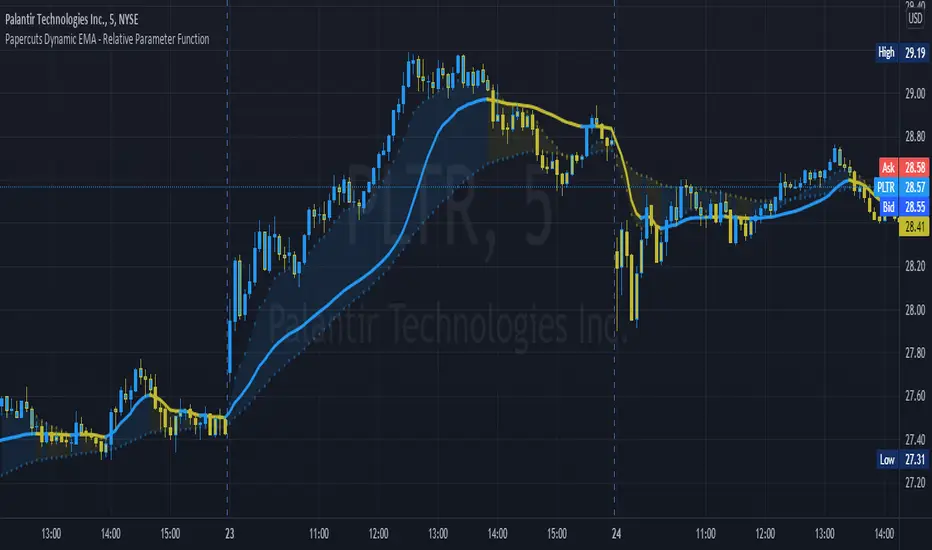
Papercuts Dynamic EMA - Relative Parameter FunctionThe goal of this is to link two parameters of different known low and high values so one affects the other.
In this case, I want to link Relative Volume to the length of an EMA, so it responds faster in times of high volume.
As an animator I am used to linking values in this way with Maya using a set driven key, took some work to figure it out in pine.
Looking up this concept, it has a few names, Relative values, linear interpolation, or rescale values.
Thanks to pinecoders for writing the EMA funciton that can accept length variables!
Here's a quick look at the root function to link the two values.
f_relativeVal(_source, in_bot, in_top, out_bot, out_top) =>
// float _source: input signal
// float in_bot : minimum range of input signal.
// float in_top : maximum range of input signal.
// float out_bot : minimum range of output signal.
// float out_top : maximum range of output signal.
clampSrc = _source > in_top ? in_top : _source < in_bot ? in_bot : _source //claps source to create a controlled range
//relInput = (clampSrc - in_bot) / (in_top - in_bot) * 100
inDiffIncrement = (in_top - in_bot)
outDiffIncrement = (out_top - out_bot)
out_bot + (clampSrc - in_bot) * outDiffIncrement / inDiffIncrement // rescale input range to output range
Complete MA DivisionThis indicator simply divides two moving averages and calculates the slope of the resulting curve to show when an asset's momentum is slowing down. The original idea was in a recent youtube video by Ben Cowen . His indicator didn't show the complete history of the moving average, so I wanted to try a little trick to get the moving averages at the beginning of time even when using a large moving average period. I accomplished this by counting the number off current bars using the cum() function. After the count is hit, the period will be constant.
Changing the curve smoothing will smooth the actual curve. Both moving average periods should be divisible by the curve smoothing.
Changing the slope smoothness will dictate when the slope is starting to slow down. Keep this high to break through the noise.
Start of Red = Good time to sell
Start of Green = Good time to buy
There is a weird issue with the smoothness of the line so just keep your moving averages divisible by the curve smoothing. I couldn't figure that issue out yet.

Trend System Multiple Moving Averages RatingThis is a trend system made with multiple moving averages designed especially for trending markets such as stocks or crypto.
It can be used with any timeframe.
Its made of multiple moving averages such as
Simple
Weighted
Volume Weighted
Exponential
Double EMA
Arnaud Legoux
Hull MA
Smoothed
Least Squares
Kaufman Adaptive
Triple EMA
Zero Lag
Fractal Adaptive
Variable Index Dynamic Average
Jurik Moving Average
Tillson
Triangular
Avg of all moving averages
It has also a rating, making an avg from all of the moving averages , going from -100 (all ma's are telling to go short ) to 100 ( all ma are telling to go long).
If you have any questions let me know !

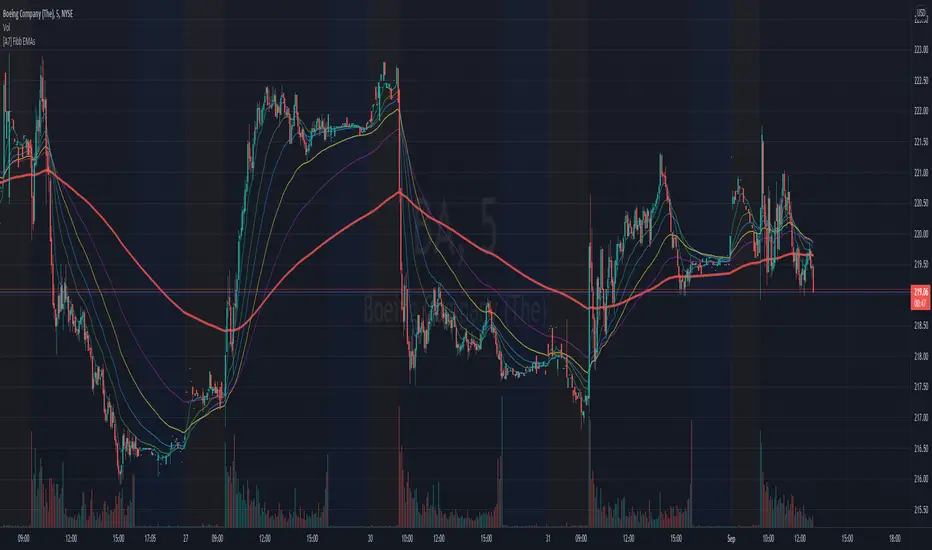
[A7] Fibonacci EMAs (8,21,34,55,89,233) Fibonacci EMAs (8,21,34,55,89,233)
Fibonacci Exponential Moving Averages
8 - aqua
21 - green
34 - blue
55 - yellow
89 - purple
233 - red
Moving Average Ribbon [TheBearFighter]
This code was written using:
•Pine Script Coding Conventions.
This script provides a very useful tool for new community users and professionals. It puts at your disposal a Moving Average Ribbon by hand to graph and easily find the ones with the highest performance. The creation of this script was motivated because in free TradingView accounts there is a limit of 3 indicators by chart, and with this tool you can draw up to 32 MA's at the same time!
Choose one of 10 types of MA´s:
•KAMA Kaufman's moving average.
•HULL Hull moving average.
•TEMA Triple exponencial moving average.
•LSMA Least square moving average.
•DEMA Double exponencial moving average.
•ALMA Arnaud Legoux moving average.
•WMA Weighted moving average
•EMA Exponencial moving average.
•VWMA Volume Weighted moving average.
•SMA Simple moving average.
Use the tooltips to know the lengths of MA´s.
A main characteristic of the script is that the lengths are in days but when changing the lowest timeframes, the same daily resolution is maintained. This gives us extreme precision in intraday timeframes, e.g 30 minutes.
Once this is understood, we can turning the MA´s on/off, and changing the timeframe to our liking.
Available timeframes: M, W, D, 4H, 1H, 30m, 15m, 5m.
Also the MA´s are colored for easy visualization and know if they grow or decrease.
Thank´s to @midtownsk8rguy to let me know more about HEX colors.
Thank´s to @HPotter for his KAMA.

Wide BarsSimple scripts show the wide range bars within in the look back period, visualizing the bigger momentum.
Added four exponential moving averages which define the trend of the instrument.
Wide range candles in the direction of overall trend on higher timeframes; give confluence of higher participation in the same direction.
Note : Decent volume above the average volume with wide range candle adds more value.

[Sidders] MACDEMASAR IndicatorCame across a cool idea for a strategy that couldn't find in the indicator database, so decided to code it up myself for your pleasure.
Indicators consists of 3 indicators: EMA(200) to determine the overall trend, and the MACD & Parabolic SAR to determine entries (and exits).
Long entry contains 4 conditions and is generated when price is above the 200EMA (1), the MACD crosses above the signal line (2), while they are both below 0 line (3) and when the parabolic SAR is below the closing price of the bar (4).
Short entry is build up the same but in reverse: price is below the 200EMA(1), signal line crosses below the MACD line (2), while they are both above the 0 line (3) and when the parabolic SAR is above the closing price of the bar (4).
Place the stoploss on the parabolic SAR dot below/above the candle that created the signal. Profit target 1:1 risk:reward ratio, but can ofcourse be changed according to your risk apetite. Might add automatically drawn SL/TPs in a later update.
Concept behind the strategy should work on all timeframes, but will require proper backtesting. I think with additional filters the strategy can also be way more finetuned and profitable, personally haven't had the time yet to dive into that.
Have also added alerts for your convenience.
Enjoy!

Tradingview ToolkitA new trader's biggest barrier to entry is lack of understanding where they are in terms of time and price and with tradingview free they are often limited to just 1 or 2 extra indicators as many new traders slap on RSI and MACD as 2/3 free ones. While these indicators are fine for trend analysis, its important to know where the price is in relation to time. Thus, this all-in-one script is meant to have a lot of customizable utility to save on indicator spots and act as a hotspot for many common needs.
-2 Sets of VWAP line w/ standard deviation bands with customizable timeframes.
-1 more customizable timeframe VWAP line (no std dev bands) to use as a long time frame reference
-Ability to plot previous VWAP close prices over current timeframe on all VWAP lines w/ basic color changing if price closes above/below
-2 Sets of Bollinger Bands with customizable source length and MA type
-3 customizable moving averages with custom timeframe/resolutions
-Inside candle barcolor repainter to easily notice if a candle was inside the range of the previous candle (price contraction)
Not meant to have everything on at once, but simply a place to enable and disable different things and save spots for more important things

Moving Average Slope AnalysisThis is a simple script which allows to do slope analysis on any kind of Moving Average. Simply change the moving average function that you wish to work with , in the script.
Slope analysis may be required for fine-tuning trade automation software , which uses Moving Average for determining optimum enter/exit point.
Read code comments for instructions!
Moving Average Buy/Sell IndicatorUsing a selected Exponential Moving Average (EMA)/Simple Moving Average (SMA) range, this indicator inserts a Long/Short (buy/sell) indicator overlaid on chart depending on the following conditions:
- LONG/BUY SIGNAL = if SMA value is less than EMA, and both the SMA and EMA are less than the current average price.
- SHORT/SELL SIGNAL = if SMA value is greater than EMA, and both the SMA and EMA are greater than the current average price.
**Intended for use with the 21 and 34 weekly moving average time range. Much more useful for long-term analysis rather than short-term analysis.**

Moving Average Crossover with Shading Signals This script uses 3 moving averages (2 simple moving averages and 1 exponential moving average ) to signal long and short opportunities based on moving average crossovers.
A long SMA (Signal SMA2) is used to determine longer term trend. When the EMA crosses above the Slow SMA1 and price is above the Signal SMA2. The space between the moving averages will shade green and the Signal SMA should also be green.
A sell signal occurs when the EMA crosses below the Slow SMA1 and price is below the Signal SMA2. The space between the moving averages will turn red and the Signal SMA should also be red.
A retracement, consolidation, or reversal may be occurring if the shaded color is yellow.
Use the identifying shapes to learn when to open or close positions.
