EMA/SMA Distance Percentage TableThis TradingView indicator, "EMA/SMA Distance Percentage Table," is designed to help traders and analysts quickly assess the current price's relationship to key Exponential Moving Averages (EMAs) and Simple Moving Averages (SMAs).
Here's a breakdown of what it does:
Calculates Multiple Moving Averages: It computes EMAs for lengths 10, 30, 50, and 200, and SMAs for lengths 50 and 200. These are commonly used moving averages in technical analysis.
Measures Percentage Distance: For each of these moving averages, it calculates the percentage difference between the current closing price and the moving average's value. This indicates how far, in percentage terms, the price has deviated from that average. A positive percentage means the price is above the MA, while a negative percentage means it's below.
Displays Data in a Table: All the calculated information (MA type and length, its current value, and the percentage distance) is presented in a clear, organized table on the chart. This allows for quick at-a-glance monitoring.
Customizable Visibility: Users have the flexibility to show or hide the plots of the EMAs and SMAs on the chart, as well as the entire data table, through the indicator's settings.
Purpose:
The primary purpose of this indicator is to provide a concise overview of price momentum and potential overbought/oversold conditions relative to various moving averages. Traders often use the distance from MAs to:
Identify Trend Strength: A large distance from a long-term MA might suggest a strong trend.
Spot Potential Reversals: If the price is significantly extended from an MA, it might indicate that a pullback or reversal is due.
Confirm Support/Resistance: Moving averages often act as dynamic support or resistance levels, and their distance can provide context.
In essence, it helps you quickly see if the price is "stretched" or "compressed" relative to its historical averages, which can be valuable for making trading decisions.
Moving Averages

Trend Band Oscillator📌 Trend Band Oscillator
📄 Description
Trend Band Oscillator is a momentum-based trend indicator that calculates the spread between two EMAs and overlays it with a volatility filter using a standard deviation band. It helps traders visualize not only the trend direction but also the strength and stability of the trend.
📌 Features
🔹 EMA Spread Calculation: Measures the difference between a fast and slow EMA to quantify short-term vs mid-term trend dynamics.
🔹 Volatility Band Overlay: Applies an EMA of standard deviation to the spread to filter noise and highlight valid momentum shifts.
🔹 Color-Based Visualization: Positive spread values are shown in lime (bullish), negative values in fuchsia (bearish) for quick directional insight.
🔹 Upper/Lower Bands: Help detect potential overbought/oversold conditions or strong trend continuation.
🔹 Zero Line Reference: A horizontal baseline at zero helps identify trend reversals and neutral zones.
🛠️ How to Use
✅ Spread > 0: Indicates a bullish trend. Consider maintaining or entering long positions.
✅ Spread < 0: Indicates a bearish trend. Consider maintaining or entering short positions.
⚠️ Spread exceeds bands: May signal overextension or strong momentum; consider using with additional confirmation indicators.
🔄 Band convergence: Suggests weakening trend and potential transition to a ranging market.
Recommended timeframes: 1H, 4H, Daily
Suggested complementary indicators: RSI, MACD, OBV, SuperTrend
✅ TradingView House Rules Compliance
This script is open-source and published under Pine Script v5.
It does not repaint, spam alerts, or cause performance issues.
It is designed as an analytical aid only and should not be considered financial advice.
All calculations are transparent, and no external data sources or insecure functions are used.
====================================================================
📌 Trend Band Oscillator
📄 설명 (Description)
Trend Band Oscillator는 두 개의 EMA 간 스프레드(차이)를 기반으로 한 모멘텀 중심의 추세 오실레이터입니다. 여기에 표준편차 기반의 변동성 밴드를 적용하여, 추세의 방향뿐 아니라 강도와 안정성까지 시각적으로 분석할 수 있도록 설계되었습니다.
📌 주요 특징 (Features)
🔹 EMA 기반 스프레드 계산: Fast EMA와 Slow EMA의 차이를 활용해 시장 추세를 정량적으로 표현합니다.
🔹 표준편차 필터링: Spread에 대해 EMA 및 표준편차 기반의 밴드를 적용해 노이즈를 줄이고 유효한 추세를 강조합니다.
🔹 컬러 기반 시각화: 오실레이터 값이 양수일 경우 초록색, 음수일 경우 마젠타 색으로 추세 방향을 직관적으로 파악할 수 있습니다.
🔹 밴드 범위 시각화: 상·하위 밴드를 통해 스프레드의 평균 편차 범위를 보여주며, 추세의 강약과 포화 여부를 진단할 수 있습니다.
🔹 제로 라인 표시: 추세 전환 가능 지점을 시각적으로 확인할 수 있도록 중심선(0선)을 제공합니다.
🛠️ 사용법 (How to Use)
✅ 오실레이터가 0 이상 유지: 상승 추세 구간이며, 롱 포지션 유지 또는 진입 검토
✅ 오실레이터가 0 이하 유지: 하락 추세 구간이며, 숏 포지션 유지 또는 진입 검토
⚠️ 상·하위 밴드를 이탈: 일시적인 과매수/과매도 혹은 강한 추세 발현 가능성 있음 → 다른 보조지표와 함께 필터링 권장
🔄 밴드 수렴: 추세가 약해지고 있음을 나타냄 → 변동성 하락 또는 방향성 상실 가능성 있음
권장 적용 시간대: 1시간봉, 4시간봉, 일봉
보조 적용 지표: RSI, MACD, OBV, SuperTrend 등과 함께 사용 시 신호 필터링에 유리
✅ 트레이딩뷰 하우스룰 준수사항 (TV House Rules Compliance)
이 지표는 **무료 공개용(Open-Source)**이며, Pine Script Version 5로 작성되어 있습니다.
과도한 리페인트, 비정상적 반복 경고(alert spam), 실시간 성능 저하 등의 요소는 포함되어 있지 않습니다.
사용자는 본 지표를 투자 결정의 참고용 보조 도구로 활용해야 하며, 독립적인 매매 판단이 필요합니다.
데이터 소스 및 계산 방식은 완전히 공개되어 있으며, 외부 API나 보안 취약점을 유발하는 구성 요소는 없습니다.

Daily 50‑ & 200‑SMA Ceiling Radar — EnhancedDescription:
This custom TradingView indicator, developed by Trader Malik and licensed under Trades Per Minute, is a powerful visual tool for identifying how price behaves relative to major daily moving averages — the 50-SMA and 200-SMA. It helps traders quickly understand key technical dynamics such as trend alignment, MA proximity, and short-term momentum sentiment — all displayed on a clean, minimal overlay with visual alerts and an adjustable data table.
FEATURES
1. Daily 50 & 200 Simple Moving Averages (SMA):**
- Displayed directly on the chart using distinct blue and orange lines.
- These serve as primary trend filters and support/resistance zones.
2. Price Highlighting:
- A red background flashes momentarily when the price crosses either the 50-SMA or 200-SMA.
- A green background fills the chart when price is above both MAs (bullish zone).
- A red background persists if price is below both MAs (bearish zone).
3. MA Gap Analysis Table:
- 50-SMA Row**: Shows % gap between 50-SMA and 200-SMA.
- 200-SMA Row**: Shows % gap between 200-SMA and 50-SMA.
- Sentiment Row**: Displays short-term trend bias based on the slope of the past 7 daily closes — Bullish, Neutral, or Bearish.
USER SETTINGS
Table Location: Choose between **Top Right** or **Bottom Right** of the chart.
Table Size: Select **Small**, **Medium**, or **Large** to suit screen preferences and layout aesthetics.
This script is **intellectual property of Trades Per Minute** and distributed by **Trader Malik** for use under licensing terms. Redistribution or repurposing without authorization is strictly prohibited.

VoVix DEVMA🌌 VoVix DEVMA: A Deep Dive into Second-Order Volatility Dynamics
Welcome to VoVix+, a sophisticated trading framework that transcends traditional price analysis. This is not merely another indicator; it is a complete system designed to dissect and interpret the very fabric of market volatility. VoVix+ operates on the principle that the most powerful signals are not found in price alone, but in the behavior of volatility itself. It analyzes the rate of change, the momentum, and the structure of market volatility to identify periods of expansion and contraction, providing a unique edge in anticipating major market moves.
This document will serve as your comprehensive guide, breaking down every mathematical component, every user input, and every visual element to empower you with a profound understanding of how to harness its capabilities.
🔬 THEORETICAL FOUNDATION: THE MATHEMATICS OF MARKET DYNAMICS
VoVix+ is built upon a multi-layered mathematical engine designed to measure what we call "second-order volatility." While standard indicators analyze price, and first-order volatility indicators (like ATR) analyze the range of price, VoVix+ analyzes the dynamics of the volatility itself. This provides insight into the market's underlying state of stability or chaos.
1. The VoVix Score: Measuring Volatility Thrust
The core of the system begins with the VoVix Score. This is a normalized measure of volatility acceleration or deceleration.
Mathematical Formula:
VoVix Score = (ATR(fast) - ATR(slow)) / (StDev(ATR(fast)) + ε)
Where:
ATR(fast) is the Average True Range over a short period, representing current, immediate volatility.
ATR(slow) is the Average True Range over a longer period, representing the baseline or established volatility.
StDev(ATR(fast)) is the Standard Deviation of the fast ATR, which measures the "noisiness" or consistency of recent volatility.
ε (epsilon) is a very small number to prevent division by zero.
Market Implementation:
Positive Score (Expansion): When the fast ATR is significantly higher than the slow ATR, it indicates a rapid increase in volatility. The market is "stretching" or expanding.
Negative Score (Contraction): When the fast ATR falls below the slow ATR, it indicates a decrease in volatility. The market is "coiling" or contracting.
Normalization: By dividing by the standard deviation, we normalize the score. This turns it into a standardized measure, allowing us to compare volatility thrust across different market conditions and timeframes. A score of 2.0 in a quiet market means the same, relatively, as a score of 2.0 in a volatile market.
2. Deviation Analysis (DEV): Gauging Volatility's Own Volatility
The script then takes the analysis a step further. It calculates the standard deviation of the VoVix Score itself.
Mathematical Formula:
DEV = StDev(VoVix Score, lookback_period)
Market Implementation:
This DEV value represents the magnitude of chaos or stability in the market's volatility dynamics. A high DEV value means the volatility thrust is erratic and unpredictable. A low DEV value suggests the change in volatility is smooth and directional.
3. The DEVMA Crossover: Identifying Regime Shifts
This is the primary signal generator. We take two moving averages of the DEV value.
Mathematical Formula:
fastDEVMA = SMA(DEV, fast_period)
slowDEVMA = SMA(DEV, slow_period)
The Core Signal:
The strategy triggers on the crossover and crossunder of these two DEVMA lines. This is a profound concept: we are not looking at a moving average of price or even of volatility, but a moving average of the standard deviation of the normalized rate of change of volatility.
Bullish Crossover (fastDEVMA > slowDEVMA): This signals that the short-term measure of volatility's chaos is increasing relative to the long-term measure. This often precedes a significant market expansion and is interpreted as a bullish volatility regime.
Bearish Crossunder (fastDEVMA < slowDEVMA): This signals that the short-term measure of volatility's chaos is decreasing. The market is settling down or contracting, often leading to trending moves or range consolidation.
⚙️ INPUTS MENU: CONFIGURING YOUR ANALYSIS ENGINE
Every input has been meticulously designed to give you full control over the strategy's behavior. Understanding these settings is key to adapting VoVix+ to your specific instrument, timeframe, and trading style.
🌀 VoVix DEVMA Configuration
🧬 Deviation Lookback: This sets the lookback period for calculating the DEV value. It defines the window for measuring the stability of the VoVix Score. A shorter value makes the system highly reactive to recent changes in volatility's character, ideal for scalping. A longer value provides a smoother, more stable reading, better for identifying major, long-term regime shifts.
⚡ Fast VoVix Length: This is the lookback period for the fastDEVMA. It represents the short-term trend of volatility's chaos. A smaller number will result in a faster, more sensitive signal line that reacts quickly to market shifts.
🐌 Slow VoVix Length: This is the lookback period for the slowDEVMA. It represents the long-term, baseline trend of volatility's chaos. A larger number creates a more stable, slower-moving anchor against which the fast line is compared.
How to Optimize: The relationship between the Fast and Slow lengths is crucial. A wider gap (e.g., 20 and 60) will result in fewer, but potentially more significant, signals. A narrower gap (e.g., 25 and 40) will generate more frequent signals, suitable for more active trading styles.
🧠 Adaptive Intelligence
🧠 Enable Adaptive Features: When enabled, this activates the strategy's performance tracking module. The script will analyze the outcome of its last 50 trades to calculate a dynamic win rate.
⏰ Adaptive Time-Based Exit: If Enable Adaptive Features is on, this allows the strategy to adjust its Maximum Bars in Trade setting based on performance. It learns from the average duration of winning trades. If winning trades tend to be short, it may shorten the time exit to lock in profits. If winners tend to run, it will extend the time exit, allowing trades more room to develop. This helps prevent the strategy from cutting winning trades short or holding losing trades for too long.
⚡ Intelligent Execution
📊 Trade Quantity: A straightforward input that defines the number of contracts or shares for each trade. This is a fixed value for consistent position sizing.
🛡️ Smart Stop Loss: Enables the dynamic stop-loss mechanism.
🎯 Stop Loss ATR Multiplier: Determines the distance of the stop loss from the entry price, calculated as a multiple of the current 14-period ATR. A higher multiplier gives the trade more room to breathe but increases risk per trade. A lower multiplier creates a tighter stop, reducing risk but increasing the chance of being stopped out by normal market noise.
💰 Take Profit ATR Multiplier: Sets the take profit target, also as a multiple of the ATR. A common practice is to set this higher than the Stop Loss multiplier (e.g., a 2:1 or 3:1 reward-to-risk ratio).
🏃 Use Trailing Stop: This is a powerful feature for trend-following. When enabled, instead of a fixed stop loss, the stop will trail behind the price as the trade moves into profit, helping to lock in gains while letting winners run.
🎯 Trail Points & 📏 Trail Offset ATR Multipliers: These control the trailing stop's behavior. Trail Points defines how much profit is needed before the trail activates. Trail Offset defines how far the stop will trail behind the current price. Both are based on ATR, making them fully adaptive to market volatility.
⏰ Maximum Bars in Trade: This is a time-based stop. It forces an exit if a trade has been open for a specified number of bars, preventing positions from being held indefinitely in stagnant markets.
⏰ Session Management
These inputs allow you to confine the strategy's trading activity to specific market hours, which is crucial for day trading instruments that have defined high-volume sessions (e.g., stock market open).
🎨 Visual Effects & Dashboard
These toggles give you complete control over the on-chart visuals and the dashboard. You can disable any element to declutter your chart or focus only on the information that matters most to you.
📊 THE DASHBOARD: YOUR AT-A-GLANCE COMMAND CENTER
The dashboard centralizes all critical information into one compact, easy-to-read panel. It provides a real-time summary of the market state and strategy performance.
🎯 VOVIX ANALYSIS
Fast & Slow: Displays the current numerical values of the fastDEVMA and slowDEVMA. The color indicates their direction: green for rising, red for falling. This lets you see the underlying momentum of each line.
Regime: This is your most important environmental cue. It tells you the market's current state based on the DEVMA relationship. 🚀 EXPANSION (Green) signifies a bullish volatility regime where explosive moves are more likely. ⚛️ CONTRACTION (Purple) signifies a bearish volatility regime, where the market may be consolidating or entering a smoother trend.
Quality: Measures the strength of the last signal based on the magnitude of the DEVMA difference. An ELITE or STRONG signal indicates a high-conviction setup where the crossover had significant force.
PERFORMANCE
Win Rate & Trades: Displays the historical win rate of the strategy from the backtest, along with the total number of closed trades. This provides immediate feedback on the strategy's historical effectiveness on the current chart.
EXECUTION
Trade Qty: Shows your configured position size per trade.
Session: Indicates whether trading is currently OPEN (allowed) or CLOSED based on your session management settings.
POSITION
Position & PnL: Displays your current position (LONG, SHORT, or FLAT) and the real-time Profit or Loss of the open trade.
🧠 ADAPTIVE STATUS
Stop/Profit Mult: In this simplified version, these are placeholders. The primary adaptive feature currently modifies the time-based exit, which is reflected in how long trades are held on the chart.
🎨 THE VISUAL UNIVERSE: DECIPHERING MARKET GEOMETRY
The visuals are not mere decorations; they are geometric representations of the underlying mathematical concepts, designed to give you an intuitive feel for the market's state.
The Core Lines:
FastDEVMA (Green/Maroon Line): The primary signal line. Green when rising, indicating an increase in short-term volatility chaos. Maroon when falling.
SlowDEVMA (Aqua/Orange Line): The baseline. Aqua when rising, indicating a long-term increase in volatility chaos. Orange when falling.
🌊 Morphism Flow (Flowing Lines with Circles):
What it represents: This visualizes the momentum and strength of the fastDEVMA. The width and intensity of the "beam" are proportional to the signal strength.
Interpretation: A thick, steep, and vibrant flow indicates powerful, committed momentum in the current volatility regime. The floating '●' particles represent kinetic energy; more particles suggest stronger underlying force.
📐 Homotopy Paths (Layered Transparent Boxes):
What it represents: These layered boxes are centered between the two DEVMA lines. Their height is determined by the DEV value.
Interpretation: This visualizes the overall "volatility of volatility." Wider boxes indicate a chaotic, unpredictable market. Narrower boxes suggest a more stable, predictable environment.
🧠 Consciousness Field (The Grid):
What it represents: This grid provides a historical lookback at the DEV range.
Interpretation: It maps the recent "consciousness" or character of the market's volatility. A consistently wide grid suggests a prolonged period of chaos, while a narrowing grid can signal a transition to a more stable state.
📏 Functorial Levels (Projected Horizontal Lines):
What it represents: These lines extend from the current fastDEVMA and slowDEVMA values into the future.
Interpretation: Think of these as dynamic support and resistance levels for the volatility structure itself. A crossover becomes more significant if it breaks cleanly through a prior established level.
🌊 Flow Boxes (Spaced Out Boxes):
What it represents: These are compact visual footprints of the current regime, colored green for Expansion and red for Contraction.
Interpretation: They provide a quick, at-a-glance confirmation of the dominant volatility flow, reinforcing the background color.
Background Color:
This provides an immediate, unmistakable indication of the current volatility regime. Light Green for Expansion and Light Aqua/Blue for Contraction, allowing you to assess the market environment in a split second.
📊 BACKTESTING PERFORMANCE REVIEW & ANALYSIS
The following is a factual, transparent review of a backtest conducted using the strategy's default settings on a specific instrument and timeframe. This information is presented for educational purposes to demonstrate how the strategy's mechanics performed over a historical period. It is crucial to understand that these results are historical, apply only to the specific conditions of this test, and are not a guarantee or promise of future performance. Market conditions are dynamic and constantly change.
Test Parameters & Conditions
To ensure the backtest reflects a degree of real-world conditions, the following parameters were used. The goal is to provide a transparent baseline, not an over-optimized or unrealistic scenario.
Instrument: CME E-mini Nasdaq 100 Futures (NQ1!)
Timeframe: 5-Minute Chart
Backtesting Range: March 24, 2024, to July 09, 2024
Initial Capital: $100,000
Commission: $0.62 per contract (A realistic cost for futures trading).
Slippage: 3 ticks per trade (A conservative setting to account for potential price discrepancies between order placement and execution).
Trade Size: 1 contract per trade.
Performance Overview (Historical Data)
The test period generated 465 total trades , providing a statistically significant sample size for analysis, which is well above the recommended minimum of 100 trades for a strategy evaluation.
Profit Factor: The historical Profit Factor was 2.663 . This metric represents the gross profit divided by the gross loss. In this test, it indicates that for every dollar lost, $2.663 was gained.
Percent Profitable: Across all 465 trades, the strategy had a historical win rate of 84.09% . While a high figure, this is a historical artifact of this specific data set and settings, and should not be the sole basis for future expectations.
Risk & Trade Characteristics
Beyond the headline numbers, the following metrics provide deeper insight into the strategy's historical behavior.
Sortino Ratio (Downside Risk): The Sortino Ratio was 6.828 . Unlike the Sharpe Ratio, this metric only measures the volatility of negative returns. A higher value, such as this one, suggests that during this test period, the strategy was highly efficient at managing downside volatility and large losing trades relative to the profits it generated.
Average Trade Duration: A critical characteristic to understand is the strategy's holding period. With an average of only 2 bars per trade , this configuration operates as a very short-term, or scalping-style, system. Winning trades averaged 2 bars, while losing trades averaged 4 bars. This indicates the strategy's logic is designed to capture quick, high-probability moves and exit rapidly, either at a profit target or a stop loss.
Conclusion and Final Disclaimer
This backtest demonstrates one specific application of the VoVix+ framework. It highlights the strategy's behavior as a short-term system that, in this historical test on NQ1!, exhibited a high win rate and effective management of downside risk. Users are strongly encouraged to conduct their own backtests on different instruments, timeframes, and date ranges to understand how the strategy adapts to varying market structures. Past performance is not indicative of future results, and all trading involves significant risk.
🔧 THE DEVELOPMENT PHILOSOPHY: FROM VOLATILITY TO CLARITY
The journey to create VoVix+ began with a simple question: "What drives major market moves?" The answer is often not a change in price direction, but a fundamental shift in market volatility. Standard indicators are reactive to price. We wanted to create a system that was predictive of market state. VoVix+ was designed to go one level deeper—to analyze the behavior, character, and momentum of volatility itself.
The challenge was twofold. First, to create a robust mathematical model to quantify these abstract concepts. This led to the multi-layered analysis of ATR differentials and standard deviations. Second, to make this complex data intuitive and actionable. This drove the creation of the "Visual Universe," where abstract mathematical values are translated into geometric shapes, flows, and fields. The adaptive system was intentionally kept simple and transparent, focusing on a single, impactful parameter (time-based exits) to provide performance feedback without becoming an inscrutable "black box." The result is a tool that is both profoundly deep in its analysis and remarkably clear in its presentation.
⚠️ RISK DISCLAIMER AND BEST PRACTICES
VoVix+ is an advanced analytical tool, not a guarantee of future profits. All financial markets carry inherent risk. The backtesting results shown by the strategy are historical and do not guarantee future performance. This strategy incorporates realistic commission and slippage settings by default, but market conditions can vary. Always practice sound risk management, use position sizes appropriate for your account equity, and never risk more than you can afford to lose. It is recommended to use this strategy as part of a comprehensive trading plan. This was developed specifically for Futures
"The prevailing wisdom is that markets are always right. I take the opposite view. I assume that markets are always wrong. Even if my assumption is occasionally wrong, I use it as a working hypothesis."
— George Soros
— Dskyz, Trade with insight. Trade with anticipation.

TRIPLE Moving AveragesThis Pine Script indicator plots three customizable moving averages (MAs) along with an optional composite MA (average of all three). It provides visual cues, alerts, and trend confirmation based on MA crossovers and price positioning relative to the MAs.
🔹 Key Features
1. Multiple Moving Average Types
Supports 7 different MA types for each line:
EMA (Exponential Moving Average)
SMA (Simple Moving Average)
SMMA / RMA (Smoothed / Regular Moving Average)
WMA (Weighted Moving Average)
VWMA (Volume Weighted Moving Average)
HMA (Hull Moving Average)
2. Three Independent MAs
MA1, MA2, MA3 can each be enabled/disabled
Custom lengths (default: 12, 21, 50)
Different price sources (close, open, high, low, etc.)
3. Composite Moving Average (Optional)
Calculates (MA1 + MA2 + MA3) / 3
Acts as a consensus trend filter
4. Visual & Alert Features
✅ Color-Coded Lines (Yellow = Price Above MA, Red = Price Below MA)
✅ Thick Line Width (3) for better visibility
✅ Background Highlights for crossovers/crossunders
✅ Alerts for All Crossover Combinations
🔹 How It Works
📈 MA Crossovers & Trend Signals
Bullish Signal: When a faster MA crosses above a slower MA
Bearish Signal: When a faster MA crosses below a slower MA
Trend Confirmation: All MAs aligned in the same direction (e.g., MA1 > MA2 > MA3 = Strong Uptrend)
🎨 Visual Indicators
Green Background → Bullish crossover detected
Red Background → Bearish crossover detected
Yellow Line → Price is above the MA (bullish)
Red Line → Price is below the MA (bearish)
🔔 Alert Conditions
Alerts are triggered for all possible MA crossover combinations, including:
MA1 crossing MA2
MA1 crossing MA3
MA2 crossing MA3
Any MA crossing the Composite MA

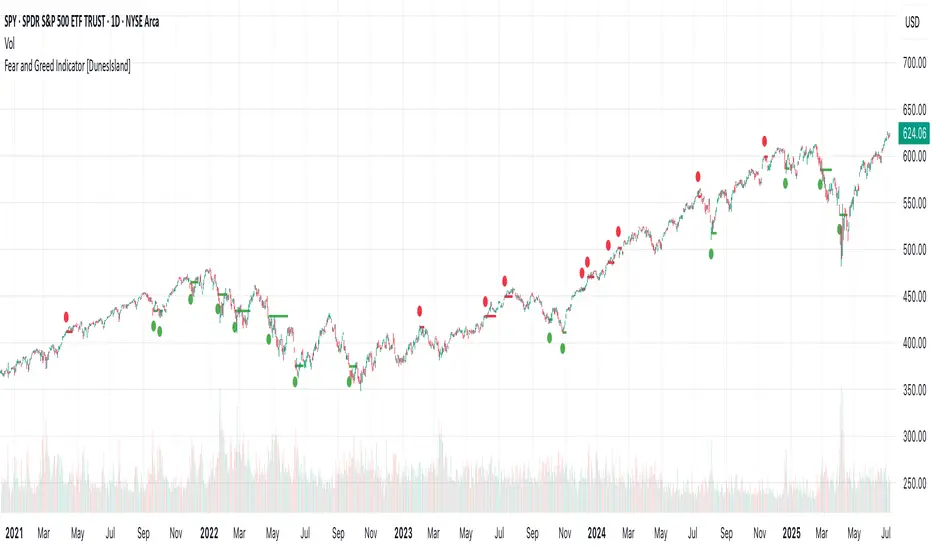
Fear and Greed Indicator [DunesIsland]The Fear and Greed Indicator is a TradingView indicator that measures market sentiment using five metrics. It displays:
Tiny green circles below candles when the market is in "Extreme Fear" (index ≤ 25), signalling potential buys.
Tiny red circles above candles when the market is in "Greed" (index > 75), indicating potential sells.
Purpose: Helps traders spot market extremes for contrarian trading opportunities.Components (each weighted 20%):
Market Momentum: S&P 500 (SPX) vs. its 125-day SMA, normalized over 252 days.
Stock Price Strength: Net NYSE 52-week highs (INDEX:HIGN) minus lows (INDEX:LOWN), normalized.
Put/Call Ratio: 5-day SMA of Put/Call Ratio (USI:PC).
Market Volatility: VIX (VIX), inverted and normalized.
Stochastic RSI: 14-period RSI on SPX with 3-period Stochastic SMA.
Alerts:
Buy: Index ≤ 25 ("Extreme Fear - Potential Buy").
Sell: Index > 75 ("Greed - Potential Sell").
EMA-Pack MTFEMA-Pack MTF
This TradingView Pine Script defines a custom indicator called "EMA-Pack MTF" that overlays various types of moving averages and Bollinger Bands across multiple timeframes on a chart. It begins by importing the built-in technical analysis library and defining a custom ma function that calculates several types of moving averages (SMA, EMA, TEMA, DEMA, HMA, and ALMA) based on user input. The ema function is the core logic, retrieving market data for the specified timeframe and calculating fast, mid, slow, 50, 100, and 200-period moving averages along with Bollinger Band components (basis, upper, and lower bands). The function adjusts values to the nearest valid price tick and returns them.
User input fields allow customization of timeframes, source data, moving average types, and Bollinger Band parameters. The script calls the ema function for each selected timeframe (1 minute, 5 minutes, 15 minutes, 1 hour, 4 hours, and 1 day), storing their respective computed values. It then plots the calculated moving averages and Bollinger Band basis lines on the chart, using different colors and line widths to distinguish between them. Some plots are hidden by default (display.none) to reduce chart clutter. This script is useful for multi-timeframe trend analysis using customizable moving averages and Bollinger Bands.

Super Neema!🟧 Super Neema! — Multi-Timeframe EMA-9 Overlay
🔍 What is "Neema"?
The term "Neema" has recently emerged among traders such as Jeff Holden—a top proprietary trading firm trader—whose colleagues colloquially use "Neema" as shorthand for the 9-period Exponential Moving Average (EMA). Due to its increasing popularity and reliability, the phrase caught on quickly as traders needed a quick, memorable name for such an essential tool.
📚 Why the 9-EMA?
Scalping around the 9-EMA is now one of the most widely used intraday trading techniques. Traders of various experience levels frequently rely on it because it effectively highlights short-term momentum shifts.
But there's a crucial nuance: traders across different assets or market periods don't always agree on which timeframe’s 9-EMA to follow. Depending on who's currently active in the market, the dominant "Neema" could be the 1-minute, 2-minute, 3-minute, or 5-minute 9-EMA. This variation arises naturally due to differences in trader populations, risk tolerance, style, and current market conditions.
👥 Social Convention & Normative Social Influence
Trading is fundamentally a social activity, and normative social influence plays a critical role in market behavior. Traders don’t operate in isolation; they follow patterns, respond to cues, and rely on shared conventions. The popularity of any given indicator—like the 9-EMA—is not just technical, but deeply social. Traders adapt to what's socially accepted, recognizable, and effective.
Over time, these conventions shift. What once was "the standard" timeframe can subtly evolve as dominant traders or institutions shift their preferred style or timeframe, creating "variants" of established trends. Understanding this dynamic is essential for market participants because recognizing where the majority of traders currently focus gives a critical edge.
📈 Why Does This Matter? (Market Evolution & Trader Adaptability)
Market trends aren't just technical—they're social constructs. As markets evolve, participants adapt their methods to fit new norms. Traders who recognize and adapt quickly to these evolving norms gain a decisive advantage.
By clearly visualizing multiple Neemas (9-EMAs across timeframes) simultaneously, you don't merely see EMA levels—you visually sense the current social convention of the market. This heightened awareness helps you stay adaptive and flexible, aligning your strategy dynamically with the broader community of traders.
🎨 Transparency Scheme (Visual Identification):
5-minute Neema: Most opaque, brightest line (slowest, most significant trend)
3-minute Neema: Slightly more transparent
2-minute Neema: Even more transparent
1-minute Neema: Most transparent, subtle background hint (fastest, quickest reaction)
This deliberate visual hierarchy makes it intuitive to identify immediately which timeframe is currently dominant, and therefore, which timeframe other traders are using most actively.
✅ Works on:
Any timeframe, any chart. Automatically plots the 1m–5m EMA-9 lines regardless of your current chart.
🧠 Key Insight:
Markets are driven by social trends and normative influence.
Identifying the currently dominant timeframe (the Neema most respected by traders at that moment) is a powerful, socially-informed edge.
Trader adaptability isn't just technical—it's social awareness in action.
Enjoy your trading, and welcome to Super Neema! ⚡

MA Crossover Strategy with TP/SL (5 EMA Filter)How the Strategy Works on a 5-Minute Chart:
Data Input (5-Minute Candles):
Every single data point (candle) on your chart will represent 5 minutes of price action (Open, High, Low, Close for that 5-minute period).
All calculations (MAs, EMA, signals) will be based on these 5-minute price data points.
Moving Average Calculations:
Fast MA (10-period SMA): This will be the Simple Moving Average of the closing prices of the last 10 five-minute candles. It reacts relatively quickly to recent price changes.
Slow MA (30-period SMA): This will be the Simple Moving Average of the closing prices of the last 30 five-minute candles. It represents a slightly longer-term trend compared to the Fast MA.
5 EMA (5-period EMA): This is the Exponential Moving Average of the closing prices of the last 5 five-minute candles. Being an EMA, it gives more weight to the most recent 5-minute prices, making it very responsive to immediate price action.
Signal Generation (Entry Conditions):
Long Entry Signal:
The 10-period SMA crosses above the 30-period SMA (indicating a potential bullish shift in the short-to-medium term trend).
AND the current 5-minute candle's closing price is above the 5-period EMA (confirming that the immediate price momentum is also bullish and supporting the crossover).
If both conditions are met at the close of a 5-minute candle, a "Buy" signal is generated.
Short Entry Signal:
The 10-period SMA crosses below the 30-period SMA (indicating a potential bearish shift).
AND the current 5-minute candle's closing price is below the 5-period EMA (confirming immediate bearish momentum).
If both conditions are met at the close of a 5-minute candle, a "Sell" signal is generated.
Trade Execution:
When a signal is triggered, the strategy enters a trade (long or short) at the closing price of that 5-minute candle.
Immediately upon entry, it places two contingent orders:
Take Profit (Target): Set at 2% (by default) away from your entry price. For a long trade, it's 2% above; for a short trade, 2% below.
Stop Loss: Set at 1% (by default) away from your entry price. For a long trade, it's 1% below; for a short trade, 1% above.
The trade will remain open until either the Take Profit or Stop Loss price is hit by subsequent 5-minute candles.
Implications for Trading on a 5-Minute Chart:
Increased Trade Frequency: You will likely see many more signals and trades compared to higher timeframes (like 1-hour or daily charts). This means more potential opportunities but also more transaction costs (commissions, slippage).
Sensitivity to Noise: Lower timeframes are more prone to "market noise" – small, random price fluctuations that don't indicate a true trend. While the 5 EMA filter helps, some false signals might still occur.
Faster Price Action: Price movements can be very rapid on a 5-minute chart. Your take profit or stop loss levels might be hit very quickly, sometimes within the same or next few candles.
Parameter Optimization is Crucial: The default MA lengths (10, 30) and EMA (5) might not be optimal for every asset or market condition on a 5-minute chart. You'll need to backtest extensively and potentially adjust these lengths, as well as the targetPerc and stopPerc, to find what works best for the specific instrument you're trading.
Risk Management: The fixed percentage stop loss is vital on a 5-minute chart due to its volatility. Without it, a few unfavorable moves could lead to significant losses.

WRAMA Channel (Weighted RSI ATR MA)OVERVIEW
The WRAMA Channel (Weighted RSI ATR MA) is an advanced technical analysis tool designed to react more quickly to price movements compared to indicators using conventional moving averages. It combines the Relative Strength Index (RSI), Average True Range (ATR), and a weighted moving average, resulting in the WRAMA. This indicator forms a dynamic price channel based on a weighted average that incorporates both trend strength (via RSI) and market volatility (via ATR). It helps traders identify trends, potential reversals, and breakout signals, while offering broad customization options.
Key Features
WRAMA Price Channel:
Generates a dynamic channel around the weighted moving average (WRAMA), adapting to market volatility and momentum, similar to Bollinger Bands. Users are encouraged to adjust channel width and length according to their strategy.
The upper and lower channel bands are calculated based on a percentage deviation from the baseline line.
The channel fill color changes depending on the price's position relative to the baseline (green above, red below), with an optional gradient for better visualization.
Weighted Moving Average (WRAMA):
WRAMA is a custom weighted moving average (MA1), where closing prices are weighted based on RSI and ATR, allowing it to dynamically adapt to market conditions.
Baseline: The WRAMA line calculated over a user-defined period.
WRAMA Calculation:
RSI Weight: Based on RSI value. When RSI is in extreme zones (below the lower threshold or above the upper threshold), an extreme weight is applied. Otherwise, the weight is based on the squared RSI value divided by 100, raised to a power defined by the rsi_weight_factor.
ATR Weight: Based on the ATR-to-average-ATR ratio. If ATR exceeds a threshold (atr_threshold × avg_atr), an extreme weight is applied. Otherwise, the weight is based on the squared ratio of ATR to average ATR, raised to the power of the atr_weight_factor.
Combined Weight: RSI and ATR weights are combined using a rsi_atr_balance parameter. Final weight = RSI weight × balance + ATR weight × (1 - balance).
WRAMA Calculation: The closing price is multiplied by the combined weight. The result is averaged over the ma_length period and divided by the average of the weights, forming the WRAMA line. For current WRAMA (ma_length = 1), the calculation simplifies to a single weighted price.
Additional Moving Averages:
For additional confirmations, the indicator supports up to five moving averages (MA1–MA5) with various types (SMA, EMA, WMA, HMA, ALMA) and customizable periods.
All additional MAs are calculated based on WRAMA or its baseline, ensuring consistency and enabling deeper analysis within a unified methodology. MA trend directions can be tracked in a built-in signal table.
Trading Signals:
Breakout Signals: Breakouts above/below the channel are optionally marked with triangle shapes (green for bullish, red for bearish).
MA Signals: Price position relative to MAs or their slope generates bullish/bearish signals. These are optionally visualized with default triangles (green up, red down).
A signal table in the top-right corner summarizes the status of each moving average – bullish, bearish, or neutral.
Customization Options
Channel Settings:
MA Period: Length of the WRAMA baseline (default: 100).
Channel Deviation : Percentage offset from the baseline for upper/lower bands (default: 1.5%).
RSI Settings:
RSI Period: Length of the RSI calculation (default: 14).
RSI Upper/Lower Threshold: Overbought/oversold levels (default: 70/30).
RSI Weight Factor: Influence of RSI on weighting (default: 2.0).
ATR Settings:
ATR Period: ATR calculation length (default: 14).
ATR Threshold: Volatility threshold as a multiple of average ATR (default: 1.5).
ATR Weight Factor: Influence of ATR on weighting (default: 2.0).
RSI & ATR Combined:
Extreme Weight: Weight applied in extreme RSI/ATR conditions (default: 3.0).
RSI/ATR Balance: Balance between RSI and ATR influence (default: 0.5).
Signal Settings:
Show Breakout Signals: Enable/disable breakout triangles.
Show MA Signals: Enable/disable MA-based signals.
MA Signal Source: Choose between current WRAMA or baseline.
MA Signal Analysis: Based on price position or slope.
Neutral Threshold : Minimum distance from MA for signal neutrality (default: 0.5%).
Minimum MA Slope : Minimum slope for trend direction signals (default: 0.01%).
Moving Averages (MA1–MA5):
Options to enable/disable, select type (SMA, EMA, WMA, HMA, ALMA), set period length, and choose color.
Style Settings:
Gradient Fill: Enable/disable gradient coloring within the channel.
Show Baseline: Enable/disable WRAMA baseline visibility.
Colors: Customize line, fill, and signal colors.
Use Cases
Trend Identification: The WRAMA channel highlights trend direction and potential reversal zones when price contacts the channel edges.
Breakout Signals: Channel breakouts may indicate trend shifts or momentum surges.
MA Analysis: The signal table provides a clear summary of market direction (bullish, bearish, or neutral) based on selected moving averages.
Trading Strategies: Suitable for trend-following, mean-reversion, and scalping strategies, depending on user preferences and settings.
Notes
The indicator offers a high degree of flexibility, making it adaptable to various trading styles, instruments, and timeframes.
It is recommended to adjust channel length and width to fit your trading strategy.
Backtesting settings on historical data is advised to optimize parameters for a specific strategy and market.

Multi SMA AnalyzerMulti SMA Analyzer with Custom SMA Table & Advanced Session Logic
A feature-rich SMA analysis suite for traders, offering up to 7 configurable SMAs, in-depth trend detection, real-time table, and true session-aware calculations.
Ideal for those who want to combine intraday, swing, and higher-timeframe trend analysis with maximum chart flexibility.
Key Features
📊 Multi-SMA Overlay
- 7 SMAs (default: 5, 20, 50, 100, 200, 21, 34)—individually configurable (period, source, color, line style)
- Show/hide each SMA, custom line style (solid, stepline, circles), and color logic
- Dynamic color: full opacity above SMA, reduced when below
⏰ Session-Aware SMAs
- Each SMA can be calculated using only user-defined session hours/days/timezone
- “Ignore extended hours” option for accurate intraday trend
📋 Smart Data Table
- Live SMA values, % distance from price, and directional arrows (↑/↓/→)
- Bull/Bear/Sideways trend classification
- Custom table position, size, colors, transparency
- Table can run on chart or custom (higher) timeframe for multi-TF analysis
🎯 Golden/Death Cross Detection
- Flexible crossover engine: select any two from (5, 10, 20, 50, 100, 200) for fast/slow SMA cross signals
- Plots icons (★ Golden, 💀 Death), optional crossover labels with custom size/colors
🏷️ SMA Labels
- Optional on-chart SMA period labels
- Custom placement (above/below/on line), size, color, offset
🚨 Signal & Trend Engine
- Bull/Bear/Sideways logic: price vs. multiple SMAs (not just one pair)
- Volume spike detection (2x 20-period SMA)
- Bullish engulfing candlestick detection
- All signals can use chart or custom table timeframe
🎨 Visual Customization
- Dynamic background color (Bull: green, Bear: red, Neutral: gray)
- Every visual aspect is customizable: label/table colors, transparency, size, position
🔔 Built-in Alerts
- Crossovers (SMA20/50, Golden/Death)
- Bull trend, volume spikes, engulfing pattern—all alert-ready
How It Works
- Session Filtering:
- SMAs can be set to count only bars from your chosen market session, for true intraday/trading-hour signals
Dynamic Table & Signals:
- Table and all signal logic run on your selected chart or custom timeframe
Flexible Crossover:
- Choose any pair (5, 10, 20, 50, 100, 200) for cross detection—SMA 10 is available for crossover even if not shown as an SMA line
Everything is modular:
- Toggle features, set visuals, and alerts to your workflow
🚨 How to Use Alerts
- All key signals (crossovers, trend shifts, volume spikes, engulfing patterns) are available as alert conditions.
To enable:
- Click the “Alerts” (clock) icon at the top of TradingView.
- Select your desired signal (e.g., “Golden Cross”) from the condition dropdown.
- Set your alert preferences and create the alert.
- Now, you’ll get notified automatically whenever a signal occurs!
Perfect For
- Multi-timeframe and swing traders seeking higher timeframe SMA confirmation
- Intraday traders who want to ignore pre/post-market data
- Anyone wanting a modern, powerful, fully customizable multi-SMA overlay
// P.S: Experiment with Golden Cross where Fast SMA is 5 and Slow SMA is 20.
// Set custom timeframe for 4 hr while monitoring your chart on 15 min time frame.
// Enable Background Color and Use Table Timeframe for Background.
// Uncheck Pine labels in Style tab.
Clean, open-source, and loaded with pro features—enjoy!
Like, share, and let me know if you'd like any new features added.

Relative StrengthDescription:
This indicator provides a simplified yet powerful method for measuring a stock's momentum based on its proximity to its recent high. It is a direct implementation of a trading concept discussed in a lecture from the New York Institute of Finance.
Core Concept
The underlying theory, supported by academic research, is that a stock making a new high is one of the most bullish signals possible. Such stocks have a statistical tendency to continue making new highs in the near term.
Instead of requiring complex relative strength calculations against a universe of stocks, this indicator uses a simple and elegant ratio to act as a proxy for momentum:
Indicator Value = Current Close / Highest High of Lookback Period
A value approaching 1.0 indicates the stock is strong and nearing a new high. A value at 1.0 means a new high has just been made.
How to Use This Indicator
The indicator consists of two primary components:
RS Line (Teal): The core momentum calculation (Close / High).
Signal MA (Orange): A moving average of the NHRS Line, which acts as the trigger for signals.
The signals are generated based on the crossover between these two lines:
BUY Signal: When the RS Line crosses ABOVE its moving average. This suggests that short-term momentum is accelerating and a new uptrend may be starting. The background will turn green.
SELL Signal: When the RS Line crosses BELOW its moving average. This indicates that momentum is fading and it may be prudent to exit the position to avoid a decline. The background will turn red.
Indicator Settings
You can customize the indicator to fit your trading style and the timeframe you are analyzing:
High Lookback Period: Choose the period for the "Highest High" calculation. Options range from 1 Month to 12 Months (52 weeks), allowing you to measure short-term or long-term strength.
Moving Average Length: Adjust the length of the signal line's moving average. The lecturer defaults to 26 weeks for a six-month view.
Moving Average Type: Select the type of moving average for the signal line (SMA, EMA, WMA, HMA).
Credits and Inspiration
Proper credit is essential. This script is a practical application of a concept that builds upon foundational academic work.
The core idea that a stock's proximity to its 52-week high is an investable anomaly was detailed in the 2004 Journal of Finance paper:
"The 52 Week High and Momentum Investing" by Thomas J. George and Chuan-Yang Hwang.
The lecturer's contribution, which this script implements, was to simplify this concept into an actionable trading tool by applying a moving average crossover to generate clear and objective buy and sell signals.
Disclaimer: This tool is for educational and informational purposes only. It is not financial advice. All trading involves risk, and you should always perform your own research and backtesting before making any trading decisions.

5 EMA STRATEGY by Power of Stocks(StockYogi)5 EMA STRATEGY by Power of Stocks(StockYogi)
This is a 5 EMA Breakout Strategy inspired by the trading principles taught by Shubhashi Pani, founder of the Power of Stocks (POS) community.
The strategy is designed to:
• Detect breakout setups when price breaks the high/low of a signal candle (based on EMA conditions)
• Enter trades only if the breakout occurs within the next 3 candles
• Allow multiple trades in the same direction without closing the earlier one
• Use independent stop-loss (SL) and take-profit (TP) targets for each trade based on a user-defined risk-reward ratio
• Optionally enter trades only at candle close
• Optionally avoid trades during a custom time window (e.g., 3:00 PM to 3:30 PM IST)
• Optionally close all open positions at a defined time (e.g., 3:30 PM IST)
The goal of this strategy is to provide greater flexibility and realism for intraday or short-term traders following structured breakout systems.
Disclaimer: This script is an implementation of technical ideas for educational purposes only. It is not financial advice. All trading involves risk, and past performance does not guarantee future results.
Strategy Credits:
This strategy is based on publicly known breakout rules taught by Shubhashi Pani (Power of Stocks). This is not an official POS script, and I am not affiliated with the Power of Stocks team. This implementation was developed independently to follow the logic shared for educational use.
Feel free to use, backtest, and modify according to your needs. Constructive feedback is welcome!

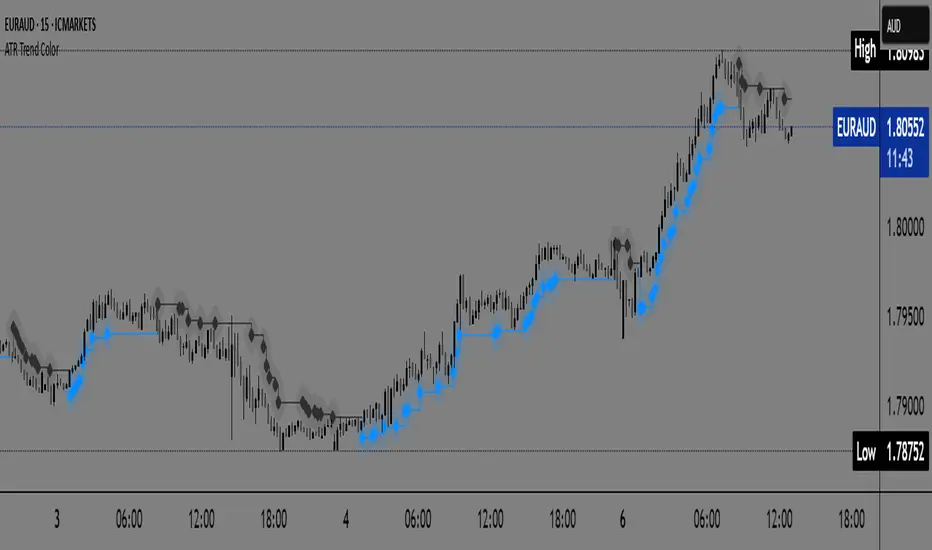
ATR Trend Color📌 ATR Trend Color — Visually clean trend-following tool based on adaptive ATR trailing stop
► Description
ATR Trend Color is a simple yet powerful indicator designed to visually identify and follow the market trend using an adaptive ATR-based trailing stop. Its main advantage lies in clarity — it uses just a single line that dynamically changes color based on trend direction:
✅ Blue line indicates price is above the trailing stop (bullish trend).
🔻 Black line indicates price is below the trailing stop (bearish trend).
This clean display allows for instant trend recognition and potential exit or reversal zones.
► How it works
The indicator uses the Average True Range (ATR) to calculate a dynamic trailing stop level. ATR measures volatility and adjusts the trailing line to match current market conditions:
When the price rises, the line moves up and acts as dynamic support.
When the price drops, the line moves down and acts as resistance.
This behavior makes it ideal for trend following and volatility-adjusted stop-loss placement.
► Key Features:
✅ Clean chart with just one ATR trailing line
✅ Dynamic color changes in real-time
✅ Great for trend confirmation and management
✅ Customizable ATR period and multiplier
✅ Step line with diamonds for high visual clarity
► How to use
Add the indicator to your chart.
Adjust ATR period and multiplier to your strategy (default: ATR 7 / multiplier 3.1).
Follow the line color:
Blue: Bullish trend — may signal to stay in long positions.
Black: Bearish trend — may suggest exit or short entries.
► Originality
Unlike typical ATR trailing stop indicators that display two lines or static colors, ATR Trend Color simplifies visualization by using a single smart line with real-time visual feedback on trend direction.
Additionally, it uses the “Step line with diamonds” display mode to enhance readability in fast or noisy markets.
Crypto Narratives: Relative Strength V2Simple Indicator that displays the relative strength of 8 Key narratives against BTC as "Spaghetti" chart. The chart plots an aggregated RSI value for the 5 highest Market Cap cryopto's within each relevant narrative. The chart plots a 14 period SMA RSI for each narrative.
Functionality:
The indicator calculates the average RSI values for the current leading tokens associated with ten different crypto narratives:
- AI (Artificial Intelligence)
- DeFi (Decentralized Finance)
- Memes
- Gaming
- Level 1 (Layer 1 Protocols)
- AI Agents
- Storage/DePin
- RWA (Real-World Assets)
- BTC
Usage Notes:
The 5 crypto coins should be regularly checked and updated (in the script) by overtyping the current values from Rows 24 - 92 to ensure that you are using the up to date list of highest marketcap coins (or coins of your choosing).
The 14 period SMA can be changed in the indicator settings.
The indicator resets every 24 hours and is set to UTC+10. This can be changed by editing the script line 19 and changing the value of "resetHour = 1" to whatever value works for your timezone.
There is also a Rate of Change table that details the % rate of change of each narrative against BTC
Horizontal lines have been included to provide an indication of overbought and oversold levels.
The upper and lower horizontal line (overbought and oversold) can be adjusted through the settings.
The line width, and label offset can be customised through the input options.
Alerts can be set to triggered when a narrative's RSI crosses above the overbought level or below the oversold level. The alerts include the narrative name, RSI value, and the RSI level.

Retracement Bar🔍 Retracement Bar – RB
The Retracement Bar (RB) indicator is designed to highlight potential reversal zones by identifying candles where price shows a clear rejection from the extremes. It helps traders spot moments where institutional inventory rebalancing may be occurring — often a precursor to a strong move in the opposite direction.
RB highlights bars that:
Have a relatively small real body compared to the total candle range.
Show a long wick (upper or lower) that exceeds a user-defined percentage of the candle range.
Suggest a potential rejection of price — upward or downward — based on candle structure.
When these conditions are met, a triangle symbol is plotted:
🔻 Red triangle above a candle suggests a possible short opportunity.
🔺 Green triangle below a candle suggests a possible long opportunity.
This indicator does not repaint and triggers only at candle close.
📈 Example – Long Entry
Signal: A green triangle appears below a candle (suggesting rejection of lower prices).
Steps:
Wait for the current RB candle to close.
On the next candle:
Enter long if price breaks above the high of the RB candle.
Alternatively, wait for a pullback and enter based on confirmation (e.g., bullish engulfing, hammer, trendline bounce).
Place a stop-loss just below the low of the RB candle.
Set a target:
Based on a 2:1 risk-reward ratio.
Or use the next resistance/Fibonacci level.
📉 Example – Short Entry
Signal: A red triangle appears above a candle (suggesting rejection of higher prices).
Steps:
Wait for the current RB candle to close.
On the next candle:
Enter short if price breaks below the low of the RB candle.
Or wait for confirmation (e.g., bearish engulfing, shooting star, breakdown from a level).
Place a stop-loss just above the high of the RB candle.
Set a target:
2:1 risk-reward ratio.
Or the next support/Fibonacci zone.
✅ Recommended Filters for Better Results:
Confluence with support/resistance zones.
Trend alignment or reversal context.
Additional confirmation from price action patterns or oscillators.
Volume analysis for entry strength.
🙏 Acknowledgment
Special thanks to Rob Hoffman for inspiring this concept through his original Inventory Retracement Bar (IRB) idea — this indicator is a reinterpretation meant to visually and practically support discretionary price action traders.

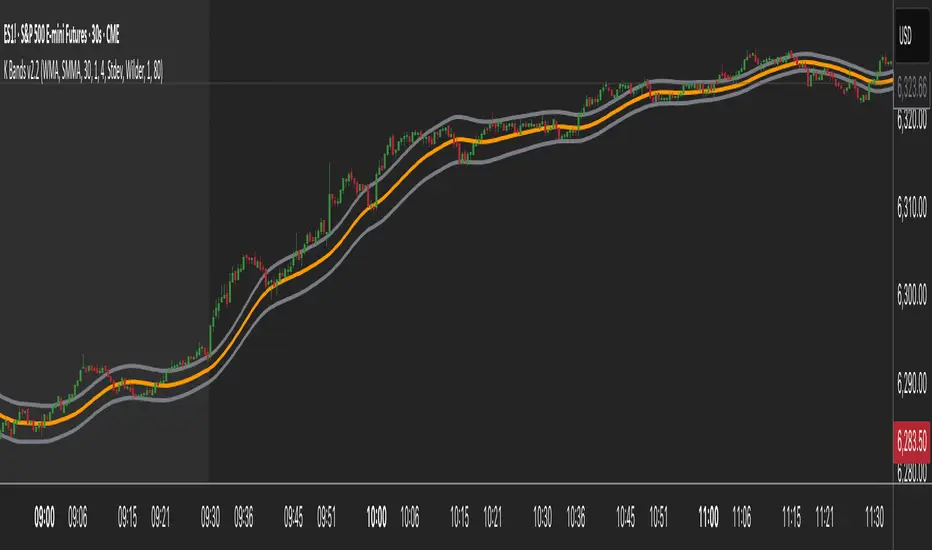
K Bands v2.2K Bands v2 - Settings Breakdown (Timeframe Agnostic)
K Bands v2 is an adaptive volatility envelope tool designed for flexibility across different trading
styles and timeframes.
The settings below allow complete control over how the bands are constructed, smoothed, and how
they respond to market volatility.
1. Upstream MA Type
Controls the core smoothing applied to price before calculating the bands.
Options:
- EMA: Fast, responsive, reacts quickly to price changes.
- SMA: Classic moving average, slower but provides stability.
- Hull: Ultra smooth, reduces noise significantly but may react differently to choppy conditions.
- GeoMean: Geometric mean smoothing, creates a unique, slightly smoother line.
- SMMA: Wilder-style smoothing, balances noise reduction and responsiveness.
- WMA: Weighted Moving Average, emphasizes recent price action for sharper responsiveness.
2. Smoothing Length
Lookback period for the upstream moving average.
- Lower values: Faster reaction, captures short-term shifts.
- Higher values: Smoother trend depiction, filters out noise.
3. Multiplier
Determines the width of the bands relative to calculated volatility.
- Lower multiplier: Tighter bands, more signals, but increased false breakouts.
- Higher multiplier: Wider bands, fewer false signals, more conservative.
4. Downstream MA Type
Applies final smoothing to the band plots after initial calculation.
Same options as Upstream MA.
5. Downstream Smoothing Length
Lookback period for downstream smoothing.
- Lower: More responsive bands.
- Higher: Smoother, visually cleaner bands.
6. Band Width Source
Selects the method used to calculate band width based on market volatility.
Options:
- ATR (Average True Range): Smooth, stable bands based on price range expansion.
- Stdev (Standard Deviation): More reactive bands highlighting short-term volatility spikes.
7. ATR Smoothing Type
Controls how the ATR or Stdev value is smoothed before applying to band width.
Options:
- Wilder: Classic, stable smoothing.
- SMA: Simple moving average smoothing.
- EMA: Faster, more reactive smoothing.
- Hull: Ultra-smooth, noise-reducing smoothing.
- GeoMean: Geometric mean smoothing.
8. ATR Length
Lookback period for smoothing the volatility measurement (ATR or Stdev).
- Lower: More reactive bands, captures quick shifts.
- Higher: Smoother, more stable bands.
9. Dynamic Multiplier Based on Volatility
Allows the band multiplier to adapt automatically to changes in market volatility.
- ON: Bands expand during high volatility and contract during low volatility.
- OFF: Bands remain fixed based on the set multiplier.
10. Dynamic Multiplier Sensitivity
Controls how aggressively the dynamic multiplier responds to volatility changes.
- Lower values: Subtle adjustments.
- Higher values: More aggressive band expansion/contraction.
K Bands v2 is designed to be adaptable across any market or timeframe, helping visualize price
structure, trend, and volatility behavior.
Auto-Length Anchored Multiple EMA (Hour-Based)# Auto-Length Anchored Multiple EMA (Hour-Based)
## Overview
This advanced EMA indicator automatically calculates Exponential Moving Average lengths based on the time elapsed since user-defined anchor dates. Unlike traditional fixed-length EMAs, this indicator dynamically adjusts EMA periods based on actual trading hours, making it ideal for event-based analysis and time-sensitive trading strategies.
## Key Features
### 🎯 **Dual Mode Operation**
- **Auto Mode**: EMA length automatically calculated from anchor date to current time
- **Manual Mode**: Traditional fixed-length EMA calculation
- Switch between modes independently for each EMA
### 📊 **Multiple EMA Support**
- Up to 4 independent EMAs with individual configurations
- Each EMA can have its own anchor date and settings
- Individual enable/disable controls for each EMA
### ⏰ **Smart Time Calculation**
- Accounts for actual trading hours (customizable)
- Weekend exclusion with Saturday trading option (for markets like NSE/BSE)
- Hour multiplier for fine-tuning EMA sensitivity
- Minimum EMA length protection to prevent calculation errors
### 🎨 **Visual Enhancements**
- **Dynamic Fill Colors**: Fill between EMA1 and EMA3 changes color based on price position
- **Customizable Colors**: Individual color settings for each EMA
- **Anchor Visualization**: Optional vertical lines and labels at anchor dates
- **Real-time Table**: Shows current EMA lengths, modes, and values
## Configuration Options
### Trading Session Settings
- **Trading Hours Per Day**: Set your market's trading hours (1-24)
- **Trading Days Per Week**: Configure for different markets (5 for Mon-Fri, 6 for Mon-Sat)
- **Include Saturday**: Enable for markets that trade on Saturday
- **Hour Multiplier**: Fine-tune EMA sensitivity (0.1x to 10x)
### EMA Configuration
- **Anchor Dates**: Set specific start dates for each EMA calculation
- **Manual Lengths**: Override with traditional fixed periods when needed
- **Enable/Disable**: Individual control for each EMA
- **Color Customization**: Personalize appearance for each EMA
### Visual Options
- **Fill Settings**: Toggle and customize fill colors between EMAs
- **Anchor Lines**: Show vertical lines at anchor dates
- **Anchor Labels**: Display formatted anchor date information
- **Length Table**: Real-time display of current EMA parameters
## Use Cases
### 📈 **Event-Based Analysis**
- Anchor EMAs to earnings announcements, policy decisions, or market events
- Track price behavior relative to specific time periods
- Analyze momentum changes from key market catalysts
### 🕐 **Time-Sensitive Trading**
- Perfect for intraday strategies where timing is crucial
- Automatically adjusts to market hours and trading sessions
- Eliminates manual EMA length recalculation
### 🌍 **Multi-Market Support**
- Configurable for different global markets
- Saturday trading support for Asian markets
- Flexible trading hour settings
## Technical Details
### Calculation Method
The indicator calculates trading bars elapsed since anchor date using:
```
Total Trading Bars = (Days Since Anchor × Trading Days Per Week ÷ 7) × Trading Hours Per Day × Hour Multiplier
```
### EMA Formula
Uses standard EMA calculation with dynamically calculated alpha:
```
Alpha = 2 ÷ (Current Length + 1)
EMA = Alpha × Current Price + (1 - Alpha) × Previous EMA
```
### Weekend Handling
- Automatically excludes weekends from calculation
- Optional Saturday inclusion for specific markets
- Accurate trading day counting
## Installation & Setup
1. **Add to Chart**: Apply the indicator to your desired timeframe
2. **Set Anchor Dates**: Configure anchor dates for each EMA you want to use
3. **Adjust Trading Hours**: Set your market's trading session parameters
4. **Customize Appearance**: Choose colors and visual options
5. **Enable Features**: Turn on fills, anchor lines, and information table as needed
## Best Practices
- **Anchor Selection**: Choose significant market events or technical breakouts as anchor points
- **Multiple Timeframes**: Use different anchor dates for short, medium, and long-term analysis
- **Hour Multiplier**: Start with 1.0 and adjust based on market volatility and your trading style
- **Visual Clarity**: Use contrasting colors for different EMAs to improve readability
## Compatibility
- **Pine Script Version**: v6
- **Chart Types**: All chart types supported
- **Timeframes**: Works on all timeframes (optimal on intraday charts)
- **Markets**: Suitable for stocks, forex, crypto, and commodities
## Notes
- Indicator starts calculation from the anchor date forward
- Minimum EMA length prevents calculation errors with very recent anchor dates
- Table display updates in real-time showing current EMA parameters
- Fill colors dynamically change based on price position relative to EMA1
---
*This indicator is perfect for traders who want to combine the power of EMAs with event-driven analysis and precise time-based calculations.*

Fear and Greed Index [DunesIsland]The Fear and Greed Index is a sentiment indicator designed to measure the emotions driving the stock market, specifically investor fear and greed. Fear represents pessimism and caution, while greed reflects optimism and risk-taking. This indicator aggregates multiple market metrics to provide a comprehensive view of market sentiment, helping traders and investors gauge whether the market is overly fearful or excessively greedy.How It WorksThe Fear and Greed Index is calculated using four key market indicators, each capturing a different aspect of market sentiment:
Market Momentum (30% weight)
Measures how the S&P 500 (SPX) is performing relative to its 125-day simple moving average (SMA).
A higher value indicates that the market is trading well above its moving average, signaling greed.
Stock Price Strength (20% weight)
Calculates the net number of stocks hitting 52-week highs minus those hitting 52-week lows on the NYSE.
A greater number of net highs suggests strong market breadth and greed.
Put/Call Options (30% weight)
Uses the 5-day average of the put/call ratio.
A lower ratio (more call options being bought) indicates greed, as investors are betting on rising prices.
Market Volatility (20% weight)
Utilizes the VIX index, which measures market volatility.
Lower volatility is associated with greed, as investors are less fearful of large market swings.
Each component is normalized using a z-score over a 252-day lookback period (approximately one trading year) and scaled to a range of 0 to 100. The final Fear and Greed Index is a weighted average of these four components, with the weights specified above.Key FeaturesIndex Range: The index value ranges from 0 to 100:
0–25: Extreme Fear (red)
25–50: Fear (orange)
50–75: Neutral (yellow)
75–100: Greed (green)
Dynamic Plot Color: The plot line changes color based on the index value, visually indicating the current sentiment zone.
Reference Lines: Horizontal lines are plotted at 0, 25, 50, 75, and 100 to represent the different sentiment levels: Extreme Fear, Fear, Neutral, Greed, and Extreme Greed.
How to Interpret
Low Values (0–25): Indicate extreme fear, which may suggest that the market is oversold and could be due for a rebound.
High Values (75–100): Indicate greed, which may signal that the market is overbought and could be at risk of a correction.
Neutral Range (25–75): Suggests a balanced market sentiment, neither overly fearful nor greedy.
This indicator is a valuable tool for contrarian investors, as extreme readings often precede market reversals. However, it should be used in conjunction with other technical and fundamental analysis tools for a well-rounded view of the market.

SMA Crossing Background Color (Multi-Timeframe)When day trading or scalping on lower timeframes, it’s often difficult to determine whether the broader market trend is moving upward or downward. To address this, I usually check higher timeframes. However, splitting the layout makes the charts too small and hard to read.
To solve this issue, I created an indicator that uses the background color to show whether the current price is above or below a moving average from a higher timeframe.
For example, if you set the SMA Length to 200 and the MT Timeframe to 5 minutes, the indicator will display a red background on the 1-minute chart when the price drops below the 200 SMA on the 5-minute chart. This helps you quickly recognize that the trend on the higher timeframe has turned bearish—without having to open a separate chart.
デイトレード、スキャルピングで短いタイムフレームでトレードをするときに、大きな動きは上に向いているのか下に向いているのかトレンドがわからなくなることがあります。
その時に上位足を確認するのですが、レイアウトをスプリットすると画面が小さくて見えにくくなるので、バックグラウンドの色で上位足の移動平均線では価格が上なのか下なのかを表示させるインジケーターを作りました。
例えば、SMA Length で200を選び、MT Timeframeで5分を選べば、1分足タイムフレームでトレードしていて雲行きが怪しくなってくるとBGが赤になり、5分足では200線以下に突入しているようだと把握することができます。

Volume MAs Oscillator | Lyro RSVolume MAs Oscillator | Lyro RS
Overview
The Volume MAs Oscillator is a powerful volume‑adjusted momentum tool that combines custom‑weighted moving averages on volume‑weighted price with smoothed deviation bands. It offers dynamic insights into trend direction, overbought/oversold conditions, and relative valuation — all within a single indicator
Key Features
Volume‑Adjusted Moving Averages: Moving averages can be volume‑weighted using the following formula: a moving average of (Price × Volume) divided by a moving average of Volume. This formula is applied across more than 14 different moving averages; however, it is not used with the VWMA, as VWMA is inherently a volume-weighted moving average.
Percentage Oscillator: Displays the normalized difference: (source – MA) / MA * 100, centered around zero for easy interpretation of strength and direction.
Deviation Bands: Builds upper and lower bands from standard deviation of the oscillator over a selected lookback, with distinct positive/negative multipliers and optional smoothing to reduce noise.
Inputs: Band Length, Band Smoothing, Positive Band Multiplier, Negative Band Multiplier.
Multi‑Mode Signal System:
1. Trend Mode – Colors oscillator according to breaks above (bullish) or below (bearish) respective bands.
2. Reversion Mode – Inverses color logic: signals overextensions beyond bands as reversion opportunities, greys inside the bands.
3. Valuation Mode – Applies a gradient color scale (UpC ⇄ DnC) to reflect relative valuation strength.
Customizable Visuals: Select from 5 pre‑set palettes—Classic, Mystic, Major Themes, Accented, Royal—or define your own custom bullish/bearish colors.
Chart enhancements include color‑coded oscillator line, deviation bands, glow‑effect midline at zero, background shading and candlestick/bar coloring aligned to signal mode.
Built‑In Signals: Automatically plots ▲ oversold and ▼ overbought markers upon crosses of lower/upper bands (in trend or reversion modes), enhancing signal clarity.
How It Works
MA Calculation – Applies the selected MA type to price × volume (normalized by MA of volume) or direct VWMA.
Oscillator Output – Calculates the % difference of source vs. derived MA.
Band Construction – Computes rolling standard deviation; applies user‑defined multipliers; smooths bands with exponential blending.
Mode-Dependent Coloring & Signals –
• Trend: Highlights strength trends via band cross coloring.
• Reversion: Flags extremes beyond bands as potential pullbacks.
• Valuation: Uses gradient to reflect oscillator’s position relative to recent range.
Signal Markers – Deploys arrows and color rules to flag overbought (▼) or oversold (▲) conditions when bands are breached.
Practical Use
Trend Confirmation – In Trend Mode, use upward price_diff cross above upper band as bullish; downward cross below lower band as bearish.
Mean Reversion – In Reversion Mode, fading extremes beyond bands may precede a retracement.
Relative Valuation – Valuation Mode shines when assessing how extended price_diff is, with gradient colors indicating valuation zones.
Bars/candles color‑coded to oscillator state boosts clarity of market tone and allows for rapid visual scanning.
Customization
Adjust MA type/length to tune responsiveness vs. smoothing.
Configure band settings for volatility sensitivity.
Toggle between signal modes for trend-following or reversion strategies.
Stylish visuals: pick or customize color schemes to match your chart setup.
⚠️Disclaimer
This indicator is a tool for technical analysis and does not provide guaranteed results. It should be used in conjunction with other analysis methods and proper risk management practices. The creators of this indicator are not responsible for any financial decisions made based on its signals.

Enhanced Ichimoku Cloud Strategy V1 [Quant Trading]Overview
This strategy combines the powerful Ichimoku Kinko Hyo system with a 171-period Exponential Moving Average (EMA) filter to create a robust trend-following approach. The strategy is designed for traders seeking to capitalize on strong momentum moves while using the Ichimoku cloud structure to identify optimal entry and exit points.
This is a patient, low-frequency trading system that prioritizes quality over quantity. In backtesting on Solana, the strategy achieved impressive results with approximately 3600% profit over just 29 trades, demonstrating its effectiveness at capturing major trend movements rather than attempting to profit from every market fluctuation. The extended parameters and strict entry criteria are specifically optimized for Solana's price action characteristics, making it well-suited for traders who prefer fewer, higher-conviction positions over high-frequency trading approaches.
What Makes This Strategy Original
This implementation enhances the traditional Ichimoku system by:
Custom Ichimoku Parameters: Uses non-standard periods (Conversion: 7, Base: 211, Lagging Span 2: 120, Displacement: 41) optimized for different market conditions
EMA Confirmation Filter: Incorporates a 171-period EMA as an additional trend confirmation layer
State Memory System: Implements a sophisticated memory system to track buy/sell states and prevent false signals
Dual Trade Modes: Offers both traditional Ichimoku signals ("Ichi") and cloud-based signals ("Cloud")
Breakout Confirmation: Requires price to break above the 25-period high for long entries
How It Works
Core Components
Ichimoku Elements:
-Conversion Line (Tenkan-sen): 7-period Donchian midpoint
-Base Line (Kijun-sen): 211-period Donchian midpoint
-Span A (Senkou Span A): Average of Conversion and Base lines, plotted 41 periods ahead
-Span B (Senkou Span B): 120-period Donchian midpoint, plotted 41 periods ahead
-Lagging Span (Chikou Span): Current close plotted 41 periods back
EMA Filter: 171-period EMA acts as a long-term trend filter
Entry Logic (Ichi Mode - Default)
A long position is triggered when ALL conditions are met:
Cloud Bullish: Span A > Span B (41 periods ago)
Breakout Confirmation: Current close > 25-period high
Ichimoku Bullish: Conversion Line > Base Line
Trend Alignment: Current close > 171-period EMA
State Memory: No previous buy signal is still active
Exit Logic
Positions are closed when:
Ichimoku Bearish: Conversion Line < Base Line
Alternative Cloud Mode
When "Cloud" mode is selected, the strategy uses:
Entry: Span A crosses above Span B with additional cloud and EMA confirmations
Exit: Span A crosses below Span B with cloud and EMA confirmations
Default Settings Explained
Strategy Properties
Initial Capital: $1,000 (realistic for average traders)
Position Size: 100% of equity (appropriate for backtesting single-asset strategies)
Commission: 0.1% (realistic for most brokers)
Slippage: 3 ticks (accounts for realistic execution costs)
Date Range: January 1, 2018 to December 31, 2069
Key Parameters
Conversion Periods: 7 (faster than traditional 9, more responsive to price changes)
Base Periods: 211 (much longer than traditional 26, provides stronger trend confirmation)
Lagging Span 2 Periods: 120 (custom period for stronger support/resistance levels)
Displacement: 41 (projects cloud further into future than standard 26)
EMA Period: 171 (long-term trend filter, approximately 8.5 months of daily data)
How to Use This Strategy
Best Market Conditions
Trending Markets: Works best in clearly trending markets where the cloud provides strong directional bias
Medium to Long-term Timeframes: Optimized for daily charts and higher timeframes
Volatile Assets: The breakout confirmation helps filter out weak signals in choppy markets
Risk Management
The strategy uses 100% equity allocation, suitable for backtesting single strategies
Consider reducing position size when implementing with real capital
Monitor the 25-period high breakout requirement as it may delay entries in fast-moving markets
Visual Elements
Green/Red Cloud: Shows bullish/bearish cloud conditions
Yellow Line: Conversion Line (Tenkan-sen)
Blue Line: Base Line (Kijun-sen)
Orange Line: 171-period EMA trend filter
Gray Line: Lagging Span (Chikou Span)
Important Considerations
Limitations
Lagging Nature: Like all Ichimoku strategies, signals may lag significant price moves
Whipsaw Risk: Extended periods of consolidation may generate false signals
Parameter Sensitivity: Custom parameters may not work equally well across all market conditions
Backtesting Notes
Results are based on historical data and past performance does not guarantee future results
The strategy includes realistic slippage and commission costs
Default settings are optimized for backtesting and may need adjustment for live trading
Risk Disclaimer
This strategy is for educational purposes only and should not be considered financial advice. Always conduct your own analysis and risk management before implementing any trading strategy. The unique parameter combinations used may not be suitable for all market conditions or trading styles.
Customization Options
Trade Mode: Switch between "Ichi" and "Cloud" signal generation
Short Trading: Option to enable short positions (disabled by default)
Date Range: Customize backtesting period
All Ichimoku Parameters: Fully customizable for different market conditions
This enhanced Ichimoku implementation provides a structured approach to trend following while maintaining the flexibility to adapt to different trading styles and market conditions.

Two Poles Trend Finder MTF [BigBeluga]🔵 OVERVIEW
Two Poles Trend Finder MTF is a refined trend-following overlay that blends a two-pole Gaussian filter with a multi-timeframe dashboard. It provides a smooth view of price dynamics along with a clear summary of trend directions across multiple timeframes—perfect for traders seeking alignment between short and long-term momentum.
🔵 CONCEPTS
Two-Pole Filter: A smoothing algorithm that responds faster than traditional moving averages but avoids the noise of short-term fluctuations.
var float f = na
var float f_prev1 = na
var float f_prev2 = na
// Apply two-pole Gaussian filter
if bar_index >= 2
f := math.pow(alpha, 2) * source + 2 * (1 - alpha) * f_prev1 - math.pow(1 - alpha, 2) * f_prev2
else
f := source // Warm-up for first bars
// Shift state
f_prev2 := f_prev1
f_prev1 := f
Trend Detection Logic: Trend direction is determined by comparing the current filtered value with its value n bars ago (shifted comparison).
MTF Alignment Dashboard: Trends from 5 configurable timeframes are monitored and visualized as colored boxes:
• Green = Uptrend
• Magenta = Downtrend
Summary Arrow: An average trend score from all timeframes is used to plot an overall arrow next to the asset name.
🔵 FEATURES
Two-Pole Gaussian Filter offers ultra-smooth trend curves while maintaining responsiveness.
Multi-Timeframe Trend Detection:
• Default: 1H, 2H, 4H, 12H, 1D (fully customizable)
• Each timeframe is assessed independently using the same trend logic.
Visual Trend Dashboard positioned at the bottom-right of the chart with color-coded trend blocks.
Dynamic Summary Arrow shows overall market bias (🢁 / 🢃) based on majority of uptrends/downtrends.
Bold + wide trail plot for the filter value with gradient coloring based on directional bias.
🔵 HOW TO USE
Use the multi-timeframe dashboard to identify aligned trends across your preferred trading horizons.
Confirm trend strength or weakness by observing filter slope direction .
Look for dashboard consensus (e.g., 4 or more timeframes green] ) as confirmation for breakout, continuation, or trend reentry strategies.
Combine with volume or price structure to enhance entry timing.
🔵 CONCLUSION
Two Poles Trend Finder MTF delivers a clean and intuitive trend-following solution with built-in multi-timeframe awareness. Whether you’re trading intra-day or positioning for swing setups, this tool helps filter out market noise and keeps you focused on directional consensus.
