Interpolated Median Volatility LSMA | OttoThis indicator combines trend-following and volatility analysis by enhancing traditional LSMA with percentile-based linear interpolation applied to both the Least Squares Moving Average (LSMA) and standard deviation. Rather than relying on raw values, it uses the interpolated median (50th percentile) to smooth out noise while preserving sensitivity to significant price shifts. This approach produces a cleaner trend signal that remains responsive to real market changes, adapts to evolving volatility conditions, and improves the accuracy of breakout detection.
Core Concept
The indicator builds on these core components:
LSMA (Least Squares Moving Average): A linear regression-based moving average that fits line using user selected source over user defined period. It offers a smoother and more reactive trend signal compared to standard moving averages.
Standard Deviation shows how much price varies from the mean. In this indicator, it’s used to measure market volatility.
Volatility Bands: Instead of traditional Bollinger-style bands, this script calculates custom upper and lower bands using percentile-based linear interpolation on both the LSMA and standard deviation. This method produces smoother bands that filter out noise while remaining adaptive to meaningful price movements, making them more aligned with real market behavior and helping reduce false signals.
Percentile interpolation estimates a specific percentile (like the median — the 50th percentile) from a set of values — even when that percentile doesn't fall exactly on one data point. Instead of selecting a single nearest value, it calculates a smoothed value between nearby points. In this script, it’s used to find the median of past LSMA and standard deviation values, reducing the impact of outliers and smoothing the trend and volatility signals for more robust results.
Signal Logic: A long signal is identified when close price goes above the upper band, and a short signal when close price goes below the lower band.
⚙️ Inputs
Source: The price source used in calculations
LSMA Length: Period for calculating LSMA
Standard Deviation Length: Period for calculating volatility
Percentile Length: Period used for interpolating percentile values of LSMA and standard deviation
Multiplier: Controls the width of the bands by scaling the interpolated standard deviation
📈 Visual Output
Colored LSMA Line: Changes color based on signal (green for bullish, purple for bearish)
Upper & Lower Bands: Volatility bands calculated using interpolated values (green for bullish, purple for bearish)
Bar Coloring: Price bars are colored to reflect signal state (green for bullish, purple for bearish)
Optional Candlestick Overlay: Enhances visual context by coloring candles to match the signal state (green for bullish, purple for bearish)
How to Use
Add the indicator to your chart and look for signals when close price goes above or below the bands.
Long Signal: close Price goes above the upper band
Short Signal: close Price goes below the lower band
🔔 Alerts:
This script supports alert conditions for long and short signals. You can set alerts based on band crossovers to be notified of potential entries/exits.
⚠️ Disclaimer:
This indicator is intended for educational and informational purposes only. Trading/investing involves risk, and past performance does not guarantee future results. Always test and evaluate strategies before applying them in live markets. Use at your own risk.
Moving Averages

Liquidity Sweep Candlestick Pattern with MA Filter📌 Liquidity Sweep Candlestick Pattern with MA Filter
This custom indicator detects liquidity sweep candlestick patterns—price action events where the market briefly breaks a previous candle’s high or low to trap traders—paired with optional filters such as moving averages, color change candles, and strictness rules for better signal accuracy.
🔍 What is a Liquidity Sweep?
A liquidity sweep occurs when the price briefly breaks the high or low of a previous candle and then reverses direction. These events often occur around key support/resistance zones and are used by institutional traders to trap retail positions before moving the price in the intended direction.
🟢 Bullish Liquidity Sweep Criteria
The current candle is bullish (closes above its open).
The low of the current candle breaks the low of the previous candle.
The candle closes above the previous candle’s open.
Optionally, in Strict mode, it must also close above the previous candle’s high.
Optionally, it can be filtered to only show if the candle changed color from the previous one (e.g., red to green).
Can be filtered to only show when the price is above or below a moving average (if MA filter is enabled).
🔴 Bearish Liquidity Sweep Criteria
The current candle is bearish (closes below its open).
The high of the current candle breaks the high of the previous candle.
The candle closes below the previous candle’s open.
Optionally, in Strict mode, it must also close below the previous candle’s low.
Optionally, it can be filtered to only show if the candle changed color from the previous one (e.g., green to red).
Can be filtered to only show when the price is above or below a moving average (if MA filter is enabled).
⚙️ Features & Customization
✅ Signal Strictness
Choose between:
Less Strict (default): Basic wick break and close conditions.
Strict: Must close beyond the wick of the previous candle.
✅ Color Change Candles Only
Enable this to only show patterns when the candle color changes (e.g., from red to green or green to red). Helps filter fake-outs.
✅ Moving Average Filter (optional)
Supports several types of MAs: SMA, EMA, WMA, VWMA, RMA, HMA
Choose whether signals should only appear above or below the selected moving average.
✅ Custom Visuals
Show short (BS) or full (Bull Sweep / Bear Sweep) labels
Plot triangles or arrows to represent bullish and bearish sweeps
Customize label and shape colors
Optionally show/hide the moving average line
✅ Alerts
Includes alert options for:
Bullish sweep
Bearish sweep
Any sweep
📈 How to Use
Add the indicator to your chart.
Configure the strictness, color change, or MA filters based on your strategy.
Observe signals where price is likely to reverse after taking out liquidity.
Use with key support/resistance levels, order blocks, or volume zones for confluence.
⚠️ Note
This tool is for educational and strategy-building purposes. Always confirm signals with other indicators, context, and sound risk management.

ALMA Shifting Band Oscillator | QuantMACALMA Shifting Band Oscillator | QuantMAC
🎯 Advanced Technical Analysis Tool Combining ALMA with Dynamic Oscillator Technology
The ALMA Shifting Band Oscillator represents a sophisticated fusion of the Arnaud Legoux Moving Average (ALMA) with an innovative oscillator-based signaling system. This indicator transforms traditional moving average analysis into a comprehensive trading solution with dynamic band visualization and precise entry/exit signals.
Core Technology 🔧
Arnaud Legoux Moving Average Foundation
Built upon the mathematically superior ALMA calculation, this indicator leverages the unique properties of ALMA's phase shift and noise reduction capabilities. The ALMA component provides a responsive yet smooth baseline that adapts to market conditions with minimal lag.
Dynamic Band System
The indicator generates adaptive upper and lower bands around the ALMA centerline using statistical deviation analysis. These bands automatically adjust to market volatility, creating a dynamic envelope that captures price extremes and potential reversal zones.
Normalized Oscillator Engine
The heart of the system transforms price action relative to the dynamic bands into a normalized oscillator that oscillates around a zero line. This oscillator provides clear visual representation of momentum and position within the established bands.
Visual Features 🎨
Multi-Pane Display Architecture
Primary oscillator plotted in separate pane for clarity
Dynamic band overlay on price chart with elegant fill visualization
ALMA centerline marked with distinctive styling
Customizable threshold lines for signal identification
Advanced Color Schemes
Choose from 9 professionally designed color palettes:
Classic series offering various aesthetic preferences
High contrast options for different chart backgrounds
State-based coloring that changes with market conditions
Candle coloring that reflects current oscillator state
Enhanced Visual Elements
Smooth gradient band fills for easy trend identification
Dynamic line thickness and styling options
Professional transparency settings for overlay clarity
Customizable threshold visualization
Signal Generation System 📊
Dual Threshold Architecture
The indicator employs two distinct threshold levels that create a sophisticated signal framework:
Long Threshold : Triggers bullish signal generation
Short Threshold : Activates bearish signal conditions
Intelligent State Management
Advanced state tracking ensures clean signal generation without false triggers:
Prevents redundant signals in same direction
Maintains position awareness for proper entries/exits
Implements crossover logic for precise timing
Flexible Trading Modes
Long/Short Mode : Full bidirectional trading capabilities
Long/Cash Mode : Conservative approach with cash positions during bearish conditions
Professional Analytics Suite 📈
Comprehensive Performance Metrics
Integrated real-time performance analysis including:
Maximum Drawdown percentage tracking
Sortino Ratio for downside risk assessment
Sharpe Ratio for risk-adjusted returns
Omega Ratio for comprehensive performance evaluation
Profit Factor calculation
Win rate percentage analysis
Half Kelly percentage for position sizing guidance
Total trade count and net profit tracking
Advanced Risk Management
Real-time equity curve tracking
Peak-to-trough drawdown monitoring
Downside deviation calculations
Risk-adjusted return measurements
Customization Options ⚙️
ALMA Parameter Control
ALMA Length (Default: 42) - Controls the lookback period for the moving average calculation. Lower values (20-30) create faster, more responsive signals but increase noise. Higher values (50-100) produce smoother signals with less false alerts but slower reaction to price changes.
ALMA Offset (Default: 0.68) - Determines the phase shift of the moving average. Values closer to 0 behave like a simple moving average. Values closer to 1 act more like an exponential moving average. 0.68 provides optimal balance between responsiveness and smoothness.
ALMA Sigma (Default: 1.8) - Controls the smoothness factor of the ALMA calculation. Lower values (1.0-2.0) create sharper, more reactive averages. Higher values (4.0-8.0) produce extremely smooth but slower-responding averages. Affects how quickly the ALMA adapts to price changes.
Source Selection - Choose between Close, Open, High, Low, or custom price combinations. Close price is standard for most analysis. HL2 or HLC3 can provide different market perspectives and reduce single-price volatility.
Oscillator Fine-tuning
Standard Deviation Length (Default: 27) - Determines the lookback period for volatility calculation. Shorter periods (10-20) make bands more reactive to recent volatility changes. Longer periods (40-60) create more stable bands that filter out short-term volatility spikes.
SD Multiplier (Default: 2.8) - Controls the width of the dynamic bands. Lower values (1.5-2.0) create tighter bands with more frequent signals but higher false signal rate. Higher values (3.0-4.0) produce wider bands with fewer but potentially more reliable signals.
Oscillator Multiplier (Default: 100) - Scales the oscillator for visual clarity. This is purely cosmetic and doesn't affect signal generation. Adjust based on your preferred oscillator range visualization.
Long Threshold (Default: 82) - Sets the level where bullish signals trigger. Lower values (70-80) generate more frequent long signals but may include weaker setups. Higher values (85-95) create fewer but potentially stronger bullish signals.
Short Threshold (Default: 50) - Determines where bearish signals activate. Higher values (55-65) produce more short signals. Lower values (35-45) wait for stronger bearish conditions before signaling.
Trading Mode Configuration
Long/Short Mode - Full bidirectional trading that takes both long and short positions. Suitable for trending markets and experienced traders comfortable with short selling.
Long/Cash Mode - Conservative approach that only takes long positions or moves to cash during bearish signals. Ideal for bull market conditions or traders who prefer not to short.
Display Customization
Color Schemes (9 Options) - Choose from Classic to Classic9 palettes. Each offers different visual contrast for various chart backgrounds and personal preferences.
Metrics Table Position - Place performance metrics in any of 6 chart locations: Top Left/Right, Middle Left/Right, Bottom Left/Right.
Show/Hide Metrics Table - Toggle the comprehensive performance analytics display on or off based on your analysis needs.
Date Range Limiter - Set specific start dates for backtesting and signal generation. Useful for testing strategies on specific market periods or excluding unusual market events.
Parameter Optimization Tips
Volatile Markets - Use shorter ALMA Length (25-35), lower SD Multiplier (2.0-2.5), and moderate thresholds
Trending Markets - Employ longer ALMA Length (45-60), higher SD Multiplier (3.0-4.0), and extreme thresholds
Sideways Markets - Try medium ALMA Length (35-45), standard SD Multiplier (2.5-3.0), and closer thresholds (75/55)
Higher Timeframes - Generally use longer periods and higher multipliers for smoother signals
Lower Timeframes - Opt for shorter periods and lower multipliers for more responsive signals
Practical Applications 💡
Trend Following
Identify and follow established trends using the dynamic band system and oscillator position relative to thresholds.
Momentum Analysis
Gauge market momentum through oscillator readings and their relationship to historical levels.
Reversal Detection
Spot potential reversal points when price reaches extreme oscillator levels combined with band interactions.
Risk Management
Utilize integrated metrics for position sizing and risk assessment decisions.
Technical Specifications 🔍
Calculation Methodology
The indicator employs sophisticated mathematical formulations for ALMA calculation combined with statistical analysis for band generation. The oscillator normalization process ensures consistent readings across different market conditions and timeframes.
Performance Optimization
Designed for efficient processing with minimal computational overhead while maintaining calculation accuracy across all timeframes.
Multi-Timeframe Compatibility
Functions effectively across all trading timeframes from intraday scalping to long-term position trading.
Installation and Usage 📋
Simple Setup Process
Add indicator to chart
Configure ALMA parameters for your preferred responsiveness
Adjust threshold levels based on market volatility
Select desired color scheme and display options
Enable metrics table for performance tracking
Best Practices
Use multiple timeframe analysis for context
Monitor metrics table for strategy performance
Adjust parameters based on market conditions
This indicator represents a professional-grade tool designed for serious traders seeking advanced technical analysis capabilities with comprehensive performance tracking. The combination of ALMA's mathematical precision with dynamic oscillator technology creates a unique analytical framework suitable for various trading styles and market conditions.
🚀 Transform your technical analysis with this advanced ALMA-based oscillator system!
⚠️ IMPORTANT DISCLAIMER
Past Performance Warning: 📉⚠️
PAST PERFORMANCE IS NOT INDICATIVE OF FUTURE RESULTS. Historical backtesting results, while useful for strategy development and parameter optimization, do not guarantee similar performance in live trading conditions. Market conditions change continuously, and what worked in the past may not work in the future.
Remember: Successful trading requires discipline, continuous learning, and adaptation to changing market conditions. No indicator or strategy guarantees profits, and all trading involves substantial risk of loss.

Kijun Shifting Band Oscillator | QuantMAC🎯 Kijun Shifting Band Oscillator | QuantMAC
📊 **Revolutionary Technical Analysis Tool Combining Ancient Ichimoku Wisdom with Cutting-Edge Statistical Methods**
🌟 Overview
The Kijun Shifting Band Oscillator represents a sophisticated fusion of traditional Japanese technical analysis and modern statistical theory. Built upon the foundational concepts of the Ichimoku Kinko Hyo system, this indicator transforms the classic Kijun-sen (base line) into a dynamic, multi-dimensional analysis tool that provides traders with unprecedented market insights.
This advanced oscillator doesn't just show you where price has been – it reveals the underlying momentum dynamics and volatility patterns that drive market movements, giving you a statistical edge in your trading decisions.
🔥 Key Features & Innovations
Dual Trading Modes for Maximum Flexibility: 🚀
Long/Short Mode: Full bidirectional trading capability for aggressive traders seeking to capitalize on both bullish and bearish market conditions
Long/Cash Mode: Conservative approach perfect for risk-averse traders, taking long positions during uptrends and moving to cash during downtrends (avoiding short exposure)
Advanced Visual Intelligence: 🎨
9 Professional Color Schemes: From classic blue/navy to vibrant orange/purple combinations, each optimized for different chart backgrounds and personal preferences
Dynamic Gradient Histogram: Color intensity reflects oscillator strength, providing instant visual feedback on momentum magnitude
Intelligent Overlay Bands: Semi-transparent fills create clear visual boundaries without cluttering your chart
Smart Candle Coloring: Real-time color changes reflect current market state and trend direction
Customizable Threshold Lines: Clearly marked entry and exit levels with contrasting colors
Professional-Grade Analytics: 📊
Real-Time Performance Metrics: Live calculation of 9 key performance indicators
Risk-Adjusted Returns: Sharpe, Sortino, and Omega ratios for comprehensive performance evaluation
Position Sizing Guidance: Half-Kelly percentage for optimal risk management
Drawdown Analysis: Maximum drawdown tracking for risk assessment
📈 Deep Technical Foundation
Kijun-Based Mathematical Framework: 🧮
The indicator begins with the traditional Kijun-sen calculation but extends it significantly:
Statistical Enhancements: 📉
Adaptive Volatility: Bands expand and contract based on market volatility
Momentum Filtering: EMA smoothing of oscillator for trend confirmation
State Management: Intelligent signal filtering prevents whipsaws and false signals
Multi-Timeframe Compatibility: Optimized algorithms work across all timeframes
⚙️ Comprehensive Parameter Control
Kijun Core Settings: 🎛️
Kijun Length (Default: 30): Controls the lookback period for the base calculation. Shorter periods = more responsive, longer periods = smoother signals
Source Selection: Choose from Close, Open, High, Low, or HL2. Close price recommended for most applications
Calculation Method: Uses traditional Ichimoku methodology ensuring compatibility with classic analysis
Advanced Oscillator Configuration: 📊
Standard Deviation Length (Default: 36): Determines volatility measurement period. Affects band width and sensitivity
SD Multiplier (Default: 2.1): Fine-tune band distance from basis line. Higher values = wider bands, lower values = tighter bands
Oscillator Multiplier (Default: 100): Scales the final oscillator output. Useful for matching other indicators or personal preference
Smoothing Algorithm: Built-in EMA smoothing prevents noise while maintaining responsiveness
Signal Threshold Optimization: 🎯
Long Threshold (Default: 83): Oscillator level that triggers long entries. Higher values = fewer but stronger signals
Short Threshold (Default: 42): Oscillator level that triggers short entries. Lower values = fewer but stronger signals
Threshold Logic: Crossover-based system with state management prevents signal overlap
Customization Range: Fully adjustable to match your trading style and risk tolerance
Precision Date Control: 📅
Start Date/Month/Year: Precise backtesting control down to the day
Historical Analysis: Test strategies on specific market periods or events
Strategy Validation: Isolate performance during different market conditions
📊 Professional Metrics Dashboard
Risk Assessment Metrics: 💼
Maximum Drawdown %: Largest peak-to-trough decline in portfolio value. Critical for understanding worst-case scenarios and position sizing
Sortino Ratio: Risk-adjusted return measure focusing only on downside volatility. Superior to Sharpe ratio for asymmetric return distributions
Sharpe Ratio: Classic risk-adjusted performance metric. Values above 1.0 considered good, above 2.0 excellent
Omega Ratio: Probability-weighted ratio capturing all moments of return distribution. More comprehensive than Sharpe or Sortino
Performance Analytics: 📈
Profit Factor: Gross Profit ÷ Gross Loss. Values above 1.0 indicate profitability, above 2.0 considered excellent
Win Rate %: Percentage of profitable trades. Consider alongside average win/loss size for complete picture
Net Profit %: Total return on initial capital. Accounts for compounding effects
Total Trades: Sample size for statistical significance assessment
Advanced Position Sizing: 🎯
Half Kelly %: Optimal position size based on Kelly Criterion, reduced by 50% for safety margin
Risk Management: Helps determine appropriate position size relative to account equity
Mathematical Foundation: Based on win probability and profit factor calculations
Practical Application: Directly usable percentage for position sizing decisions
🎨 Advanced Display Options
Flexible Interface Design: 🖥️
6 Positioning Options: Top/Bottom/Middle × Left/Right combinations for optimal chart organization
Toggle Functionality: Show/hide metrics table for clean chart presentation during analysis
Color Coordination: Metrics table colors match selected oscillator color scheme
Professional Styling: Clean, readable format with proper spacing and alignment
Visual Hierarchy: 🎭
Oscillator Histogram: Primary focus with gradient intensity showing momentum strength
Threshold Lines: Clear horizontal references for entry/exit levels
Zero Line: Neutral reference point for trend bias determination
Background Bands: Subtle overlay context without chart clutter
🚀 Advanced Signal Generation System
Multi-Layer Signal Logic: ⚡
Primary Signal Generation: Oscillator crossover above Long Threshold (default 83) triggers long entries
Exit Signal Processing: Oscillator crossunder below Short Threshold (default 42) triggers position exits
State Management System: Prevents duplicate signals and ensures clean position transitions
Mode-Specific Logic: Different behavior for Long/Short vs Long/Cash modes
Date Range Filtering: Signals only generated within specified backtesting period
Confirmation Requirements: Bar confirmation prevents false signals from intrabar price spikes
Intelligent Position Management: 🧠
Entry Tracking: Precise entry price recording for accurate P&L calculations
Position State Monitoring: Continuous tracking of long/short/cash positions
Automatic Exit Logic: Seamless position closure and new position initiation
Performance Calculation: Real-time P&L tracking with compounding effects
📉📈 Comprehensive Band Interpretation Guide
Dynamic Band Analysis: 🔍
Upper Band Function: Represents dynamic resistance based on recent volatility. Price approaching upper band suggests potential reversal or breakout
Lower Band Function: Represents dynamic support with volatility adjustment. Price near lower band indicates oversold conditions or support testing
Middle Line (Basis): Trend direction indicator. Price above = bullish bias, price below = bearish bias
Band Width Interpretation: Wide bands = high volatility, narrow bands = low volatility/potential breakout setup
Band Slope Analysis: Rising bands = strengthening trend, falling bands = weakening trend
Oscillator Interpretation: 📊
Values Above 50: Price in upper half of recent range, bullish momentum
Values Below 50: Price in lower half of recent range, bearish momentum
Extreme Values (>80 or <20): Overbought/oversold conditions, potential reversal zones
Momentum Divergence: Oscillator direction vs price direction for early reversal signals
Trend Confirmation: Oscillator direction confirming or contradicting price trends
💡 Strategic Trading Applications
Primary Trading Strategies: 🎯
Trend Following: Use threshold crossovers to capture major directional moves. Best in trending markets with clear directional bias
Mean Reversion: Identify extreme oscillator readings for counter-trend opportunities. Effective in range-bound markets
Breakout Trading: Monitor band compressions followed by expansions for breakout signals
Swing Trading: Combine oscillator signals with band interactions for swing position entries/exits
Risk Management: Use metrics dashboard for position sizing and risk assessment
Market Condition Optimization: 🌊
Trending Markets: Increase threshold separation for fewer, stronger signals
Choppy Markets: Decrease threshold separation for more responsive signals
High Volatility: Increase SD multiplier for wider bands
Low Volatility: Decrease SD multiplier for tighter bands and earlier signals
⚙️ Advanced Configuration Tips
Parameter Optimization Guidelines: 🔧
Kijun Length Adjustment: Shorter periods (10-20) for faster signals, longer periods (50-100) for smoother trends
SD Length Tuning: Match to your trading timeframe - shorter for responsive, longer for stability
Threshold Calibration: Backtest different levels to find optimal entry/exit points for your market
Color Scheme Selection: Choose schemes that provide best contrast with your chart background and other indicators
Integration with Other Indicators: 🔗
Volume Indicators: Confirm oscillator signals with volume spikes
Support/Resistance: Use key levels to filter oscillator signals
Momentum Indicators: RSI, MACD confirmation for signal strength
Trend Indicators: Moving averages for overall trend bias confirmation
⚠️ Important Usage Notes & Limitations
Indicator Characteristics: ⚡
Lagging Nature: Based on historical price data - signals occur after moves have begun
Best Practice: Combine with leading indicators and price action analysis
Market Dependency: Performance varies across different market conditions and instruments
Backtesting Essential: Always validate parameters on historical data before live implementation
Optimization Recommendations: 🎯
Parameter Testing: Systematically test different combinations on your preferred instruments
Walk-Forward Analysis: Regularly re-optimize parameters to maintain effectiveness
Market Regime Awareness: Adjust parameters for different market conditions (trending vs ranging)
Risk Controls: Implement maximum drawdown limits and position size controls
🔧 Technical Specifications
Performance Optimization: ⚡
Efficient Algorithms: Optimized calculations for smooth real-time operation
Memory Management: Smart array handling for metrics calculations
Visual Optimization: Balanced detail vs performance for responsive charts
Multi-Symbol Ready: Consistent performance across different assets
---
The Kijun Shifting Band Oscillator represents the evolution of technical analysis, bridging the gap between traditional methods and modern quantitative approaches. This indicator provides traders with a comprehensive toolkit for market analysis, combining the intuitive wisdom of Japanese candlestick analysis with the precision of statistical mathematics.
🎯 Designed for serious traders who demand professional-grade analysis tools with institutional-quality metrics and risk management capabilities. Whether you're a discretionary trader seeking visual confirmation or a systematic trader building quantitative strategies, this indicator provides the foundation for informed trading decisions.
⚠️ IMPORTANT DISCLAIMER
Past Performance Warning: 📉⚠️
PAST PERFORMANCE IS NOT INDICATIVE OF FUTURE RESULTS. Historical backtesting results, while useful for strategy development and parameter optimization, do not guarantee similar performance in live trading conditions. Market conditions change continuously, and what worked in the past may not work in the future.
Remember: Successful trading requires discipline, continuous learning, and adaptation to changing market conditions. No indicator or strategy guarantees profits, and all trading involves substantial risk of loss.

DTMA (Double Triangular Moving Average)English Description:
DTMA (Double Triangular Moving Average) is a smoothed moving average indicator that applies a triangular moving average (TMA) twice to reduce lag and provide a more stable trend line. The formula used is:
DTMA = 2 * TMA(src, period) - TMA(TMA(src, period), period)
This implementation focuses on the core calculation and plotting of the DTMA line, omitting visual styling features like bar coloring or trend direction. It's useful for traders looking for a smoother alternative to standard moving averages when identifying trends.

Trend Scanner ProTrend Scanner Pro, Robust Trend Direction and Strength Estimator
Trend Scanner Pro is designed to evaluate the current market trend with maximum robustness, providing both direction and strength based on statistically reliable data.
This indicator builds upon the core logic of a previous script I developed, called Best SMA Finder. While the original script focused on identifying the most profitable SMA length based on backtested trade performance, Trend Scanner Pro takes that foundation further to serve a different purpose: analyzing and quantifying the actual trend state in real time.
It begins by testing hundreds of SMA lengths, from 10 to 1000 periods. Each one is scored using a custom robustness formula that combines profit factor, number of trades, and win rate. Only SMAs with a sufficient number of trades are retained, ensuring statistical validity and avoiding curve fitting.
The SMA with the highest robustness score is selected as the dynamic reference point. The script then calculates how far the price deviates from it using rolling standard deviation, assigning a trend strength score from -5 (strong bearish) to +5 (strong bullish), with 0 as neutral.
Two detection modes are available:
Slope mode, based on SMA slope reversals
Bias mode, based on directional shifts relative to deviation zones
Optional features:
Deviation bands for visual structure
Candle coloring to reflect trend strength
Compact table showing real-time trend status
This tool is intended for traders who want an adaptive, objective, and statistically grounded assessment of market trend conditions.

Advanced Moving Average ChannelAdvanced Moving Average Channel (MAC) is a comprehensive technical analysis tool that combines multiple moving average types with volume analysis to provide a complete market perspective.
Key Features:
1. Dynamic Channel Formation
- Configurable moving average types (SMA, EMA, WMA, VWMA, HMA, TEMA)
- Separate upper and lower band calculations
- Customizable band offsets for precise channel adjustment
2. Volume Analysis Integration
- Multi-timeframe volume analysis (1H, 24H, 7D)
- Relative volume comparison against historical averages
- Volume trend detection with visual indicators
- Price-level volume distribution profile
3. Market Context Indicators
- RSI integration for overbought/oversold conditions
- Channel position percentage
- Volume-weighted price levels
- Breakout detection with visual signals
Usage Guidelines:
1. Channel Interpretation
- Price within channel: Normal market conditions
- Price above upper band: Potential overbought condition
- Price below lower band: Potential oversold condition
- Channel width: Indicates market volatility
2. Volume Analysis
- High relative volume (>150%): Strong market interest
- Low relative volume (<50%): Weak market interest
- Volume trend arrows: Indicate increasing/decreasing market participation
- Volume profile: Shows price levels with highest trading activity
3. Trading Signals
- Breakout arrows: Potential trend continuation
- RSI extremes: Confirmation of overbought/oversold conditions
- Volume confirmation: Validates price movements
Customization:
- Adjust MA length for different market conditions
- Modify band offsets for tighter/looser channels
- Fine-tune volume analysis parameters
- Customize visual appearance
This indicator is designed for traders who want to combine price action, volume analysis, and market structure in a single, comprehensive tool.

5EMA_BB_ScalpingWhat?
In this forum we have earlier published a public scanner called 5EMA BollingerBand Nifty Stock Scanner , which is getting appreciated by the community. That works on top-40 stocks of NSE as a scanner.
Whereas this time, we have come up with the similar concept as a stand-alone indicator which can be applied for any chart, for any timeframe to reap the benifit of reversal trading.
How it works?
This is essentially a reversal/divergence trading strategy, based on a widely used strategy of Power-of-Stocks 5EMA.
To know the divergence from 5-EMA we just check if the high of the candle (on closing) is below the 5-EMA. Then we check if the closing is inside the Bollinger Band (BB). That's a Buy signal. SL: low of the candle, T: middle and higher BB.
Just opposite for selling. 5-EMA low should be above 5-EMA and closing should be inside BB (lesser than BB higher level). That's a Sell signal. SL: high of the candle, T: middle and lower BB.
Along with we compare the current bar's volume with the last-20 bar VWMA (volume weighted moving average) to determine if the volume is high or low.
Present bar's volume is compared with the previous bar's volume to know if it's rising or falling.
VWAP is also determined using `ta.vwap` built-in support of TradingView.
The Bolling Band width is also notified, along with whether it is rising or falling (comparing with previous candle).
What's special?
We love this reversal trading, as it offers many benifits over trend following strategies:
Risk to Reward (RR) is superior.
It _Does Hit_ stop losses, but the stop losses are tiny.
Means, althrough the Profit Factor looks Nahh , however due to superior RR, end of day it ended up in green.
When the day is sideways, it's difficult to trade in trending strategies. This sort of volatility, reversal strategies works better.
It's always tempting to go agaist the wind. Whole world is in Put/PE and you went opposite and enter a Call/CE. And turns out profitable! That's an amazing feeling, as a trader :)
How to trade using this?
* Put any chart
* Apply this screener from Indicators (shortcut to launch indicators is just type / in your keyboard).
* It will show you the Green up arrow when buy alert comes or red down arrow when sell comes. * Also on the top right it will show the latest signal with entry, SL and target.
Disclaimer
* This piece of software does not come up with any warrantee or any rights of not changing it over the future course of time.
* We are not responsible for any trading/investment decision you are taking out of the outcome of this indicator.

BAFD (Price Action For D.....s)🧠 Overview
This indicator combines multiple Moving Averages (MA) with visual price action elements such as Fair Value Gaps (FVGs) and Swing Points. It provides traders with real-time insight into trend direction, structural breaks, and potential entry zones based on institutional price behavior.
⚙️ Features
1. Multi MA Visualization (SMA & EMA)
- Plots short-, mid-, and long-term moving averages
- Fully customizable: MA type (SMA/EMA) and length per MA
- Dynamic color coding: green for bullish, red for bearish (based on close >/< MA)
2. Fair Value Gaps (FVG) Detection
Detects bullish and bearish imbalances using multiple logic types:
- Same Type: Last 3 candles move in the same direction
- Twin Close: Last 2 candles close in the same direction
- All: Shows all valid FVGs regardless of pattern
Gaps are marked with semi-transparent yellow boxes
Useful for identifying potential liquidity voids and retest zones
3. Swing Highs and Lows
- Automatically identifies major swing points
- Customizable sensitivity (strength setting)
Marked with subtle colored dots for structure identification or support/resistance mapping
📈 Use Cases
- Trend Identification: Visualize momentum on multiple timeframes
- Liquidity Mapping: Spot potential retracement zones using FVGs
- Confluence Building: Combine MA slope, FVG zones, and swing points for refined setups
🛠️ Customizable Settings
- Moving average type and length for each MA
- FVG logic selection and color
- Swing point strength
🔔 Note
This script does not generate buy/sell signals or alerts. It is designed as a visual decision-support tool for discretionary traders who rely on market structure, trend, and price action.

Brian Shannon 5-Day MA BackgroundBrian Shannon 5-Day Moving Average with Dynamic Background Fill
OVERVIEW
This indicator implements Brian Shannon's renowned 5-Day Moving Average methodology from his acclaimed work "Technical Analysis Using Multiple Timeframes." The indicator provides instant visual clarity on short-term trend direction and momentum, making it an essential tool for swing traders and active investors.
KEY FEATURES
• True 5-Day Moving Average: Dynamically calculates the correct period across all timeframes (1min, 5min, 15min, 1H, etc.)
• Visual Price-to-MA Relationship: Color-coded fill between price and the moving average
- Green Fill: Price is above the 5-day MA (bullish short-term momentum)
- Red Fill: Price is below the 5-day MA (bearish short-term momentum)
• Multi-Timeframe Compatible: Works seamlessly on any chart timeframe while maintaining the true 5-day calculation
BRIAN SHANNON'S STRATEGIC APPLICATION
Primary Uses:
1. Trend Identification: Quickly identify short-term momentum shifts
2. Dynamic Support/Resistance: The 5-day MA acts as a moving support level in uptrends and resistance in downtrends
3. Entry Signal Confirmation: Look for pullbacks to the 5-day MA as potential entry points in trending stocks
4. Multi-Timeframe Analysis: Essential component of Shannon's multiple timeframe approach
Perfect Combination with:
• AVWAP (Anchored Volume Weighted Average Price): Use together to identify high-probability setups where price is above both the 5-day MA and AVWAP
• Longer-term Moving Averages: Combine with 20-day and 50-day MAs for complete trend analysis
• Volume Analysis: Confirm 5-day MA signals with volume patterns
TRADING APPLICATIONS
For Swing Traders:
• Bullish Setup: Price above 5-day MA + above AVWAP + above longer-term MAs = Strong uptrend
• Bearish Setup: Price below 5-day MA + below AVWAP + below longer-term MAs = Strong downtrend
• Entry Timing: Use pullbacks to the 5-day MA as entry opportunities in the direction of the primary trend
For Day Traders:
• Quick visual confirmation of intraday momentum
• Dynamic support/resistance levels for scalping opportunities
• Clear trend bias for directional trades
WHY THIS INDICATOR WORKS
Brian Shannon's approach emphasizes that the 5-day moving average represents the short-term sentiment of market participants. When price is consistently above this level, it indicates buyers are in control of short-term price action. Conversely, when price falls below, it suggests selling pressure is dominating.
The visual fill makes it immediately obvious:
• How far price is from the 5-day MA
• The strength of the current short-term trend
• Potential areas where price might find support or resistance
BEST PRACTICES
1. Never use in isolation - Always combine with longer timeframe analysis
2. Volume confirmation - Look for volume expansion on moves away from the 5-day MA
3. Multiple timeframe approach - Check higher timeframes for overall trend direction
4. Combine with AVWAP - Most powerful when both indicators align
INSTALLATION NOTES
This indicator automatically adjusts for any timeframe, ensuring you always get a true 5-trading-day moving average regardless of whether you're viewing 1-minute or hourly charts.
Based on the technical analysis methodology of Brian Shannon, author of "Technical Analysis Using Multiple Timeframes"
McGinley Dynamic debugged🔍 McGinley Dynamic Debugged (Adaptive Moving Average)
This indicator plots the McGinley Dynamic, a mathematically adaptive moving average designed to reduce lag and better track price action during both trends and consolidations.
✅ Key Features:
Adaptive smoothing: The McGinley Dynamic adjusts itself based on the speed of price changes.
Lag reduction: Compared to traditional moving averages like EMA or SMA, McGinley provides smoother yet responsive tracking.
Stability fix: This version includes a robust fix for rare recursive calculation issues, particularly on low-priced historical assets (e.g., Wipro pre-2000).
⚙️ What’s Different in This Debugged Version?
Implements manual clamping on the source / previous value ratio to prevent mathematical spikes that could cause flattening or distortion in the plotted line.
Ensures more stable behavior across all instruments and timeframes, especially those with historically low price points or volatile early data.
💡 Use Case:
Ideal for:
Trend confirmation
Entry filtering
Adaptive support/resistance visualization
Improving signal precision in low-volatility or high-noise environments
⚠️ Notes:
Works best when combined with volume filters or other trend indicators for validation.
This version is optimized for visual use—for signal generation, consider pairing it with additional logic or thresholds.

Bullish Bearish Signal with EMA Color + LabelsThis script generates clear BUY and SELL signals based on a combination of trend direction, momentum, and confirmation from multiple indicators. It is intended to help traders identify strong bullish or bearish conditions using commonly trusted tools: EMA 200, MACD, and RSI.
🔍 How it works:
The strategy combines three key elements:
EMA 200 Trend Filter
Identifies the long-term trend:
Price above EMA200 → Bullish trend bias
Price below EMA200 → Bearish trend bias
The EMA line is color-coded:
🔵 Blue for bullish
🔴 Red for bearish
⚪ Gray for neutral/unclear
MACD Crossover
Detects shifts in market momentum:
Bullish: MACD line crosses above signal line
Bearish: MACD line crosses below signal line
RSI Confirmation
Adds an extra layer of confirmation:
Bullish: RSI is above its signal line
Bearish: RSI is below its signal line
✅ Signal Logic:
BUY Signal appears when:
Price > EMA200
MACD crosses up
RSI > its signal line
SELL Signal appears when:
Price < EMA200
MACD crosses down
RSI < its signal line
Labels will appear on the chart to highlight these events.
🔔 Alerts:
The script includes alerts for both Buy and Sell conditions, so you can be notified in real-time when they occur.
📈 How to Use:
Best used in trending markets.
Recommended for higher timeframes (1H and above).
May be combined with other tools such as support/resistance or candlestick analysis.
⚠️ Disclaimer: This script is intended for educational purposes only and does not constitute financial advice or a trading recommendation.

FNO Straddle/Strangle Premium TrackerThe FNO Straddle/Strangle Premium Tracker is a powerful Pine Script indicator designed for options traders to monitor the combined premium of a straddle or strangle strategy for Indian F&O instruments. It tracks the sum of call and put option prices, visualizes the premium as a candlestick or line chart, and includes technical indicators like EMAs and premium percentage change. The indicator also provides a real-time data table, alerts for key events, and exportable data for analysis, making it ideal for tracking premium movements and identifying trading opportunities.
Key Features
Customizable Inputs: Select from a wide range of underlying symbols (e.g., NIFTY, BANKNIFTY, stocks like RELIANCE, TCS), expiry date, call/put strike prices, chart type (Candlestick or Line), and timeframe (1-min to Daily).
Premium Visualization: Plots the combined premium (Call + Put) as a candlestick or line chart, with customizable colors for easy trend identification.
Exponential Moving Averages (EMAs): Displays 21, 100, and 200-period EMAs to track premium trends, with alerts for premium crossing above/below the 21-period EMA.
Premium % Change: Shows the percentage change in the combined premium as a histogram for quick momentum analysis.
Real-Time Data Table: A table in the top-right corner displays the latest premium, call/put Last Traded Prices (LTP), and EMA values (21, 100, 200).
Error Handling: Alerts users with a warning label if the selected symbol, expiry, or strike is invalid or data is unavailable.
Data Export: Outputs the latest premium, call LTP, and put LTP as a text string for easy copying or analysis.
LTP Label: Displays the current premium value every 5 bars for quick reference.
How It Works
Input Selection: Choose the underlying symbol, expiry date (YYMMDD format, e.g., 250626 for June 26, 2025), call and put strike prices, chart type, and timeframe.
Data Fetching: The script fetches real-time OHLC (Open, High, Low, Close) data for the selected call and put options using the specified symbol and expiry.
Premium Calculation: Combines the call and put option prices to calculate the straddle/strangle premium (Open, High, Low, Close).
Visualization: Plots the premium as a candlestick (green for bullish, red for bearish) or a blue line chart, along with EMAs, call/put LTP lines, and a premium % change histogram.
Alerts & Notifications: Triggers alerts when the premium crosses the 21-period EMA and displays a warning if data is invalid.
Data Display: Shows key metrics in a table and provides exportable data for further analysis.
Inputs
Select Symbol: Choose the underlying instrument (e.g., NIFTY, BANKNIFTY, RELIANCE, etc.).
Expiry Date: Enter the option expiry in YYMMDD format (e.g., 250626).
Call/Put Strike: Specify the strike prices for the call and put options.
Chart Type: Select "Candlestick" or "Line" to visualize the premium.
Timeframe: Choose the data aggregation period (e.g., 1-min, 5-min, Daily).
Outputs
Chart: Candlestick or line plot of the combined premium, with EMAs (21, 100, 200), call/put LTP, and premium % change histogram.
Table: Real-time display of premium, call/put LTP, and EMA values.
Alerts: Notifications for premium crossing EMA21 or invalid data.
Export Data: A text string with the latest premium, call LTP, and put LTP for external use.
Use Cases
Straddle/Strangle Trading: Monitor premium movements for at-the-money (ATM) straddles or out-of-the-money (OTM) strangles to time entries/exits.
Trend Analysis: Use EMAs to identify bullish or bearish trends in the premium.
Momentum Trading: Leverage the premium % change histogram to spot rapid price movements.
Risk Management: Track call and put LTP individually to assess option price behavior.
Data Analysis: Export premium data for backtesting or strategy development.
How to Use
Add the indicator to your TradingView chart.
Configure the inputs (symbol, expiry, strikes, chart type, timeframe) based on your trading setup.
Monitor the chart for premium trends, EMA crossovers, and % change signals.
Use the table and export data for real-time insights or external analysis.
Set up alerts to get notified when the premium crosses the 21-period EMA.
Notes
Ensure the symbol, expiry, and strike prices are valid for your data provider to avoid "Invalid Symbol" errors.
The indicator works best on Indian F&O instruments (NSE/BSE) with active options chains.
For optimal performance, use shorter timeframes (e.g., 1-min, 5-min) for intraday trading or Daily for positional analysis.
The premium % change histogram helps identify volatility spikes, useful for breakout strategies.
Limitations
Requires valid option chain data from TradingView’s data provider.
Performance may vary on low-liquidity instruments or illiquid strike prices.
Alerts are limited to EMA21 crossovers; additional custom alerts can be added as needed.
Feedback
If you have suggestions or need additional features (e.g., Bollinger Bands, RSI, or volatility metrics), feel free to comment! Happy trading!

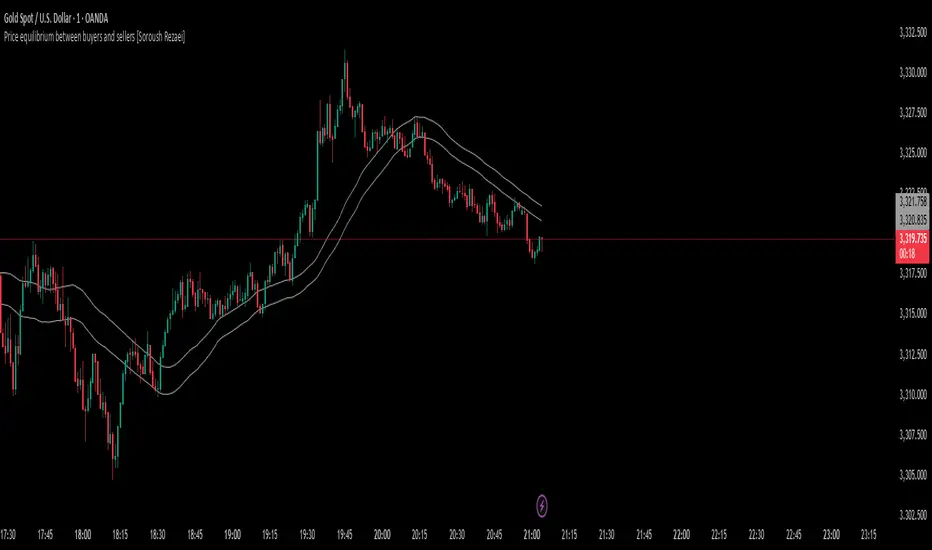
Price equilibrium between buyers and sellers [Soroush Rezaei]This indicator visualizes the dynamic balance between buyers and sellers using two simple moving averages (SMAs) based on the high and low prices.
The green line (SMA of highs) reflects the upper pressure zone, while the red line (SMA of lows) represents the lower support zone.
When price hovers between these two levels, it often signals a state of temporary equilibrium — a consolidation zone where buyers and sellers are relatively balanced.
Use this tool to:
Identify ranging or balanced market phases
Spot potential breakout or reversal zones
Enhance your multi-timeframe or price action strategy
Recommended for intraday and swing traders seeking visual clarity on market structure and momentum zones.
Dr Avinash Talele momentum indicaterTrend and Volatility Metrics
EMA10, EMA20, EMA50:
Show the percentage distance of the current price from the 10, 20, and 50-period Exponential Moving Averages.
Positive values indicate the price is above the moving average (bullish momentum).
Negative values indicate the price is below the moving average (bearish or corrective phase).
Use: Helps traders spot if a stock is extended or pulling back to support.
RVol (Relative Volume):
Compares current volume to the 20-day average.
Positive values mean higher-than-average trading activity (potential institutional interest).
Negative values mean lower activity (less conviction).
Use: High RVol often precedes strong moves.
ADR (Average Daily Range):
Shows the average daily price movement as a percentage.
Use: Higher ADR = more volatility = more trading opportunities.
50D Avg. Vol & 50D Avg. Vol ₹:
The 50-day average volume (in millions) and value traded (in crores).
Use: Confirms liquidity and suitability for larger trades.
ROC (Rate of Change) Section
1W, 1M, 3M, 6M, 12M:
Show the percentage price change over the last 1 week, 1 month, 3 months, 6 months, and 12 months.
Positive values (green) = uptrend, Negative values (red) = downtrend.
Use: Quickly see if the stock is gaining or losing momentum over different timeframes.
Momentum Section
1M, 3M, 6M:
Show the percentage gain from the lowest price in the last 1, 3, and 6 months.
Use: Measures how much the stock has bounced from recent lows, helping find strong rebounds or new leaders.
52-Week High/Low Section
From 52WH / From 52WL:
Show how far the current price is from its 52-week high and low, as a percentage.
Closer to 52WH = strong uptrend; Closer to 52WL = possible value or turnaround setup.
Use: Helps traders identify stocks breaking out to new highs or rebounding off lows.
U/D Ratio
U/D Ratio:
The ratio of up-volume to down-volume over the last 50 days.
Above 1 = more buying volume (bullish), Below 1 = more selling volume (bearish).
Use: Confirms accumulation or distribution.
How This Table Helps Analysts and Traders
Instant Trend Assessment:
With EMA distances and ROC, analysts can instantly see if the stock is trending, consolidating, or reversing.
Momentum Confirmation:
ROC and Momentum sections highlight stocks with strong recent moves, ideal for momentum and breakout traders.
Liquidity and Volatility Check:
Volume and ADR ensure the stock is tradable and has enough price movement to justify a trade.
Relative Positioning:
52-week high/low stats show whether the stock is near breakout levels or potential reversal zones.
Volume Confirmation:
RVol and U/D ratio help confirm if moves are backed by real buying/selling interest.
Actionable Insights:
By combining these metrics, traders can filter for stocks with strong trends, robust momentum, and institutional backing—ideal for swing, position, or even intraday trading.

Enhanced QQE with Filters v6Enhanced QQE with Filters v6
This script is an advanced version of the QQE (Quantitative Qualitative Estimation) indicator, upgraded with additional filters for higher precision in swing trading setups.
✨ Features:
- Dynamic QQE smoothing and filtering
- Optional trend filter using RSI or moving average
- Buy/sell signals with visual markers
- Works well for trend continuation and divergence detection
⚙️ Inputs:
- Toggle QQE calculation type (classic, RSI-based, or hybrid)
- Enable/disable smoothing filters
- Adjust RSI/QQE lengths and thresholds
- Choose confirmation filters
📊 Usage:
- Best suited for 1H, 4H, and Daily charts
- Use Buy signals during uptrends and Sell signals during downtrends
- Can be combined with support/resistance and candlestick confirmation
🛠️ Notes:
- No repainting of signals
- For swing and position traders
- All filters are optional and can be configured in the settings
---
This version is built for reliable trade confirmation and filtering out false signals common in regular QQE indicators.

TrendLine + AlertsThe TrendLine + Alerts indicator is an advanced technical analysis tool designed to quickly identify trend direction using various moving averages and RMSD deviation. It dynamically generates buy and sell signals and visually marks entry points with price labels on the chart. Additionally, an optional transaction table can be toggled on or off, displaying buy and sell prices along with the percentage returns of individual trades and an aggregated summary row, facilitating the evaluation of trading strategy performance.
🔧 Key Features:
- Supports multiple moving average types: SMA, EMA, HMA, DEMA, TEMA, RMA, FRAMA
- Dynamic trend analysis based on RMSD deviation, adaptable to current market conditions
- Color-coded trend indication: green for uptrends, red for downtrends
- Alert generation: real-time buy and sell signals (TrendLine BUY / SELL)
- Price labels on the chart for better visualization of entry/exit points
- Interactive settings panel allowing selection of data source (open, close, high, low etc.), adjustable moving average length, and RMSD deviation multiplier
- Optionally displays a dynamic transaction table (toggleable via chart settings) that shows:
- Buy: entry prices
- Sell: exit prices
- Percent: percentage return of each trade, displayed as a number
- A summary row that aggregates the percentage returns, offering a quick evaluation of trading performance
⚙️ Settings:
- Ability to select the data source: open, close, high, low, oc2, hl2, occ3, hlc3, ohlc4, hlcc4
- Adjustable moving average length
- Customizable RMSD deviation multiplier
- Toggle switch to enable or disable the transaction table
🚀 Application:
Ideal for traders seeking an effective method to identify trends and turning points in the market. It is suitable for both short-term day trading and long-term trend analysis, with adjustable settings to suit individual trading strategies.
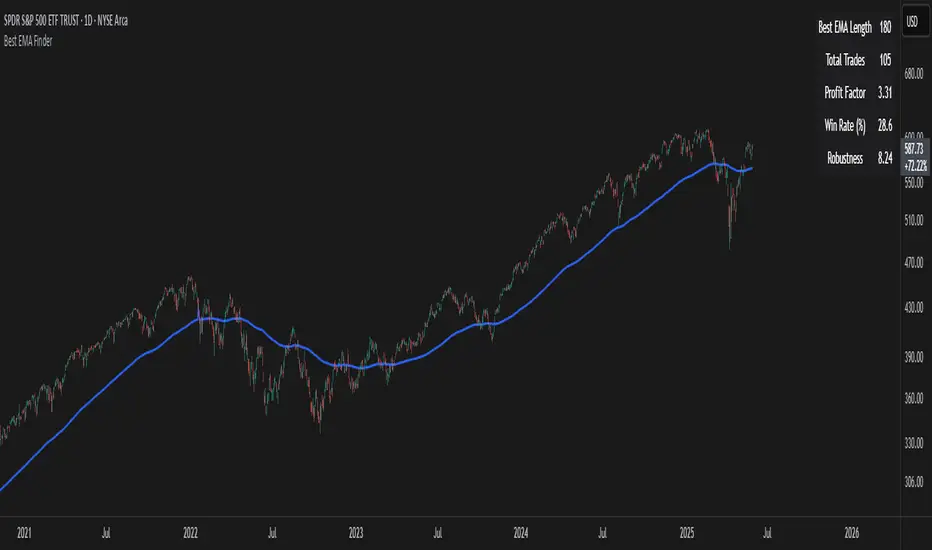
Best EMA FinderThis script, Best EMA Finder, is based on the same original logic as the Best SMA Finder I published previously. Although it was not the initial goal of the project, several users asked for an EMA version, so here it is.
The script scans a wide range of Exponential Moving Average (EMA) lengths, from 10 to 500, and identifies the one that historically delivered the most robust performance on the current chart. The choice to stop at 500 is deliberate: beyond that point, EMA curves tend to flatten and converge, adding processing time without meaningful differences in signals or outcomes.
Each EMA is evaluated using a custom robustness score:
Profit Factor × log(Number of Trades) × sqrt(Win Rate)
Only EMA lengths that exceed a user-defined minimum number of trades are considered valid. Among these, the one with the highest robustness score is selected and displayed on the chart.
A table summarizes the results:
- Best EMA length
- Total number of trades
- Profit Factor
- Win Rate
- Robustness Score
You can adjust:
- Strategy type: Long Only or Buy & Sell
- Minimum number of trades required
- Table visibility
This script is designed for analysis and optimization only. It does not execute trades or handle position sizing. Only one open trade per direction is considered at a time.
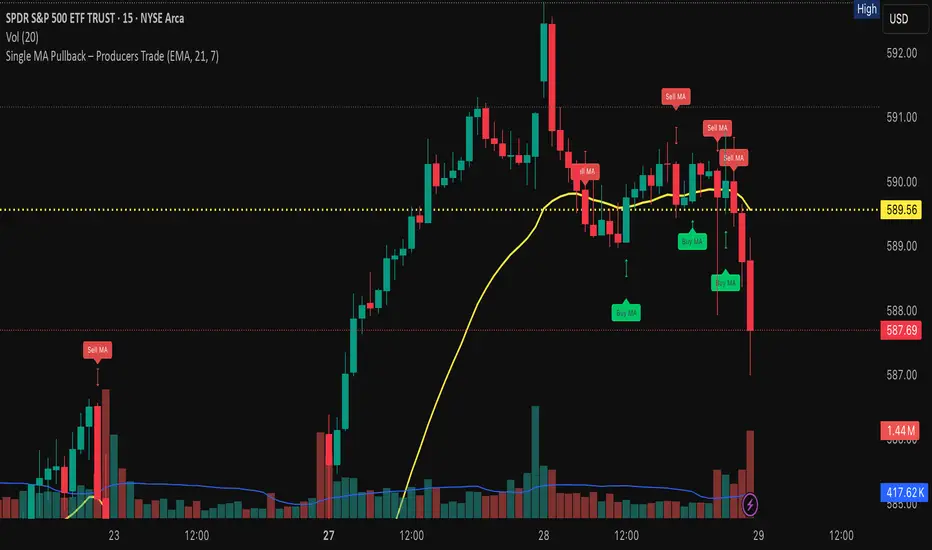
Single MA Pullback – Producers TradeHow to Use the “Single MA Pullback – Producers Trade” Indicator
This indicator helps options traders identify high-probability CALL and PUT signals based on price reacting to a single moving average.
⸻
✅ How It Works
• Select your preferred MA type (EMA, SMA, WMA, VWMA) and length.
• A Buy signal (CALL) is generated when price crosses above the MA.
• A Sell signal (PUT) is generated when price crosses below the MA.
• Visual arrows mark each signal, and a label suggests an option contract with strike and expiration.
⸻
🧠 Features
• Strike prices are automatically calculated ~1% out of the money.
• Expiration dates target the next Friday, based on the current day of the week.
• Symbol-specific strike rounding (e.g., 1 for SPY/XSP, 5 for most stocks).
⸻
📆 Expiration Date Notes
• Expiration dates shown in the label are based on a best-estimate to the next Friday.
• Depending on the time of day or day of week, the date may be off by one day.
• Always verify expiration dates on your trading platform before placing a trade.
⸻
📌 Important Tip on Expiration
A further out expiration is almost always a better idea — especially for:
• Avoiding time decay (theta)
• Holding through small pullbacks
• Letting your trade develop with less pressure
Even when the label suggests a short-dated contract, you can manually choose a longer expiration (e.g., 2–3 weeks out) for added safety and flexibility.
⸻
📈 Trading Suggestions
1. Green arrow = CALL setup. Red arrow = PUT setup.
2. Labels include trade type, strike price, and suggested expiration.
3. Confirm the signal with volume, price structure, or catalyst.
4. Manage your risk with proper sizing and optional stop-loss/target planning.
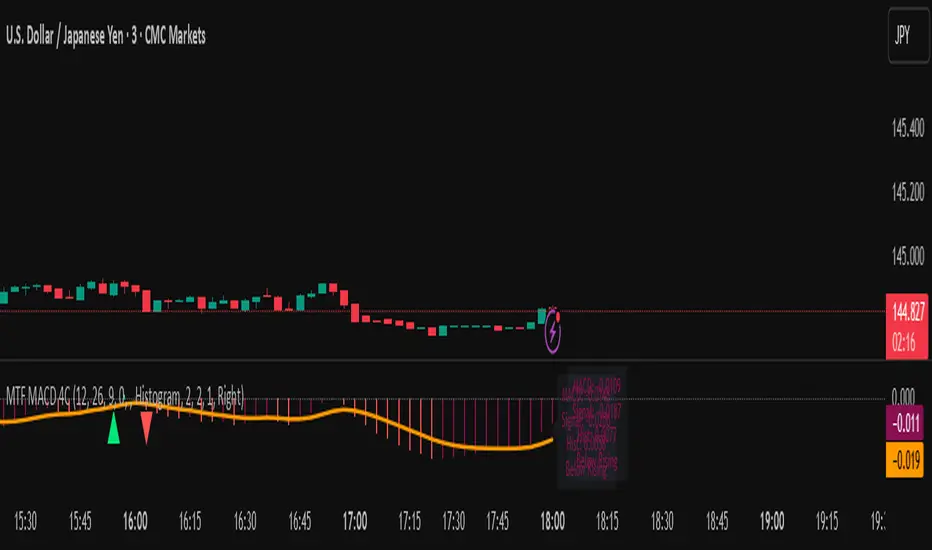
MTF MACD 4-Color Momentum System🎯 Overview
The MTF MACD 4-Color Momentum System is an advanced MACD indicator that provides crystal-clear momentum visualization through an innovative 4-color state system. Unlike traditional MACD indicators that only show positive/negative values, this indicator identifies four distinct market states to help traders make more informed decisions.
📊 Key Features
1. Four-State Color System:
🟢 Lime: Above zero + Rising (Strong Bullish Momentum)
🟢 Dark Green: Above zero + Falling (Weakening Bullish Momentum)
🔴 Red: Below zero + Falling (Strong Bearish Momentum)
🔴 Maroon: Below zero + Rising (Weakening Bearish Momentum)
2. Multi-Timeframe Analysis:
View higher timeframe MACD on lower timeframe charts
Confirm trends across multiple timeframes
Reduce false signals with multi-timeframe confluence
3. Flexible Display Options:
Three visualization styles: Histogram, Columns, or Line
Toggle individual color states on/off
Customizable colors and line widths
4. Advanced Features:
Optional histogram smoothing to reduce noise
Zero-cross alerts with visual markers
Color state change alerts
Real-time value display
Customizable signal line overlay
💡 How to Use
1. Momentum Identification:
Lime bars indicate strong upward momentum - ideal for long entries
Dark green suggests momentum is slowing - consider taking profits
Red bars show strong downward momentum - ideal for short entries
Maroon indicates potential reversal brewing - prepare for direction change
2. Zero Line Crosses:
Blue triangles mark bullish crosses above zero
Pink triangles mark bearish crosses below zero
Use these as confirmation signals with other indicators
3. Multi-Timeframe Confirmation:
Set to higher timeframe (e.g., 4H on 15m chart)
Look for alignment between timeframes before entering trades
Avoid trades against higher timeframe momentum
⚙️ Settings Guide
MACD Parameters:
Fast EMA: 12 (default) - Adjust for more/less sensitivity
Slow EMA: 26 (default) - Standard MACD setting
Signal: 9 (default) - Smoothing period
Display Customization:
Choose between Histogram, Columns, or Line display
Enable/disable specific color states
Adjust visual properties to match your chart theme
Alerts:
Zero cross alerts for trend changes
Color state alerts for momentum shifts
📈 Trading Strategies
1. Momentum Continuation:
Enter longs when MACD turns lime (above zero + rising)
Enter shorts when MACD turns red (below zero + falling)
Exit when color shifts to "weakening" state
2. Reversal Trading:
Watch for maroon in downtrends (potential bottom)
Watch for dark green in uptrends (potential top)
Confirm with price action and support/resistance
3. Multi-Timeframe Confluence:
Use daily MACD on 1H chart for trend direction
Enter on lower timeframe signals in direction of higher timeframe
Avoid counter-trend trades when higher timeframe shows strong momentum
🎓 Pro Tips
Combine with volume indicators for confirmation
Use with support/resistance levels for better entries
Enable smoothing in choppy markets to reduce false signals
Pay attention to divergences between price and MACD
⚠️ Risk Disclaimer
This indicator is for educational purposes only. Always use proper risk management and combine with other analysis methods. Past performance does not guarantee future results.
Hull Moving Average RibbonGradient Wave HMA - Multi-Ribbon Hull Moving Average System
Overview
The Gradient Wave HMA is an advanced technical indicator that transforms Alan Hull's Hull Moving Average (HMA) into a dynamic multi-layered ribbon system. Unlike traditional moving average ribbons that use simple or exponential calculations, this indicator applies Hull's innovative lag-reduction formula across 12 different timeframes simultaneously, creating a visually striking gradient effect that flows with market momentum.
Technical Foundation
This indicator is built upon the Hull Moving Average, developed by Alan Hull in 2005. The HMA uses a weighted moving average calculation designed to almost eliminate lag while maintaining curve smoothness:
HMA = WMA(2*WMA(n/2) − WMA(n), sqrt(n))
Credit: Alan Hull (www.alanhull.com)
Key Features
Multi-Period Ribbon Structure
12 individual HMA lines with customizable periods
Preset configurations for different trading styles:
Fast: 3-30 period range (scalping/intraday)
Swing: 8-55 period range (swing trading)
Position: 20-100 period range (position trading)
Custom: User-defined periods
2. Neon Gradient Visualization
Bullish Gradient: Transitions from blue-purple to hot purple
Bearish Gradient: Flows from hot pink to purple-pink
Each line has a unique color in the spectrum
Gradient fills between lines create depth and visual flow
3. Advanced Alert System
Trend Reversal Alerts: Notifies when ribbon changes direction
Price Breakout Alerts: Triggers when price crosses the ribbon
Compression Alerts: Signals potential breakouts during consolidation
Expansion Alerts: Confirms strong trending conditions
Momentum Surge Alerts: Catches explosive moves early
How It Works
The indicator calculates 12 Hull Moving Averages, each with a different period length. The trend direction is determined by the middle HMA (6th line), which triggers the color change across the entire ribbon. When trending up, the ribbon displays a purple gradient; when trending down, it shifts to a pink gradient.
Trading Applications
1. Trend Identification
Ribbon color indicates overall trend direction
All lines moving in sync confirms strong trend
Mixed signals suggest choppy or transitioning markets
2. Dynamic Support/Resistance
In uptrends, the ribbon acts as moving support
In downtrends, it provides resistance levels
Multiple layers offer various strength levels
3. Momentum Analysis
Expanding ribbon = Increasing momentum
Contracting ribbon = Decreasing momentum/consolidation
Ribbon angle indicates trend strength
4. Trading Example
Advantages Over Traditional MAs
Reduced Lag: Hull's formula provides faster response than SMA/EMA ribbons
Visual Clarity: Gradient effect makes trend changes immediately visible
Multiple Timeframes: 12 periods provide comprehensive market view
Flexibility: Presets adapt to different trading styles
Best Practices
Use higher timeframes (4H, Daily) for position trading
Combine with volume indicators for confirmation
Watch for ribbon compression before major moves
Consider overall market conditions when interpreting signals
Customization Options
Adjust individual HMA periods
Fine-tune transparency for different backgrounds
Choose between WMA and EMA base calculations
The Gradient Wave HMA combines Alan Hull's breakthrough moving average formula with modern visualization techniques to create a powerful trend-following tool that's both technically sophisticated and visually intuitive.

NoNoiseMA & SlopeHappy trade,
This is a noise-reduced moving average — let's call it the No-Noise MA. A MA where false breakout price action should have little to no impact, while the main trend remains fully represented. In comparison to previous MAs this one's trend appear more linear, and sideways price actions becomes easier to detect thanks to it's unique two filter stages.
In short, the No-Noise-MA (Noise-Reduced Moving Average) is calculated as the cumulative sum of the slopes derived from the center line of the last x pivot points. Let’s break it down step by step:
Pivot Detection:
A pivot algorithm (an adapted variant of the Bilson-Gann-Count method) identifies consecutive pivot points (high, low, high, low, etc.) in the close price series. Let's call this set of Pivots S.
Center Line Calculation:
Out of the set S the last x pivots are used to compute a center line (linear regression line). Always when a new pivot is confirmed, the oldest pivot in the queue is removed, and the new pivot is added.
Slope Extraction:
The center line is defined by its equation shown in the image below
Image 1
Cumulative Slope Sum:
As shown in the image 1 the slope is a series with values around zero. The No-Noise-MA is then just the cumulative sum of the slope series and a correction term. A correction term is needed otherwise the No-Noise-MA would run away over time from the original close price. The correction term is just the deviation between close price and cumulative slope sum multiply with a factor around 0.01 added to the No-Noise-MA.
Noise Reduction:
The goal of noise reduction is done by two filter stages. First Filter is the reduction of the input values. As shown above not all bars close prices are use, instead it uses just the pivot points delivered by the Bilson-Gann-Count method. Favorable the Bilson-Gann-Count method delivers the Pivot points in most cases much faster as other Pivot methods. Already after two bars a new Pivot is confirmed. This takes out all ups and downs between two consecutive Pivots. This first filter stage is legit because all price action in between is hedged by the Pivots.
The second filter stage is the done by the length of the center line. As more pivots are used to calculate the center line as smoother the slope becomes. Out liners just gets less impact if the base is bigger. So the number of involved Pivots has the same meaning as the lengths in any other MA.
Comparison with usual MAs:
For a comparison with other MAs this script also calculate the average lengths of the center line, shown in the upper right chart. So choose for example SMA and set the length parameter to the average length of the center line. As shown in the following image 2.
Image 2
This way both MAs have the same data base and can be objectively compared.
Trend detection:
The slope of the center line can be used for trend confirmation. A slope bigger then zero is an up trend while a slope smaller then zero is a down trend. And side way price action is indicated when the slope is around zero within a certain threshold.
Image 3
One hint should be mentioned here. The side way section gets indicated much later. About the number of bars as the center line is long. Before that there are just up or down trend predicted. In the image 2 you see the slope is firstly tin and as more bars past by the slope becomes more thick. This should indicate the point where no side way predictions will happens anymore.
Variation of calculation
In the settings menu you can find the setting "Include last close to center line". With this activated the center line is calculated with the last pivots and the last close price. The last close price is assumed as a pivot too. This gives the slope a more early reaction to volatile price action. But also brings back some noise.

Melody Markets Moving Average Transitions🎵 Melody Markets Moving Average Transitions – The Ultimate Trend State Indicator 🎵
📌 Indicator Description
Melody Markets Moving Average Transitions is a powerful indicator designed to accurately represent the market trend state by combining the 5 main moving averages (MA7, MA20, MA50, MA100, MA200) and their 120 possible configurations.
Unlike traditional indicators that display moving averages separately, this tool synthesizes these multiple combinations into a dynamic trend line, which can be displayed directly on the selected moving average or via a specially calculated dynamic moving average.
It provides a clear and precise view of trend strength and momentum, helping traders better anticipate price movements.
🔍 Key Features
✅ Comprehensive Trend State → Analyzes up to 120 configurations between 5 moving averages for a detailed trend state.
✅ Dynamic Trend Line → Simple and intuitive visualization of the trend via a single line, shown directly on the chosen MA or the dynamic MA.
✅ Signal Visualization → Displays signals generated by each moving average, facilitating decision-making.
✅ Relevant Pullbacks Display → Highlights meaningful pullbacks according to trend strength and context.
✅ Fully Customizable → Choose moving averages, toggle signals and pullbacks, and customize colors.
✅ Overlay on Price Chart → Smooth and clear integration directly on the price chart.
📖 How to Use Melody Markets Moving Average Transitions?
1️⃣ Select the moving average (MA7, MA20, MA50, MA100, MA200) to track the trend state.
2️⃣ Activate the dynamic trend line to visualize overall market direction in real-time.
3️⃣ Enable signal and pullback displays to catch key trade setups and corrections.
4️⃣ Customize colors and display options to suit your trading style.
5️⃣ Combine with other technical tools for enhanced entry and exit confirmations.
🎯 Who Is This Indicator For?
🔹 Trend Traders & Swing Traders → Get a clear, precise overview of trend strength and pullbacks.
🔹 Day Traders & Scalpers → Quickly identify relevant signals without clutter.
🔹 Beginner to Advanced Traders → Intuitive and comprehensive trend analysis for all levels.
🔥 Conclusion
Melody Markets Moving Average Transitions revolutionizes trend analysis by combining complex moving average configurations into a single, clear dynamic line and signal system. It empowers traders with a deeper understanding of market conditions, improving decision-making and timing.
📌 Add it to your chart now and experience trend analysis like never before! 🚀
