Median True Range {Darkoexe}Simple and sweet, this is the median true range. It reviews the size of the previous period amount of candles, and displays the candle size value that is the median of those previous values.
//Darkoexe
Moving Averages

MA Pullback Signal V1.1 [Tujac]This indicator will help you to find a MA Pullback Signal.
Features
Entry signals are generated under the following conditions:
Condition 1: When the 10, 20, and 50-period Moving Averages (MAs) are in either a bullish or bearish alignment , and their intervals narrow before expanding , a signal will appear.
Additionally , the Stochastic oscillator must be in an oversold/overbought zone , and the signal will only trigger if volume increases upon the 10-period MA breaking through the 20-period MA after a bounce.
Condition 2: When the 20, 50, and 100-period MAs are in either a bullish or bearish alignment , and their intervals narrow before expanding , a signal will appear.
Additionally , the Stochastic oscillator must be in an oversold/overbought zone , and the signal will only trigger if volume increases upon the 20-period MA breaking through the 50-period MA after a bounce.
Condition 3: If the 50-period MA and 200-period MA are in a bullish alignment , but the 10, 20, and 50-period MAs are in a bearish alignment , a signal will appear on a candle where a double bottom/double top forms, followed by an increase in volume .
Convergence Zone
Entry signals are hidden when the market is in a convergence zone .
Bollinger Bands, Keltner Channels, ADX, and Volume are used to determine if the market is in a convergence zone.
By default, entry signals will not appear in a convergence zone.
You can change the settings to allow signals to appear on candles that meet the entry conditions, even within a convergence zone.
Setting Options
Trend Type: Sets the type of Moving Average to determine pull-back entries.
MA F: Uses all four MAs (10/20/50/200) to determine pull-backs.
MA A/B/C: Uses only the 10/20/50 MAs to determine pull-backs.
MA F Trend: Sets which MA crossing the 200-period MA defines the base trend. The default is the 5-period MA.
MA Style: Sets the display style of the Moving Averages.
A: Displays the 200-period MA as a line and the 10/20-period MAs as a cloud.
B: Displays all 10/20/50/200-period MAs as lines.
C: Displays the 10/20-period MAs and the 90/100-period MAs as a cloud.
ADX Default: Sets the ADX value used to define the convergence zone.
Filter Squeeze: Enable this setting to hide entry signals during convergence zones.
Filter Over Sold/Bought: Enable this setting to hide entry signals when the market is in oversold/overbought zones.
Show Strong Signal: Displays signals with particularly high volume and price volatility.
Strength Level: Displays the strength of the signal.
Show All Signal: Displays both weak and strong signals.
Displays the 200-period MA as a line and the 10/20-period MAs as a cloud.
When the 10, 20, and 50-period Moving Averages (MAs) are in either a bullish or bearish alignment, and their intervals narrow before expanding, a signal will appear. Additionally, the Stochastic oscillator must be in an oversold/overbought zone, and the signal will only trigger if volume increases upon the 10-period MA breaking through the 20-period MA after a bounce.
Entry signals are hidden when the market is in a convergence zone.
The "Show All Signal" option allows you to display both weak and strong signals, providing a comprehensive view of all potential entry points identified by the system, regardless of their strength level.
If the 50-period MA and 200-period MA are in a bullish alignment, but the 10, 20, and 50-period MAs are in a bearish alignment, a signal will appear on a candle where a double bottom/double top forms, followed by an increase in volume.

MA OrderlinessMA Orderliness measures how well a series of simple moving averages (SMAs) are stacked in the expected order for a trending market and turns that measurement into a normalized oscillator. You choose how many MAs to include and the shortest and longest lengths. The script generates a family of evenly spaced SMAs between those lengths, then compares each pair: shorter MAs should lie above longer ones in an uptrend and below in a downtrend. When any pair is out of order, a “violation” score is accumulated, but violations between nearby MAs count more heavily than those between MAs that are far apart. All weights are summed, and the total weighted violations are converted into a score from –1 (completely reversed) to +1 (perfectly ordered).
This orderliness score is plotted as a line oscillator. A fixed horizontal line at +1 marks perfect order, and another at –1 marks perfect reversal. To smooth the raw oscillator and generate trading signals, the script also plots a simple moving average of the orderliness score over a user-defined period. When the unsmoothed score crosses above its moving average, a bullish crossover alert fires. When it crosses below, a bearish crossover alert fires.
Everything is calculated on each bar so you can see the oscillator evolve in real time. You can customize the number of MAs, their minimum and maximum lengths, and the length of the signal-line SMA to suit different timeframes or markets.

Color Vario Moving Average RibbonColor Vario Moving Average Ribbon – Smart Trend & Momentum Tool for Traders
The Color Vario Moving Average Ribbon is a powerful and customizable indicator that combines trend analysis, momentum detection, and volume confirmation — all in one clean and intuitive design.
🔍 Key Features:
✅ Dynamic Moving Averages (Up to 4)
• Choose from SMA, EMA, WMA, VWMA, or SMMA.
• Each MA line changes color based on price position (above = bullish, below = bearish).
• Great for spotting trend direction and momentum shifts at a glance.
📏 Distance from MAs (Table Display)
• Real-time display of how far price is from each MA (in % and points).
• Helps you assess extension, pullback depth, or reversion potential quickly.
📈 ADR% (Average Daily Range)
• Calculates average volatility using high-low ranges.
• Useful for setting realistic targets, stops, and risk assessments.
🔊 RVol (Relative Volume)
• Compares current volume to the average of recent days.
• Highlights whether volume is above or below normal (green = strong, red = weak).
• Perfect for volume confirmation during entries or breakouts.
⚡ Yellow Dot Signal (Momentum Spike)
• Appears when:
• Price moves more than a custom % from the previous candle.
• Volume is higher than your defined minimum.
• A visual cue for strong price + volume moves, helping you catch momentum trades early.
🎨 UI Customization
• Light/Dark mode compatibility.
• Adjust table size and position for your layout preference.
⸻
🚀 Who Should Use This?
This indicator is ideal for:
• Swing Traders looking for clean trend signals
• Intraday Traders who rely on momentum and volume
• Positional Traders tracking price behavior around key MAs
⸻
📌 Final Words
The Color Vario MA Ribbon is more than just a ribbon — it’s a compact trend, momentum, and volume dashboard built for traders who need clarity and precision.
Whether you’re looking for cleaner entries, stronger confirmations, or smarter exits, this tool adds serious edge to your trading chart.
💬 Don’t forget to give your feedback in the comments!
MFI + RSI + EMA Dynamic SignalsThe MFI + RSI + EMA Dynamic Signals is a designed to combine with widened criteria to capture more trading opportunities, it balances momentum, trend, and flexibility, making it suitable for trading on timeframes like 15-minute to 4-hour charts.
How It Works
The indicator uses three technical components with relaxed criteria to produce signals:
Money Flow Index (MFI) for Momentum Extremes:
The MFI, calculated over a 14-period length, measures buying and selling pressure using price and volume. A buy signal can trigger when MFI crosses above the oversold level (default: 30, widened from 20), indicating potential buying pressure, while a sell signal can occur when MFI crosses below the overbought level (default: 70, widened from 80), suggesting selling pressure.
Relative Strength Index (RSI) for Momentum Confirmation:
The RSI, calculated over a 14-period length, confirms momentum strength. Bullish momentum is confirmed when RSI is above a buy threshold (default: 45, relaxed from 50), and bearish momentum when below a sell threshold (default: 55, relaxed from 50), allowing more signals near neutral momentum levels.
Exponential Moving Average (EMA) for Trend Sensitivity:
The indicator uses a fast EMA (default: 9 periods) and a slow EMA (default: 21 periods) to detect trend direction and crossovers. Signals can trigger when the fast EMA crosses the slow EMA, or when the fast EMA is within a proximity threshold (default: 0.5%) of the slow EMA, capturing early trend changes and increasing signal frequency.
Signal Generation
Signals are generated using the previous bar’s values to prevent repainting, with widened criteria for more frequent triggers:
Buy Signal: Either the MFI crosses above the oversold level or the fast EMA crosses above the slow EMA, and either RSI confirms bullish momentum (above 45) or the EMAs are near a crossover (within 0.5%). Displayed as a green upward triangle below the bar.
Sell Signal: Either the MFI crosses below the overbought level or the fast EMA crosses below the slow EMA, and either RSI confirms bearish momentum (below 55) or the EMAs are near a crossover (within 0.5%). Displayed as a red downward triangle above the bar.

True Momentum IndexTrue Momentum Index (TMI) — Precision Trading by Trading_Tomm
The True Momentum Index (TMI) is a cutting-edge technical indicator developed for traders who demand accuracy, clarity, and consistency across all market conditions. Designed by Trading_Tomm , this indicator provides a reliable method to identify high-probability entry and exit points by analyzing real-time momentum shifts and volatility levels.
Key Benefits:
1. Multi-Timeframe Versatility: Whether you're scalping on a 1-minute chart or investing on the weekly, TMI adapts seamlessly to your strategy.
2. Enhanced Risk Management: By highlighting optimal trade zones, TMI helps improve your reward-to-risk ratio and reduce exposure to false signals.
3. Clear Trend Detection: Instantly distinguish between trending, ranging, or consolidating markets.
4. Breakout Confirmation: Spot true breakout opportunities with confidence, supported by Bollinger Band overlays.
5. Universal Applicability: Works effectively with stocks, forex, cryptocurrency, commodities, and indices.
TMI’s intuitive visual presentation and precision signals make it an essential tool for both new and experienced traders. Whether you're trading volatile crypto markets or steady equities, the True Momentum Index gives you the edge to trade with discipline, clarity, and confidence.
Start using the True Momentum Index and take your trading strategy to the next level -maximize potential, minimize uncertainty.

EMA with ColoringDescription:
The "EMA with Coloring" indicator plots a customizable Exponential Moving Average (EMA) on the price chart, with its color dynamically changing based on the Ichimoku Cloud's trend signals. This tool helps traders identify trend direction and potential trading opportunities by combining the simplicity of an EMA with the robust trend analysis of the Ichimoku system. The EMA changes color to reflect bullish (uptrend), bearish (downtrend), or neutral (in-cloud) market conditions, making it easier to spot trend shifts and trade setups.
How It Works:
EMA Calculation: The indicator calculates an EMA based on the user-defined period (default: 9). The EMA is plotted directly on the price chart, overlaying candlesticks or bars.
Ichimoku Coloring Logic: The EMA’s color is determined by an underlying Ichimoku Cloud system:
Green (Uptrend): When the price is above the Ichimoku Cloud and bullish conditions are confirmed (e.g., Conversion Line above Base Line and rising momentum).
Red (Downtrend): When the price is below the Ichimoku Cloud and bearish conditions are confirmed (e.g., Conversion Line below Base Line and falling momentum).
ATR Whipsaw Protection: The indicator uses an Average True Range (ATR) filter to reduce false signals during choppy markets, ensuring more reliable trend identification.
Customizable Settings:
EMA Length: Adjust the period of the EMA (default: 9) to make it more or less sensitive to price changes.
Uptrend/Downtrend Colors: Choose from Green, Red, or Blue for the EMA’s color in bullish or bearish conditions.
Transparency: Set the EMA’s opacity (default: 0, fully opaque) for better visibility on the chart.
How to Trade It:
Trend Identification:
Bullish (Green EMA): Indicates a strong uptrend. Look for buying opportunities when the EMA turns green, especially if the price is above the cloud and the EMA is sloping upward.
Bearish (Red EMA): Indicates a strong downtrend. Consider selling or shorting when the EMA turns red, particularly if the price is below the cloud and the EMA is sloping downward.
Neutral (Gray EMA): Signals a range-bound market. Avoid trend-based trades and consider range trading or waiting for a breakout.
Entry Signals:
Long Entry: Enter a buy trade when the EMA changes from gray or red to green, and the price breaks above a recent high or key resistance, confirming bullish momentum.
Short Entry: Enter a sell/short trade when the EMA changes from gray or green to red, and the price breaks below a recent low or key support, confirming bearish momentum.
Exit Signals:
Exit long trades when the EMA turns gray or red, indicating a potential trend reversal or consolidation.
Exit short trades when the EMA turns gray or green, suggesting the downtrend may be weakening.
Risk Management:
Use stop-losses below recent swing lows (for longs) or above swing highs (for shorts) to protect against unexpected reversals.
Combine with support/resistance levels, candlestick patterns, or other indicators (e.g., RSI, MACD) for confirmation.
Tips:
Adjust the EMA length to suit your trading style: shorter periods (e.g., 5–10) for scalping/day trading, longer periods (e.g., 20–50) for swing trading.
Test the indicator on your preferred timeframe and asset to optimize settings.
Settings:
EMA Settings:
EMA Length: Default is 9. Increase for smoother trends, decrease for more sensitivity.
EMA Color Settings:
Uptrend EMA Color: Choose Green, Red, or Blue (default: Green) for bullish conditions.
Downtrend EMA Color: Choose Green, Red, or Blue (default: Red) for bearish conditions.
EMA Color Transparency: Default is 0 (fully opaque). Adjust to 10–100 for partial transparency if needed.
Notes:
Best used on timeframes where trends are clear (e.g., 1H, 4H, Daily).
The Ichimoku logic runs in the background with fixed parameters optimized for reliability, so only the EMA and color settings are adjustable.
Always backtest and practice on a demo account before using in live trading.

Consecutive Candle CounterConsecutive Condition Counter is a versatile indicator that tracks and visualizes consecutive candles based on user-defined market conditions. It helps traders quickly identify streaks of bullish or bearish signals by counting how many bars in a row satisfy the selected condition.
🔍 Features:
Three selectable conditions via a dropdown:
Up & Down Days: Counts consecutive up or down candles. Each up candle adds +1, each down candle subtracts -1. The counter resets when direction changes.
RSI Signal: Counts how many consecutive bars RSI remains above 70 (+1 per bar) or below 30 (-1 per bar). Resets when RSI moves back to the neutral zone.
SMA Positioning: Counts consecutive bars where price stays above (+1) or below (-1) a Simple Moving Average (SMA). SMA period is user-defined.
📊 Visualization:
Positive streaks are shown in green, negative streaks in red, and neutral values in gray.
Displayed as a histogram below the chart for quick pattern recognition.
⚙️ Inputs:
Choose condition logic from the dropdown.
Configure the RSI period and SMA period as needed.
This tool can be helpful for identifying momentum streaks, overbought/oversold trends, or trend-following behavior in a visually intuitive way.

Clock&Flow MM+InfoThis script is an indicator that helps you visualize various moving averages directly on the price chart and gain some additional insights.
Here's what it essentially does:
Displays Different Moving Averages: You can choose to see groups of moving averages with different periods, set to nominal cyclical durations. You can also opt to configure them for instruments traded with classic or extended trading hours (great for Futures), and they'll adapt to your chosen timeframe.
Colored Bands: It allows you to add colored bands to the background of the chart that change weekly or daily, helping you visualize time cycles. You can customize the band colors.
Information Table: A small table appears in a corner of the chart, indicating which cycle the moving averages belong to (daily, weekly, monthly, etc.), corresponding to the timeframe you are using on the chart.
Customization: You can easily enable or disable the various groups of moving averages or the colored bands through the indicator's settings.
It's a useful tool for traders who use moving averages to identify trends and support/resistance levels, and who want a quick overview of market cycles.
Questo script è un indicatore che aiuta a visualizzare diverse medie mobili direttamente sul grafico dei prezzi e a ottenere alcune informazioni aggiuntive.
In pratica, fa queste cose:
Mostra diverse medie mobili: Puoi scegliere di vedere gruppi di medie mobili con periodi diversi impostati sulle durate cicliche nominali. Puoi scegliere se impostarle per uno strumento quotato con orario di negoziazione classico o esteso (ottimo per i Futures) e si adattano al tuo timeframe).
Bande colorate: Ti permette di aggiungere delle bande colorate sullo sfondo del grafico che cambiano ogni settimana o ogni giorno, per aiutarti a visualizzare i cicli temporali. Puoi scegliere il colore delle bande.
Tabella informativa: In un angolo del grafico, compare una piccola tabella che indica a quale ciclo appartengono le medie mobili (giornaliero, settimanale, mensile, ecc.) e corrispondono in base al timeframe che stai usando sul grafico.
Personalizzazione: Puoi facilmente attivare o disattivare i vari gruppi di medie mobili o le bande colorate tramite le impostazioni dell'indicatore.
È uno strumento utile per i trader che usano le medie mobili per identificare trend e supporti/resistenze, e che vogliono avere un colpo d'occhio sui cicli di mercato.
HTF High/Low Targets This script plots the previous Highs and Lows of the 1HR, 4HR, Daily, and Weekly timeframes.
Each level is color-coded, extends across the chart, and includes labels to help you spot key areas of past support and resistance.
Use this tool to:
- Confirm intraday price reactions at HTF zones
- Identify high-probability reversal or breakout areas
- Get notified with built-in alerts when price crosses a level
You can toggle each timeframe level on/off in the settings panel.
Great for:
- Day traders and scalpers who trade off 1-minute or 5-minute charts
-Swing traders looking for confluence with HTF zones
- Anyone using a multi-timeframe analysis approach
Created by @mychaellesliemedia.

Dual Pwma Trends [ZORO_47]Key Features:
Dual PWMA System: Combines a fast and slow Parabolic Weighted Moving Average to identify momentum shifts and trend changes with precision.
Dynamic Color Coding: The indicator lines change color to reflect market conditions—green for bullish crossovers (potential buy signals) and red for bearish crossunders (potential sell signals), making it easy to interpret at a glance.
Customizable Parameters: Adjust the fast and slow PWMA lengths, power settings, and source data to tailor the indicator to your trading style and timeframe.
Clean Visualization: Plotted with bold, clear lines (3px width) for optimal visibility on any chart, ensuring you never miss a signal.
How It Works:
The indicator calculates two PWMAs using the imported ZOROLIBRARY by ZORO_47. When the fast PWMA crosses above the slow PWMA, both lines turn green, signaling a potential bullish trend. Conversely, when the fast PWMA crosses below the slow PWMA, the lines turn red, indicating a potential bearish trend. The color persists until the next crossover or crossunder, providing a seamless visual cue for trend direction.
Ideal For:
Trend Traders: Identify trend reversals and continuations with clear crossover signals.
Swing Traders: Use on higher timeframes to capture significant price moves.
Day Traders: Fine-tune settings for faster signals on intraday charts.
Settings:
Fast Length/Power: Control the sensitivity of the fast PWMA (default: 12/2).
Slow Length/Power: Adjust the smoother, slower PWMA (default: 21/1).
Source: Choose your preferred data input (default: close price).
Adaptive Multi-TF Indicator Table with Presets giua64📌 Script Name:
Adaptive Multi-Timeframe Indicator Table with Presets — giua64
📄 Description:
This script displays an adaptive multi-timeframe dashboard that summarizes the signals of three key technical indicators:
Moving Averages (MAs), Relative Strength Index (RSI), and MACD.
It provides a fast and visually intuitive overview of market conditions across five timeframes (5m, 15m, 30m, 1h, 4h), helping traders quickly identify potential directional biases (e.g., bullish, bearish, or neutral) based on either predefined presets or fully manual settings.
🧰 Preset Configurations:
You can choose between four trading styles, each with optimized indicator parameters:
Scalping
• MAs: 5 / 10 (Fast), 20 / 50 (Slow)
• RSI: 7 periods | Overbought: 70 | Oversold: 30
• MACD: 5 / 13 | Signal: 3
Intraday
• MAs: 9 / 21 (Fast), 50 / 100 (Slow)
• RSI: 14 periods | Overbought: 60 | Oversold: 40
• MACD: 12 / 26 | Signal: 9
Swing
• MAs: 10 / 20 (Fast), 50 / 200 (Slow)
• RSI: 14 periods | Overbought: 65 | Oversold: 35
• MACD: 12 / 26 | Signal: 9
Manual
• Full custom control over all indicator settings.
🛠️ All settings can be customized manually from the options panel, including the exact MA periods, RSI thresholds, and MACD structure.
🧠 How It Works:
For each timeframe, the script evaluates:
MA crossover status (two levels):
The first symbol refers to the crossover of the fast MAs
The second symbol refers to the crossover of the slow MAs
🟢 = Bullish crossover
🔴 = Bearish crossover
➖ = Flat or no clear signal
RSI Direction:
↑ = RSI above upper threshold (potential overbought)
↓ = RSI below lower threshold (potential oversold)
→ = RSI in neutral range
MACD Line vs Signal Line:
↑ = MACD line is above signal line (bullish)
↓ = MACD line is below signal line (bearish)
→ = Flat or neutral signal
Each signal is assigned a numerical score. These are aggregated per timeframe to compute a combined score that reflects the directional bias for that specific time window.
🧠 Adaptive Logic by Asset:
This script is designed to be universally compatible across all asset types — including forex, crypto, stocks, indices, and commodities.
Thanks to its multi-timeframe nature and flexible indicator presets, the script automatically adjusts its behavior based on the asset selected, ensuring relevant analysis without requiring manual recalibration.
🧾 Summary Table Output:
At the bottom of the dashboard, a combined sentiment is displayed for:
3TF → 5m, 15m, 30m
4TF → Adds 1h
5TF → Adds 4h
Each row shows:
Signal → LONG / SHORT / NEUTRAL
Confidence (%) → Based on score aggregation and signal consistency
📌 Customization Options:
Table Position: Left, Right, or Center
Text Size: Small, Normal, or Large
Full Manual Configuration: All MA, RSI, and MACD parameters can be adjusted as needed
⚠️ Disclaimer:
This script is for educational and analytical purposes only.
It does not constitute financial advice or guarantee any trading results.
Always do your own research and apply responsible risk management.

CCT SuperTrade 2025CCT SuperTrade 2025
An original combination of two well-established methodologies for identifying potential market entry and exit opportunities.
General Concept
This script merges principles from the Hi-Lo Activator and the “Holy Grail” strategy developed by Linda Raschke and Laurence Connors. It was conceived by the Central Crypto Traders team and remains closed-source to protect the originality of its logic and scoring system.
Hi-Lo Activator
The Hi-Lo Activator focuses on points of price compression followed by breakouts, much like a compressed spring releasing its energy. This indicator monitors market contraction using simple MAs focusing in low and High candle points.
Holy Grail
Based on the work of Linda Raschke and Laurence Connors, the “Holy Grail” centers on 20-period simple moving average and pullbacks in trending markets using ADX indicator. In this script, we incorporate additional price filters to reinforce the identification of strong trends and pinpoint entry opportunities during retracements.
Unique Scoring System
The script’s logic evaluates multiple factors (trend, momentum, volatility) and generates a proprietary scoring system.
Each signal arises from a confluence of criteria, providing clearer indications for traders looking to identify buy or sell opportunities.
Triple Bollinger Bands and Strategic Zoning
This indicator integrates a customized triple Bollinger Bands setup to establish clear internal trading zones: Sell Zone, Neutral Zone, and Buy Zone. These zones guide traders on potential market reversals or continuation points. Additionally, the outer Bollinger Band set at 3 standard deviations (Dev3) identifies extreme volatility boundaries—price action rarely sustains movements beyond this level, signaling potential short-term exhaustion or reversal points.
Color Candle System (Trend + Volume + Momentum)
The indicator utilizes an advanced 9-color candle system, combining real-time trend, volume, and momentum data into a visual scale. Each candle color corresponds to a unique market condition, providing traders with instant and intuitive insights into current market sentiment and strength.
Additional Indicator Features
The indicator also includes several supplementary tools to enhance analysis precision:
Four customizable moving averages, selectable among EMA, SMA, WMA, HMA, DEMA, and VWMA, allowing tailored trend analysis.
A proprietary Fibonacci-based trendline, developed exclusively by our team, for dynamic identification of market direction and key support/resistance levels.
Labels clearly identifying plotted lines, significantly simplifying chart interpretation.
Pivot indicators, highlighting critical swing-high and swing-low points, aiding traders in spotting potential market reversals and continuation patterns.
The indicator also features an optional flag to highlight Inside Bars, candlestick patterns indicating price consolidation that can signal impending breakouts or reversals.
The indicator includes dedicated signals to detect potential Pump and Dump scenarios, identified through abnormal volume spikes coupled with significant short-term price fluctuations, warning traders of potentially manipulated or highly speculative market movements.
The indicator identifies possible trend reversals triggered by volume spikes, highlighting moments when significant increases in trading volume coincide with abrupt price changes, potentially signaling exhaustion or initiation of new trends.
Parabolic SAR Integration
The indicator also integrates the Parabolic SAR (Stop and Reverse), clearly marking dynamic points of trend reversal on the chart. This allows traders to quickly visualize potential changes in market direction and manage trade entries or exits more effectively.
Integrated Information Panel
The indicator features a dynamic Info Panel that provides real-time textual readings of all relevant indicators used within the combined strategies. This panel conveniently displays values such as trend strength, momentum status, volatility levels, stochastic signals, ADX strength, and other key metrics already mapped by the script, allowing traders to quickly interpret market conditions and make informed decisions.
Usage and Application
Designed for various trading styles (swing or intraday), this indicator highlights trend shifts and potential reversal points.
When applied to the chart, CCT SuperTrade 2025 should be active unically to avoid unnecessary clutter and ensure straightforward interpretation.
Originality
The key innovation lies in the way we combine and score the signals using our unique score system with the “Hi-Lo Strategy” and the “Holy Grail.”
The code is closed-source due to the unique research and development carried out by our team, resulting in a hybrid algorithm that has no open-source equivalent.
Disclaimer
This script does not guarantee success and does not replace independent analysis. Financial markets carry risks; traders should proceed with caution and further study before making decisions. DYOR
Technical Disclaimer
This indicator is programmed using Pine Script V6, leveraging standard functions and calculations provided by ©TradingView , ensuring the accuracy, integrity, and reliability of the presented market data and signals. However, past performance does not guarantee future results. Always conduct independent analysis and trade responsibly.
It is important to clarify that the CCT SuperTrade 2025 is not a “multi-indicator” developed solely for the purpose of aggregating various visual tools into a single script.
Each of its components—despite being optionally visible as standalone plots—feeds critical data into the script’s integrated scoring system.
These internal modules are interdependent, and none function in isolation or deliver valid signals independently.
Therefore, this makes the CCT SuperTrade 2025 a singular, cohesive algorithm rather than a modular toolkit. The architecture was intentionally designed this way to preserve the logic, flow, and accuracy of the signal generation engine, reinforcing the integrity of the system as a whole. Any attempt to separate these components would compromise the core mechanism and invalidate its analytical structure.

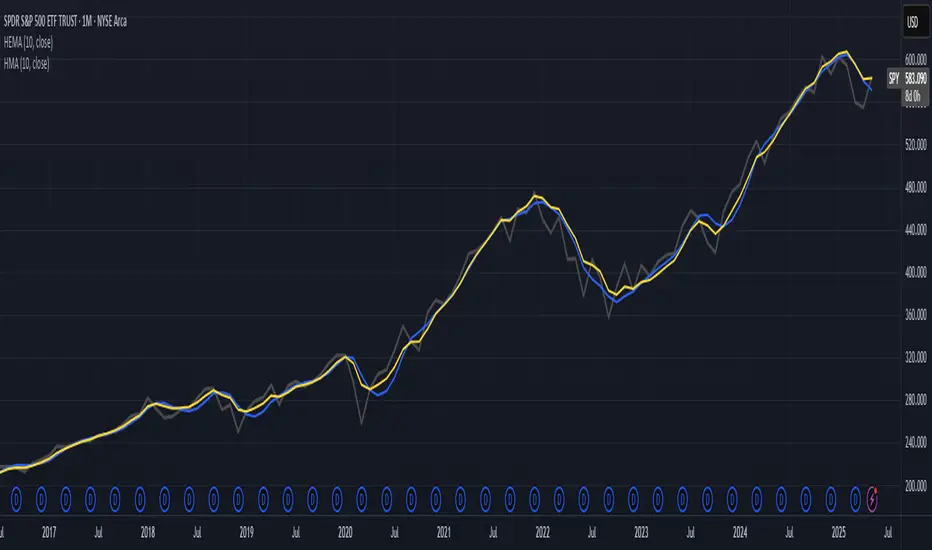
Hull-Exponential Moving Average (HEMA)The Hull Exponential Moving Average (HEMA) is an experimental technical indicator that uses a sequence of Exponential Moving Averages (EMAs) with the same logic as HMA - except with EMAs and not WMAs. It aims to create a responsive yet smooth trend indicator than HMA.
HEMA applies a multi-stage EMA process. Initial EMAs are calculated using alphas derived from logarithmic relationships and the input period. Their outputs are then combined in a de-lagging step, which itself uses a logarithmically derived ratio. A final EMA smoothing pass is then applied to this de-lagged series. This creates a moving average that responds quickly to genuine price changes while maintaining effective noise filtering. The specific alpha calculations and the de-lagging formula contribute to its balance between responsiveness and smoothness.
▶️ **Core Concepts**
Logarithmically-derived alphas: Alpha values for the three EMA stages are derived using natural logarithms and specific formulas related to the input period **N**.
Three-stage EMA process: The calculation involves:
An initial EMA (using **αS**) on the source data.
A second EMA (using **αF**) also on the source data.
A de-lagging step that combines the outputs of the first two EMAs using a specific ratio **r**.
A final EMA (using **αFin**) applied to the de-lagged series.
Specific de-lagging formula: Utilizes a constant ratio **r = ln(2.0) / (1.0 + ln(2.0))** to combine the outputs of the first two EMAs, aiming to reduce lag.
Optimized final smoothing: The alpha for the final EMA (**αFin**) is calculated based on the square root of the period **N**.
Warmup compensation: The internal EMA calculations include a warmup mechanism to provide more accurate values from the initial bars. This involves tracking decay factors (**eS**, **eF**, **eFin**) and applying a compensation factor **1.0 / (1.0 - e_decay)** during the warmup period. A shared warmup duration is determined by the smallest alpha among the three stages.
HEMA achieves its characteristics through this multi-stage EMA process, where the specific alpha calculations and the de-lagging step are key to its responsiveness and smoothness.
▶️ **Common Settings and Parameters**
Period (**N**): Default: 10 | Base lookback period for all alpha calculations | When to Adjust: Increase for longer-term trends and more smoothness, decrease for shorter-term signals and more responsiveness
Source: Default: Close | Data point used for calculation | When to Adjust: Change to HL2, HLC3, or OHLC4 for different price representations
Pro Tip: The HEMA's behavior is sensitive to the **Period** setting due to the non-linear relationships in its alpha calculations. Experiment with values around your typical MA periods. Small changes in **N** can have a noticeable impact, especially for smaller **N** values.
▶️ **Calculation and Mathematical Foundation**
Simplified explanation:
HEMA calculates its value through a sequence of three Exponential Moving Averages (EMAs) with specially derived smoothing factors (alphas).
Two initial EMAs are calculated from the source price, using alphas **αS** and **αF**.
The outputs of these two EMAs are combined into a "de-lagged" series.
This de-lagged series is then smoothed by a third EMA, using alpha **αFin**, to produce the final HEMA value.
All internal EMAs use a warmup compensation mechanism for improved accuracy on early bars.
Technical formula (let **N** be the input period):
1. Alpha for the first EMA (slow component related):
αS = 3.0 / (2.0 * N - 1.0)
2. Lambda for **αS** (intermediate value):
λS = -ln(1.0 - αS)
Note: **αS** must be less than 1, which implies 2N-1 > 3 or N > 2 for **λS** to be well-defined without NaN from ln of non-positive number. The code uses nz() for robustness but the formula implies this constraint.
3. De-lagging ratio **r**:
r = ln(2.0) / (1.0 + ln(2.0))
(This is a constant, approximately 0.409365)
4. Alpha for the second EMA (fast component related):
αF = 1.0 - exp(-λS / r)
5. Alpha for the final EMA smoothing:
αFin = 2.0 / (sqrt(N) / 2.0 + 1.0)
6. Applying the stages:
**OutputS = EMA_internal(source, αS, eS_state, emaS_state)**
**OutputF = EMA_internal(source, αF, eF_state, emaF_state)**
8. Calculate the de-lagged series:
DeLag = (OutputF / (1.0 - r)) - (r * OutputS / (1.0 - r))
9. Calculate the final HEMA:
HEMA = EMA_internal(DeLag, αFin, eFin_state, emaFin_state)
🔍 Technical Note: The HEMA implementation uses a shared warmup period controlled by **aMin** (the minimum of **αS**, **αF**, **αFin**). During this period, each internal EMA stage still tracks its own decay factor (**eS**, **eF**, **eFin**) to apply the correct compensation. The **nz()** function is used in the code to handle potential NaN values from alpha calculations if **N** is very small (e.g., **N=1** would make **αS=3**, **1-αS = -2**, **ln(-2)** is NaN).
▶️ **Interpretation Details**
HEMA provides several key insights for traders:
When price crosses above HEMA, it often signals the beginning of an uptrend
When price crosses below HEMA, it often signals the beginning of a downtrend
The slope of HEMA provides insight into trend strength and momentum
HEMA creates smooth dynamic support and resistance levels during trends
Multiple HEMA lines with different periods can identify potential reversal zones
HEMA is particularly effective for trend following strategies where both responsiveness and noise reduction are important. It provides earlier signals than traditional EMAs while exhibiting less whipsaw than standard HMA in choppy market conditions. The indicator excels at identifying the underlying trend direction while filtering out minor price fluctuations.
▶️ **Limitations and Considerations**
Experimental nature: As an experimental indicator, HEMA may behave differently from established HMA in certain market conditions
Lag characteristics: While designed to reduce lag, HEMA may exhibit slightly more lag than HMA in some scenarios due to the long tail of EMA
Mathematical complexity: The multi-stage calculation with specialized alpha parameters makes the behavior less intuitive to understand
Parameter sensitivity: Performance can vary significantly with different period settings
Complementary tools: Works best when combined with volume analysis or momentum indicators for confirmation
▶️ **References**
Hull, A. (2005). "Hull Moving Average," Technical Analysis of Stocks & Commodities .
RetryClaude can make mistakes. Please double-check responses.
Triple cloud📘 Tripple Cloud – Explanation and Functionality
Tripple Cloud is an advanced visualization of moving averages (EMA and MA) across the current timeframe and up to two higher timeframes (HTF1 and HTF2). It provides a fast visual overview of both local and overall trend direction.
✅ Features
🔹 1. Local Cloud (current timeframe)
EMA 13, 25, and 32 form the "cloud".
The background is automatically colored:
Green tones: Uptrend (faster EMA above slower)
Red tones: Downtrend (faster EMA below slower)
🔹 2. HTF Cloud (first higher timeframe)
Displays the same EMA cloud (13/25/32) for a higher timeframe (e.g., Daily when you're on 4H).
The background is shown in subtle green/red shades.
Optional display of EMA 50, 200 and MA 100, 300 in grayscale.
🔹 3. HTF2 Cloud (second higher timeframe)
Same principle as HTF1 – even higher level (e.g., Weekly when you're on 4H).
Visualized in gray tones, helping you spot long-term trends.
⚙️ Settings
Automatic HTF selection: The script automatically chooses suitable higher timeframes based on the current one (e.g., 1m → 5m and 1h).
Manual HTF 1 & 2: You can also manually select the higher timeframes.
Show/hide HTF clouds and EMAs: Enable or disable HTF1 and HTF2 individually.
Everything updates automatically when switching chart timeframes.
💡 Use Cases
Use Tripple Cloud to:
Spot confluence between local and higher timeframe trends
Avoid trading against major market direction
Detect early trend reversals on higher timeframes
Analyze both intraday and swing setups with clarity

Customizable 10‑MA SuiteCustomizable 10‑Moving‑Average Suite
OverviewPlot up to 10 independent moving averages on a single chart. Every line can be tailored to your trading style with adjustable length, timeframe, MA type (SMA, EMA, WMA, RMA, VWMA, HMA, LinReg), data source, colour, width, and plot style.
Key Features
True multi‑time‑frame support via request.security(): mix intraday and higher‑time‑frame MAs effortlessly.
Fine‑grained visibility control: toggle each MA on/off to keep charts clean and script performance high.
Versatile display options: choose between line, step, histogram, or area plots for every MA.
Typical Use‑Cases
Quickly compare short‑, medium‑, and long‑term trends.
Identify dynamic support/resistance and moving‑average crossovers.
Add confluence to existing strategies or discretionary setups.
Pro TipHighlight your primary trend MA with a thicker line and bolder colour, while setting secondary MAs to thinner or dashed styles—this keeps focus where it matters and prevents visual clutter.
Enjoy!
EMA Distance Indicator [Eddie_Bitcoin]🧠 EMA Distance Indicator
This indicator is a powerful statistical tool designed to provide enhanced context and signal confirmation for traders who want to go beyond price action alone.
🔍 What It Does
It calculates and visualizes the distance (%) between two EMAs (Fast & Slow) on either the current chart symbol or a selected macro/index reference (e.g., BTC Dominance, TOTAL2, SPX). But it doesn't stop there:
Core Features:
✅ Real-time percentage distance between Fast and Slow EMAs
📈 Slope (acceleration) of the distance to capture trend momentum
🎯 Gaussian-based percentile rank of the current distance over a configurable historical sample
📊 Dynamic table display with intuitive emoji-based cues
🟢 Highlights extreme conditions (e.g., TOP 5% or LOW 5% percentile zones)
🔀 Compare both current asset and a macro/index asset side by side
💡 Display Modes:
Show only current symbol
Show only index/macro symbol
Show both with independently positioned tables
🎯 Ideal Use Case
This is not a standalone strategy, but rather a statistical enhancement module designed to pair with tools like my 👉 “AltCoin Index Correlation” indicator. It gives traders a quick-glance view of strength, divergence, and macro alignment for better timing and confidence.
Whether you’re trading altcoins, tracking dominance charts, or watching indices, this tool offers deep visual insight into EMA-based dynamics — wrapped in a clean, emoji-driven UI.
🛠 Created with ❤️ by @Eddie_Bitcoin
🚀 ### Check my profile for other juicy hints and original strategies. ### 🚀

My S.T.A.C.K.📊 My S.T.A.C.K. (Simplified TA Combined Kit)
All your favorite technical tools in one clean, customizable overlay.
My S.T.A.C.K. is a power-packed indicator designed to streamline your chart by combining the most commonly used technical analysis tools into a single, space-saving script. Whether you're a trend trader, swing trader, or just looking to declutter your view — this kit gives you everything you need, nothing you don’t.
🔧 Features:
5 Customizable Moving Averages: Choose your type (SMA, EMA, WMA, etc.) and periods to match your strategy.
Bollinger Bands: Visualize volatility and overbought/oversold zones with precision.
Donchian Channels: Spot breakouts and trend reversals based on high/low ranges.
ATR Bands: Adaptive support/resistance zones based on Average True Range.
Clean Visualization: Toggle each element on or off, adjust colors, and focus only on what matters.
✅ Ideal For:
- Traders who want multiple indicators in one place
- Reducing indicator clutter on TradingView
- Quick visual analysis without switching scripts

Anchored VWAP by Time (Math by Thomas)📄 Description
This tool lets you plot an Anchored Volume Weighted Average Price (VWAP) starting from any specific date and time you choose. Unlike standard VWAPs that reset daily or weekly, this version gives you full control to track institutional pricing zones from precise anchor points—such as key swing highs/lows, market open, or news-driven candles.
It’s especially useful for price action and Smart Money Concepts (SMC) traders who track liquidity, fair value gaps (FVGs), and institutional zones.
🇮🇳 For NSE India Traders
You can anchor VWAP to Indian market open (e.g., 9:15 AM IST) or major events like RBI policy, earnings, or breakout candles.
The time input uses UTC by default, so for Indian Standard Time (IST), remember:
9:15 AM IST = 3:45 AM UTC
3:30 PM IST = 10:00 AM UTC
⚙️ How to Use
Add the indicator to your chart.
Open the settings panel.
Under “Anchor Start Time”, choose the date & time to begin the VWAP.
Use UTC format (adjust from IST if needed).
Customize the line color and thickness to suit your chart style.
The VWAP will begin plotting from that time forward.
🔎 Best Use Cases
Track VWAP from intraday range breakouts
Anchor from swing highs/lows to identify mean reversion zones
Combine with your FVGs, Order Blocks, or CHoCHs
Monitor VWAP reactions during key macro events or expiry days
🔧 Clean Design
No labels are used, keeping your chart clean.
Works on all timeframes (1min to Daily).
Designed for serious intraday & positional traders.

Beyond Insights IndicatorThe Beyond Insights Indicator is a multi-timeframe overlay tool designed for TradingView that displays key Exponential Moving Averages (EMAs) and volatility insights to support various trading strategies. It intelligently adapts its display based on the current chart timeframe to reduce clutter and enhance relevance. Specifically, it shows EMA 6, 18, and 50 when viewing intraday timeframes.
In addition to EMAs, the indicator includes an ATR (Average True Range) calculation with a default length of 14, offering insight into market volatility.

Mimas buy and sellBollinger Bands: Calculated using a simple moving average (basis) and standard deviation (dev).
EMAs: Two exponential moving averages (EMA 5 and EMA 20) are plotted to identify short-term and long-term trends.
Price Action Patterns: The script detects higher highs and higher lows for bullish conditions, and lower highs and lower lows for bearish conditions.
Trend Strength: An exponential moving average of the price change is used to gauge the strength of the trend.
Trade Signals: Buy and sell signals are plotted on the chart when specific conditions are met, combining price action patterns, trend strength, Bollinger Bands, and EMA crossovers.
Take-Profit Levels: Dynamic take-profit levels are calculated based on recent swing highs and lows, adjusted by a user-defined multiplier. These levels are displayed on the chart using plot to draw horizontal lines.

DECODE Moving Average ToolkitDECODE Moving Average Toolkit: Your All-in-One MA Analysis Powerhouse!
This versatile indicator is designed to be your go-to solution for analysing trends, identifying potential entry/exit points, and staying ahead of market movements using the power of Moving Averages (MAs).
Whether you're a seasoned trader or just starting out, the Decode MAT offers a comprehensive suite of features in a user-friendly package.
Key Features:
Multiple Moving Averages: Visualize up to 10 Moving Averages simultaneously on your chart.
Includes 5 Exponential Moving Averages (EMAs) and 5 Simple Moving Averages (SMAs).
Easily toggle the visibility of each MA and customize its length to suit your trading style and the asset you're analyzing.
Dynamic MA Ribbons: Gain a clearer perspective on trend direction and strength with 5 configurable MA Ribbons.
Each ribbon is formed between a corresponding EMA and SMA (e.g., EMA 20 / SMA 20).
The ribbon color changes to indicate bullish (e.g., green) or bearish (e.g., red) sentiment, providing an intuitive visual cue.
Toggle ribbon visibility with a single click.
Powerful Crossover Alerts: Never miss a potential trading opportunity with up to 5 customizable MA Crossover Alerts.
Define your own fast and slow MAs for each alert from any of the 10 available MAs.
Receive notifications directly through TradingView when your specified MAs cross over or cross under.
Optionally display visual symbols (e.g., triangles ▲▼) directly on your chart at the exact crossover points for quick identification.
Highly Customizable:
Adjust the source price (close, open, etc.) for all MA calculations.
Fine-tune the appearance (colors, line thickness) of every MA line, ribbon, and alert symbol to match your charting preferences.
User-Friendly Interface: All settings are neatly organized in the indicator's input menu, making configuration straightforward and intuitive.
How Can You Use the Decode MAT in Your Trading?
This toolkit is incredibly versatile and can be adapted to various trading strategies:
Trend Identification:
Use longer-term MAs (e.g., 50, 100, 200 period) to identify the prevailing market trend. When prices are consistently above these MAs, it suggests an uptrend, and vice-versa.
Observe the MA ribbons: A consistently green ribbon can indicate a strong uptrend, while a red ribbon can signal a downtrend. The widening or narrowing of the ribbon can also suggest changes in trend momentum.
Dynamic Support & Resistance:
Shorter-term MAs (e.g., 10, 20 period EMAs) can act as dynamic levels of support in an uptrend or resistance in a downtrend. Look for price pullbacks to these MAs as potential entry opportunities.
Crossover Signals (Entries & Exits):
Golden Cross / Death Cross: Configure alerts for classic crossover signals. For example, a 50-period MA crossing above a 200-period MA (Golden Cross) is often seen as a long-term bullish signal. Conversely, a 50-period MA crossing below a 200-period MA (Death Cross) can be a bearish signal.
Shorter-Term Signals: Use crossovers of shorter-term MAs (e.g., EMA 10 crossing EMA 20) for more frequent, shorter-term trading signals. A fast MA crossing above a slow MA can signal a buy, while a cross below can signal a sell.
Use the on-chart symbols for quick visual confirmation of these crossover events.
Confirmation Tool:
Combine the Decode MAT with other indicators (like RSI, MACD, or volume analysis) to confirm signals and increase the probability of successful trades. For instance, a bullish MA crossover combined with an oversold RSI reading could strengthen a buy signal.
Multi-Timeframe Analysis:
Apply the toolkit across different timeframes to get a broader market perspective. A long-term uptrend on the daily chart, confirmed by a short-term bullish crossover on the 1-hour chart, can provide a higher-confidence entry.
The DECODE Moving Average Toolkit empowers you to tailor your MA analysis precisely to your needs.

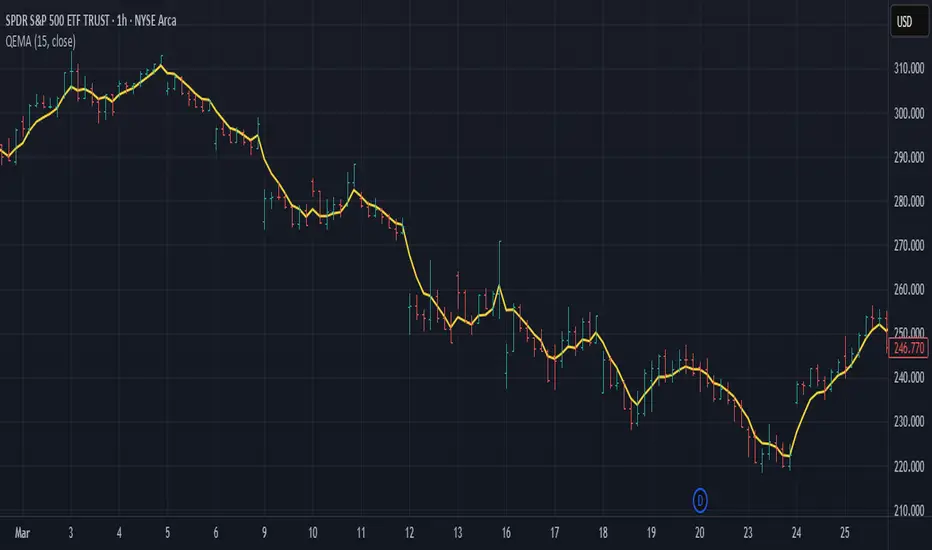
Quadruple EMA (QEMA)The Quadruple Exponential Moving Average (QEMA) is an advanced technical indicator that extends the concept of lag reduction beyond TEMA (Triple Exponential Moving Average) to a fourth order. By applying a sophisticated four-stage EMA cascade with optimized coefficient distribution, QEMA provides the ultimate evolution in EMA-based lag reduction techniques.
Unlike traditional compund moving averages like DEMA and TEMA, QEMA implements a progressive smoothing system that strategically distributes alphas across four EMA stages and combines them with balanced coefficients (4, -6, 4, -1). This approach creates an indicator that responds extremely quickly to price changes while still maintaining sufficient smoothness to be useful for trading decisions. QEMA is particularly valuable for traders who need the absolute minimum lag possible in trend identification.
▶️ **Core Concepts**
Fourth-order processing: Extends the EMA cascade to four stages for maximum possible lag reduction while maintaining a useful signal
Progressive alpha system: Uses mathematically derived ratio-based alpha progression to balance responsiveness across all four EMA stages
Optimized coefficients: Employs calculated weights (4, -6, 4, -1) to effectively eliminate lag while preserving compound signal stability
Numerical stability control: Implements initialization and alpha distribution to ensure consistent results from the first calculation bar
QEMA achieves its exceptional lag reduction by combining four progressive EMAs with mathematically optimized coefficients. The formula is designed to maximize responsiveness while minimizing the overshoot problems that typically occur with aggressive lag reduction techniques. The implementation uses a ratio-based alpha progression that ensures each EMA stage contributes appropriately to the final result.
▶️ **Common Settings and Parameters**
Period: Default: 15| Base smoothing period | When to Adjust: Decrease for extremely fast signals, increase for more stable output
Alpha: Default: auto | Direct control of base smoothing factor | When to Adjust: Manual setting allows precise tuning beyond standard period settings
Source: Default: Close | Data point used for calculation | When to Adjust: Change to HL2 or HLC3 for more balanced price representation
Pro Tip: Professional traders often use QEMA with longer periods than other moving averages (e.g., QEMA(20) instead of EMA(10)) since its extreme lag reduction provides earlier signals even with longer periods.
▶️ **Calculation and Mathematical Foundation**
Simplified explanation:
QEMA works by calculating four EMAs in sequence, with each EMA taking the previous one as input. It then combines these EMAs using balancing weights (4, -6, 4, -1) to create a moving average with extremely minimal lag and high level of smoothness. The alpha factors for each EMA are progressively adjusted using a mathematical ratio to ensure balanced responsiveness across all stages.
Technical formula:
QEMA = 4 × EMA₁ - 6 × EMA₂ + 4 × EMA₃ - EMA₄
Where:
EMA₁ = EMA(source, α₁)
EMA₂ = EMA(EMA₁, α₂)
EMA₃ = EMA(EMA₂, α₃)
EMA₄ = EMA(EMA₃, α₄)
α₁ = 2/(period + 1) is the base smoothing factor
r = (1/α₁)^(1/3) is the derived ratio
α₂ = α₁ × r, α₃ = α₂ × r, α₄ = α₃ × r are the progressive alphas
Mathematical Rationale for the Alpha Cascade:
The QEMA indicator employs a specific geometric progression for its smoothing factors (alphas) across the four EMA stages. This design is intentional and aims to optimize the filter's performance. The ratio between alphas is **r = (1/α₁)^(1/3)** - derived from the cube root of the reciprocal of the base alpha.
For typical smoothing (α₁ < 1), this results in a sequence of increasing alpha values (α₁ < α₂ < α₃ < α₄), meaning that subsequent EMAs in the cascade are progressively faster (less smoothed). This specific progression, when combined with the QEMA coefficients (4, -6, 4, -1), is chosen for the following reasons:
1. Optimized Frequency Response:
Using the same alpha for all EMA stages (as in a naive multi-EMA approach) can lead to an uneven frequency response, potentially causing over-shooting of certain frequencies or creating undesirable resonance. The geometric progression of alphas in QEMA helps to create a more balanced and controlled filter response across a wider range of movement frequencies. Each stage's contribution to the overall filtering characteristic is more harmonized.
2. Minimized Phase Lag:
A key goal of QEMA is extreme lag reduction. The specific alpha cascade, particularly the relationship defined by **r**, is designed to minimize the cumulative phase lag introduced by the four smoothing stages, while still providing effective noise reduction. Faster subsequent EMAs contribute to this reduced lag.
🔍 Technical Note: The ratio-based alpha progression is crucial for balanced response. The ratio r is calculated as the cube root of 1/α₁, ensuring that the combined effect of all four EMAs creates a mathematically optimal response curve. All EMAs are initialized with the first source value rather than using progressive initialization, eliminating warm-up artifacts and providing consistent results from the first bar.
▶️ **Interpretation Details**
QEMA provides several key insights for traders:
When price crosses above QEMA, it signals the beginning of an uptrend with minimal delay
When price crosses below QEMA, it signals the beginning of a downtrend with minimal delay
The slope of QEMA provides immediate insight into trend direction and momentum
QEMA responds to price reversals significantly faster than other moving averages
Multiple QEMA lines with different periods can identify immediate support/resistance levels
QEMA is particularly valuable in fast-moving markets and for short-term trading strategies where speed of signal generation is critical. It excels at capturing the very beginning of trends and identifying reversals earlier than any other EMA-derived indicator. This makes it especially useful for breakout trading and scalping strategies where getting in early is essential.
▶️ **Limitations and Considerations**
Market conditions: Can generate excessive signals in choppy, sideways markets due to its extreme responsiveness
Overshooting: The aggressive lag reduction can create some overshooting during sharp reversals
Calculation complexity: Requires four separate EMA calculations plus coefficient application, making it computationally more intensive
Parameter sensitivity: Small changes in the base alpha or period can significantly alter behavior
Complementary tools: Should be used with momentum indicators or volatility filters to confirm signals and reduce false positives
▶️ **References**
Mulloy, P. (1994). "Smoothing Data with Less Lag," Technical Analysis of Stocks & Commodities .
Ehlers, J. (2001). Rocket Science for Traders . John Wiley & Sons.