ADX EMA's DistanceIt is well known to technical analysts that the price of the most volatile and traded assets do not tend to stay in the same place for long. A notable observation is the recurring pattern of moving averages that tend to move closer together prior to a strong move in some direction to initiate the trend, it is precisely that distance that is measured by the blue ADX EMA's Distance lines on the chart, normalized and each line being the distance between 2, 3 or all 4 moving averages, with the zero line being the point where the distance between them is zero, but it is also necessary to know the direction of the movement, and that is where the modified ADX will be useful.
This is the well known Directional Movement Indicator (DMI), where the +DI and -DI lines of the ADX will serve to determine the direction of the trend.
Moving Averages

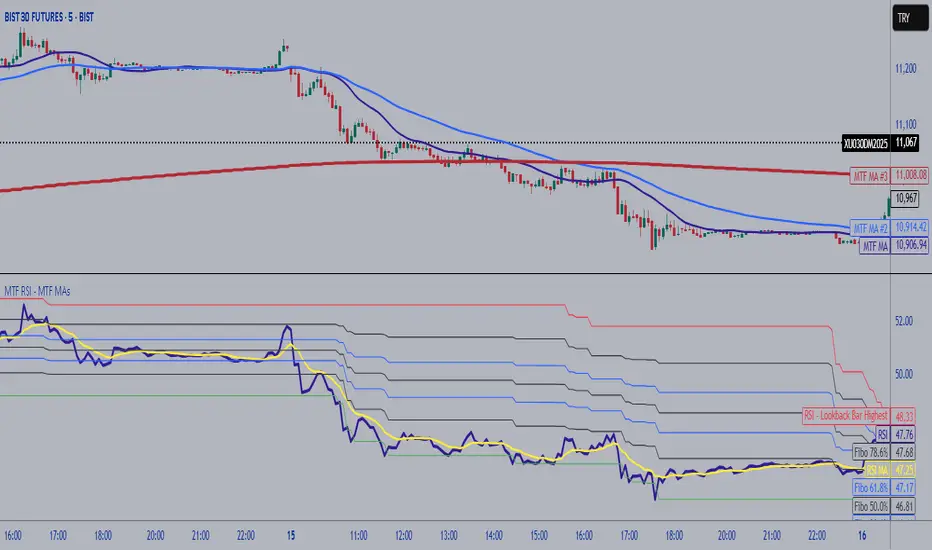
MTF RSI Fibonacci Levels & MTF Moving Avreages (EMA-SMA-WMA)Thanks for Kadir Türok Özdamar. @kadirturokozdmr
Formula Purpose of Use
This formula combines the traditional RSI indicator with Fibonacci levels to create a special technical indicator that aims to identify potential support and resistance points:
Thanks for Kadir Türok Özdamar. @kadirturokozdmr
Formula Purpose of Use
This formula combines the traditional RSI indicator with Fibonacci levels to create a special technical indicator that aims to identify potential support and resistance points:
Determines the historical RSI range of 144 periods (PEAK and DIP)
Calculates Fibonacci retracement levels within this range, and shows the direction of momentum by calculating the moving average of the RSI
This indicator can be used to identify potential reversal points, especially when the RSI is not in overbought (70+) or oversold (30-) areas.
Practical Use
Investors can use this indicator as follows:
1⃣When the RSI approaches one of the determined Fibonacci levels, it is considered a potential support/resistance area.
2⃣When the RSI approaches the DIP level, it can be interpreted as oversold, and when it approaches the PEAK level, it can be interpreted as overbought.
3⃣When the RSI crosses the SM (moving average) line upwards or downwards, it can be evaluated as a momentum change signal.
4⃣Fibonacci levels (especially M386, M500 and M618) can be monitored as important transition zones for the RSI.
--------------------------------------------
In this version, some features and a multi-timeframe averages (SMA-EMA-WMA) were added to the script. It was made possible for the user to enter multi-timeframe RSI and multi-timeframe Fibo lengths.
A.K Dynamic EMA/SMA / MTF S&R Zones Toolkit with AlertsThe A.K Dynamic EMA/SMA / MTF Support & Resistance Zones Toolkit is a powerful all-in-one technical analysis tool designed for traders who want a clean yet comprehensive market view. Whether you're scalping lower timeframes or swing trading higher timeframes, this indicator gives you both the structure and signals to take action with confidence.
Key Features:
✅ Customizable EMA/SMA Suite
Display key Exponential and Simple Moving Averages including 5, 9, 20, 50, 100, and 200 EMAs, plus optional 50 SMA for trend filtering. Each line can be toggled individually and color-customized.
✅ Multi-Timeframe Support & Resistance Zones
Automatically detects dynamic S/R zones on key timeframes (5min, 15min, 30min, 1H, 4H, 1D) using swing highs/lows. Zones are color-coded by strength and whether they're broken or active, providing a clear visual roadmap for price reaction levels.
✅ Zone Strength & Break Detection
Distinguishes between strong and weak zones based on price proximity and reaction depth, with visual shading and automatic label updates when a level is broken.
✅ Price Action-Based Buy/Sell Signals
Generates BUY signals when bullish candles react to strong support (supply) zones, and SELL signals when bearish candles react to strong resistance (demand) zones. All logic is adjustable — including candle body vs wick detection, tolerance range, and strength thresholds.
✅ Alerts Engine
Built-in TradingView alerts for price touching support/resistance or triggering buy/sell signals. Perfect for automation or hands-free monitoring.
✅ Optional Candle & Trend Filters
Highlight bullish/bearish candles visually for additional confirmation.
Optional RSI display and 50-period SMA trend filter to guide directional bias.
🧠 Use Case Scenarios:
Identify dynamic supply & demand zones across multiple timeframes.
Confirm trend direction with EMAs and SMA filters.
React quickly to clean BUY/SELL signals based on actual price interaction with strong zones.
Customize it fully to suit scalping, day trading, or swing trading strategies.
📌 Recommended Settings:
Use default zone transparency (65%) and offset (250 bars) for optimal visual clarity.
Enable alerts to get notified when price enters key S/R levels or when a trade signal occurs.
Combine this tool with your entry/exit plan for better decision-making under pressure.
💡 Pro Tip: Add this indicator to a clean chart and let the zones + EMAs guide your directional bias. Use alerts to avoid screen-watching and improve discipline.
Created by:
Version: Pine Script v6
Platform: TradingView

Moving Average Candles**Moving Average Candles — MA-Based Smoothed Candlestick Overlay**
This script replaces traditional price candles with smoothed versions calculated using various types of moving averages. Instead of plotting raw price data, each OHLC component (Open, High, Low, Close) is independently smoothed using your selected moving average method.
---
### 📌 Features:
- Choose from 13 MA types: `SMA`, `EMA`, `RMA`, `WMA`, `VWMA`, `HMA`, `T3`, `DEMA`, `TEMA`, `KAMA`, `ZLEMA`, `McGinley`, `EPMA`
- Fully configurable moving average length (1–1000)
- Color-coded candles based on smoothed Open vs Close
- Works directly on price charts as an overlay
---
### 🎯 Use Cases:
- Visualize smoothed market structure more clearly
- Reduce noise in price action for better trend analysis
- Combine with other indicators or strategies for confluence
---
> ⚠️ **Note:** Since all OHLC values are based on moving averages, these candles do **not** represent actual market trades. Use them for trend and structure analysis, not trade entries based on precise levels.
---
*Created to support traders seeking a cleaner visual representation of price dynamics.*

Rube Goldberg Top/Bottom Finder [theUltimator5]This is what I call the Rube Goldberg Top and Bottom Finder. It is an overly complex method of plotting a simple buy or sell label on a chart.
I utilize several standard TA techniques along with several of my own to try and locate ideal Buy/Sell conditions. I came up with the name because there are way too many conditional variables to come up with a single buy or sell condition, when most standard indicators use simple crossovers or levels.
There are two unique triggers that are calculated using completely independent techniques. If both triggers turn true within a small timeframe between each other, the buy/sell trigger turns true and plots a "buy" or "sell" label on the chart.
This indicator was designed to be fully functioning out of the box and can be customized only if the user wishes to. It is effective on all timeframes, but longer timeframes (daily +) may require signal length adjustment for best results.
imgur.com
The signals used in the leading trigger are as follows:
(1)RSI
The user can select among any of the following moving averages (base is EMA) (#3) , and have an RSI generated at a user defined length (base is 14). (#4)
SMA, EMA, DEMA, TEMA, WMA, VWMA, SMMA, HMA, LSMA, ALMA
The user can select whether or not the RSI is filtered with the following options:
None, Kalman, Double EMA, ALMA
The filter conditions are hard coded to minimize the amount of selections that the user is required to make to reduce the user interface complexity.
The user can define overbought (base 70) and oversold (base 30) conditions. (#2)
When the RSI crosses above or below the threshold values, the plot will turn red. This creates condition 1 of the leading trigger.
(2) ADX and DI
This portion of the indicator is a derivative of my ADX Divergence and Gap Monitor indicator.
This technique looks at the ADX value as well as for spikes in either +DI or -DI for large divergences. When the ADX reaches a certain threshold and also outpaces a preset ADX moving average, this creates condition 2 of the leading trigger.
There is an additional built-in functionality in this portion of the indicator that looks for gaps. It triggers when the ADX is below a certain threshold value and either the +DI or -DI spike above a certain threshold value, indicating a sudden gap in price after a period of low volatility.
The user can set whether or nor to show when a gap appears on the chart or as a label on the plot below the chart (disabled by default) . If the user chooses to overlay gaps on the chart, it creates a horizontal fill showing the starting point of the gap. The theory here is that the price will return at some point in the near future to the starting point of the gap.
imgur.com
(3) DI based Multi-Symbol reference and divergence
Part of the script computes both the +DI (positive directional index) and -DI (negative directional index) for the currently selected chart symbol and three reference symbols.
The averaged directional move of the reference symbols are compared to the current ticker on your chart and if the divergence exceeds a certain threshold, then the third condition of the trigger is met.
The components that are referenced are based on what stock/chart you are looking at. The script automatically detects if you are looking at a crypto, and uses a user selectable toggle between Large Cap or Small Cap. (#1) The threshold levels are determined by the asset type and market cap.
The leading trigger highlights under several conditions:
1) All (3) portions of the trigger result in true simultaneously
OR
2) Any of triggers 2 or 3 reach a certain threshold that indicates extreme market/price divergence as well as trigger 1 being overbought or oversold.
AND
3) If the trigger didn't highlight
For the lagging part of the trigger:
The lagging trigger is used as a confirmation after the leading trigger to indicate a possible optimized entry/exit point. It can also be used by itself, as well as the leading indicator.
The lagging indicator utilizes the parabolic Stop And Reverse (SAR). It utilizes the RSI length that is defined in portion 1 of the leading trigger as well as the overbought and oversold thresholds. I have found excellent results in catching reversals because it catches rate-of-change events rather than price reversals alone.
imgur.com
When both the leading triggers FOLLOWED BY the lagging trigger result in true within a user defined timeframe, then the buy or sell trigger results in true, plotting a label on the chart.
All portions of the leading and lagging indicators can be toggled on or off, but most of them are toggled off by default in order to reduce noise on the plot.
imgur.com
The leading, lagging, and buy/sell triggers each have built-in alerts that can be toggled on or off in the alert menu.
I have an optional built-in toggle to show green or red dots on the RSI line using two separate RSI lengths that are amplified and plot based on RSI divergence and strength. This can be used as a visual confirmation (or rejection) against the chart overlay plots.
imgur.com
This indicator is not a strategy, so there are no built-in exits or stop losses.

Simple Volatility ConeThe Simple Volatility Cone indicator projects the potential future price range of a stock based on recent volatility. It calculates rolling standard deviation from log returns over a defined window, then uses a confidence interval to estimate the upper and lower bounds the price could reach over a future time horizon. These bounds are plotted directly on the chart, offset into the future, allowing traders to visualize expected price dispersion under a geometric Brownian motion assumption. This tool is useful for risk management, trade planning, and visualizing the potential impact of volatility.

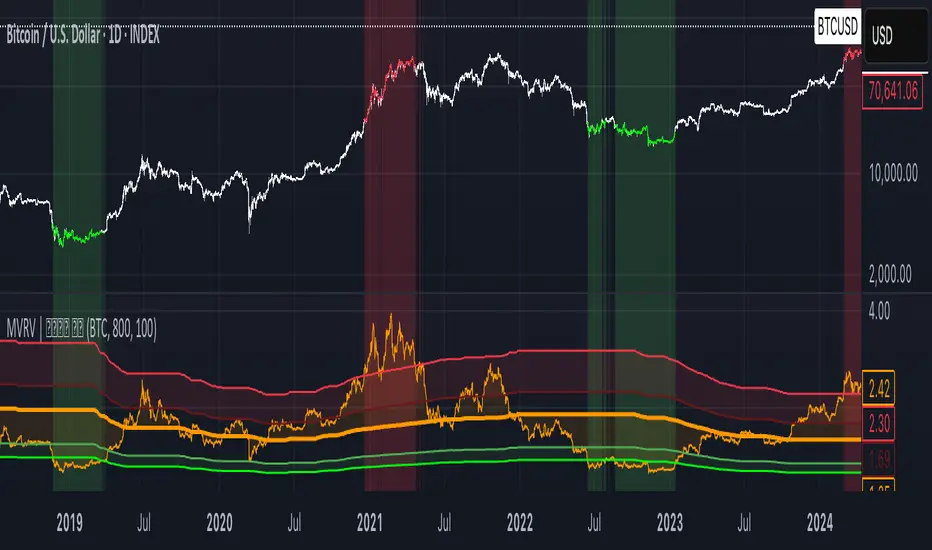
MVRV | Lyro RS📊 MVRV | Lyro RS is a powerful on-chain valuation tool designed to assess the relative market positioning of Bitcoin (BTC) or Ethereum (ETH) based on the Market Value to Realized Value (MVRV) ratio. It highlights potential undervaluation or overvaluation zones, helping traders and investors anticipate cyclical tops and bottoms.
✨ Key Features :
🔁 Dual Asset Support: Analyze either BTC or ETH with a single toggle.
📐 Dynamic MVRV Thresholds: Automatically calculates median-based bands at 50%, 64%, 125%, and 170%.
📊 Median Calculation: Period-based median MVRV for long-term trend context.
💡 Optional Smoothing: Use SMA to smooth MVRV for cleaner analysis.
🎯 Visual Threshold Alerts: Background and bar colors change based on MVRV position relative to thresholds.
⚠️ Built-in Alerts: Get notified when MVRV enters under- or overvalued territory.
📈 How It Works :
💰 MVRV Calculation: Uses data from IntoTheBlock and CoinMetrics to obtain real-time MVRV values.
🧠 Threshold Bands: Median MVRV is used as a baseline. Ratios like 50%, 64%, 125%, and 170% signal various levels of market extremes.
🎨 Visual Zones: Green zones for undervaluation and red zones for overvaluation, providing intuitive visual cues.
🛠️ Custom Highlights: Toggle individual threshold zones on/off for a cleaner view.
⚙️ Customization Options :
🔄 Switch between BTC or ETH for analysis.
📏 Adjust period length for median MVRV calculation.
🔧 Enable/disable threshold visibility (50%, 64%, 125%, 170%).
📉 Toggle smoothing to reduce noise in volatile markets.
📌 Use Cases :
🟢 Identify undervalued zones for long-term entry opportunities.
🔴 Spot potential overvaluation zones that may precede corrections.
🧭 Use in confluence with price action or macro indicators for better timing.
⚠️ Disclaimer :
This indicator is for educational purposes only. It should not be used in isolation for making trading or investment decisions. Always combine with price action, fundamentals, and proper risk management.
Bollinger Bands Z-ScoreBollinger Bands Z-Score Indicator
This indicator transforms the classic Bollinger Bands into a Z-Score oscillator displayed in a separate pane. It standardizes the Bollinger Bands’ basis line by calculating the Z-Score over a user-defined period, allowing you to see how many standard deviations the price deviates from the mean.
Upper and Lower Fixed Lines: These are set at +2 and -2 Z-Score levels, representing common thresholds for overbought and oversold conditions.
Z-Score Oscillator: The normalized Bollinger Bands oscillate smoothly between these fixed boundaries, providing a clearer perspective on volatility extremes.
Z-Score Table: Displayed on the right side, this table shows the current Z-Score value, along with fixed maximum (+2) and minimum (-2) limits, making it easy to track current momentum and volatility in real-time.
Use Cases:
Identify overextended price moves with standardized volatility measures.
Spot potential reversals or continuation setups by observing the Z-Score crossing key levels.
Complement traditional Bollinger Bands analysis with a statistically normalized perspective.
Input Parameters:
Length: The period used for Bollinger Bands and Z-Score calculation.
MA Type: Choose the moving average type for the basis line (SMA, EMA, SMMA, WMA, VWMA).
StdDev: Multiplier for the standard deviation bands.
Z-Score Length: The lookback period used to compute the mean and standard deviation for Z-Score normalization.
This indicator is perfect for traders seeking a statistically sound and visually clear representation of Bollinger Bands volatility and extremes.

(DAFE) DEVMA - Crossover (Deviation Moving Average) (DAFE) DEVMA - Crossover (Deviation Moving Average)
Let’s keep pushing the edge. After the breakthrough of Deviation over Deviation (DoD)—which gave traders a true lens into volatility’s hidden regime shifts—many asked: “What’s next?” The answer is DEVMA: a crossover engine built not on price, but on the heartbeat of the market itself.
Why is this different?
DEVMA isn’t just a moving average crossover. It’s a regime detector that tracks the expansion and contraction of deviation—giving you a real-time readout of when the market’s energy is about to shift. This is the next step for anyone who wants to anticipate volatility, not just react to it.
What sets DEVMA apart:
Volatility-First Logic:Both fast and slow lines are moving averages of deviation, not price. You’re tracking the market’s “energy,” not just its direction. This is the quant edge that most scripts miss.
Regime-Colored Lines:
The fast and slow DEVMA lines change color in real time—green/aqua for expansion, maroon/orange for contraction—so you can see regime shifts at a glance.
Quant-Pro Visuals:
Subtle glow, clean cross markers, and a minimalist dashboard keep your focus on what matters: the regime, not the noise.
Static Regime Thresholds:
Reference lines at 1.5 and 0.5 (custom colors) give you instant context for “normal” vs. “extreme” volatility states.
No Price Chasing:
This isn’t about following price. It’s about anticipating the next volatility regime—before the crowd even knows what’s coming.
How this builds on DoD:
DoD showed you when volatility itself was about to change. DEVMA takes that insight and turns it into a crossover engine—so you can see, filter, and act on regime shifts in real time. If DoD was the radar, DEVMA is the navigation system.
Inputs/Signals—explained for clarity:
Deviation Lookback:
Controls the sensitivity of the regime detector. Shorter = more signals, longer = only the rarest events.
Fast/Slow DEVMA Lengths:
Fine-tune how quickly the regime lines react. Fast for scalping, slow for swing trading.
Source Selection:
Choose from price, volume, volatility, or VoVix. Each source gives you a different lens on market stress. VoVix is for those who want to see the “regime quake” before the aftershocks.
VoVix Parameters:
Fine-tune the volatility-of-volatility engine for your market. Lower ATR Fast = more responsive; higher ATR Slow = more selective.
Bottom line:
DEVMA is for those who want to see the market’s heartbeat, not just its shadow. Use it to filter your trades, time your entries, or simply understand the market’s true rhythm. Every input is there for a reason. Every plot is a direct readout of the quant logic. Use with discipline, and make it your own.
Disclaimer:
Trading is risky. This script is for research and informational purposes only, not financial advice. Backtest, paper trade, and know your risk before going live. Past performance is not a guarantee of future results.
*Updated the Dashboard/Metrics Display for better visibility
Use with discipline. Trade your edge.
— Dskyz, for DAFE Trading Systems

EMA Validation4 EMA with Support/Resistance Validation (EMA-V)
This indicator displays four Exponential Moving Averages (EMAs) with customizable periods (default: 21, 50, 100, 200) and visually validates their roles as support or resistance.
Each EMA changes color based on its behavior: green for respected support , red for respected resistance, or default colors when unvalidated.
Ideal for traders seeking to identify reliable support and resistance levels across multiple timeframes.
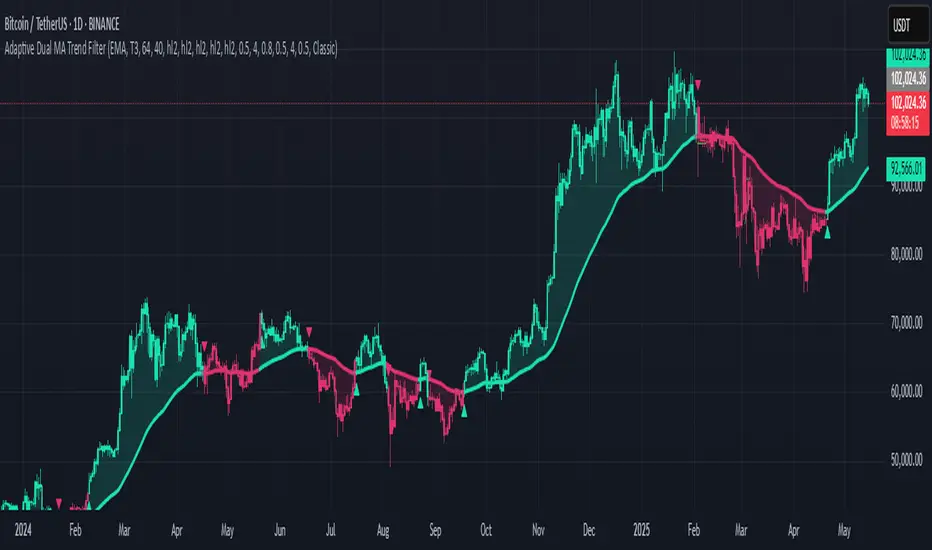
Adaptive Dual MA Trend FilterAdaptive Dual MA Trend Filter is a versatile Pine Script™ indicator that delivers clear, reliable trend signals using customizable moving averages:
Dual‑Stage Filtering – Apply any traditional MA (SMA, EMA, VWMA, HMA, RMA, TEMA, DEMA, FRAMA, TRIMA) or advanced smoothing (ALMA, T3) as your “main” and “filter” MAs. The filter MA is double‑smoothed for noise suppression, then converted into a robust “double‑filtered” baseline.
Flexible Inputs – Select lengths, sources (close, high, low, hl2), offsets, sigma, and volume factors to tailor the responsiveness and smoothness to your favorite timeframe or asset class.
Intuitive Signals – The script detects confirmed bullish (green) and bearish (red) trend shifts as:
Circle marker on the MA line
Triangle arrows below/above bars
Full candles and MA line colored by current trend
Clean Overlay – Works directly on your price chart, with optional semi‑transparent fills for extra visual clarity.
Theme Support – Choose from Vibrant, Pastel, Neon, Classic, Monochrome, Solarized, or Material palettes for seamless chart styling.
Ideal for swing traders and intraday scalpers alike, Multi‑Source Double‑Filter Trend offers both “set‑and‑forget” simplicity and deep customization for power users.
Usage
Add to chart → Inputs → tweak MA types/lengths
Watch for color changes and markers
Combine with volume or momentum filters for entry confirmation
Enjoy clearer trend identification and smoother trade signals!
Disclaimer
This script is for educational and informational purposes only. Not financial advice. Use at your own risk.
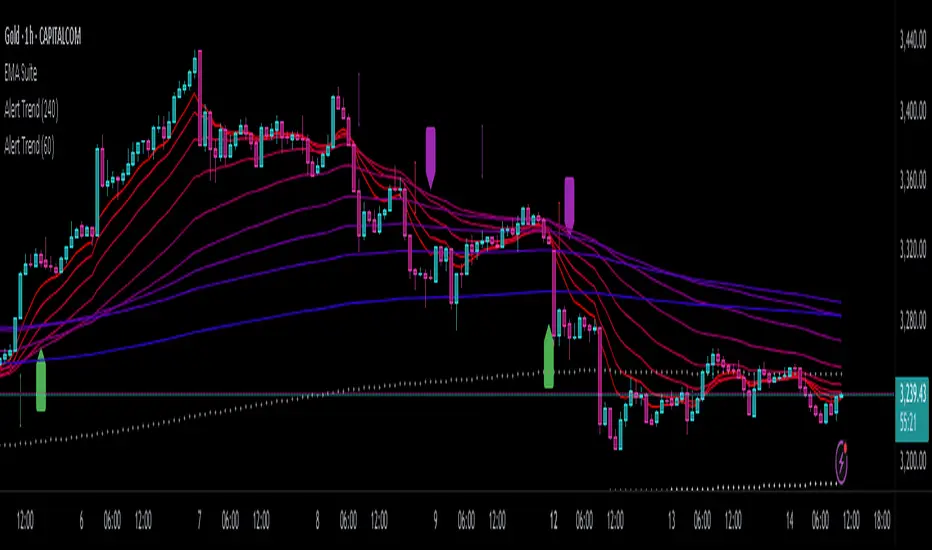
Alert TrendThis indicator is designed to function as a dynamic BIAS tool but can be adapted to various strategies depending on user needs.
Key Features and Integration:
Personally, I pair it with the "EMA Suite" indicator, as my strategy revolves around Fibonacci-based moving averages. The indicator uses EMA 55 and EMA 233 as trend references, triggering a trend shift when a candle closes fully above or below these levels. To maintain structural integrity, the EMA values are not user-configurable in the settings: adjustments require direct script modification (e.g., switching to EMA 50 and EMA 200, widely recognized reference levels), this ensures logical consistency for advanced users familiar with Pine Script.
Output Signals and Interpretation:
The indicator generates four distinct signals:
1. Uptrend: Candle closes above both EMA 55 and EMA 233.
2. Weak Uptrend: Candle closes above EMA 55 but below EMA 233.
3. Downtrend: Candle closes below both EMA 55 and EMA 233.
4. Weak Downtrend: Candle closes below EMA 55 but above EMA 233.
The area between the two EMAs represents a "complex zone" where price action contradicts higher timeframe trends. To resolve ambiguity, combine this indicator with a primary timeframe (e.g., H4) and a confirmation timeframe (e.g., H1). In smaller timeframes may also serve as entry signals, a feature currently under exploration for automation.
Alert System and Strategy Integration:
The indicator includes customizable alerts for all four signals collectively or individually, streamlining integration into Strategy scripts. This flexibility enhances adaptability for backtesting or live trading.
Critical Note:
Configure the indicator to display exclusively on the selected timeframe. Higher intervals fail to render all signals due to overlapping visualizations, distorting analysis. To resolve this, set the visibility parameter to "Visibility on intervals/Current interval and below" in the chart settings. This ensures clarity and preserves signal accuracy.
Development Status and Collaboration:
As part of an ongoing project, this tool is already integrated into my personal strategy. While functional and publicly shareable, further refinements are planned. Though not a professional developer, I utilize Deepseek for coding assistance and possess sufficient Pine Script literacy to oversee the logic. Feedback, suggestions, and collaborations are welcome to optimize its utility.
I hope this tool proves valuable to fellow traders navigating multi-timeframe analysis and trend confirmation.
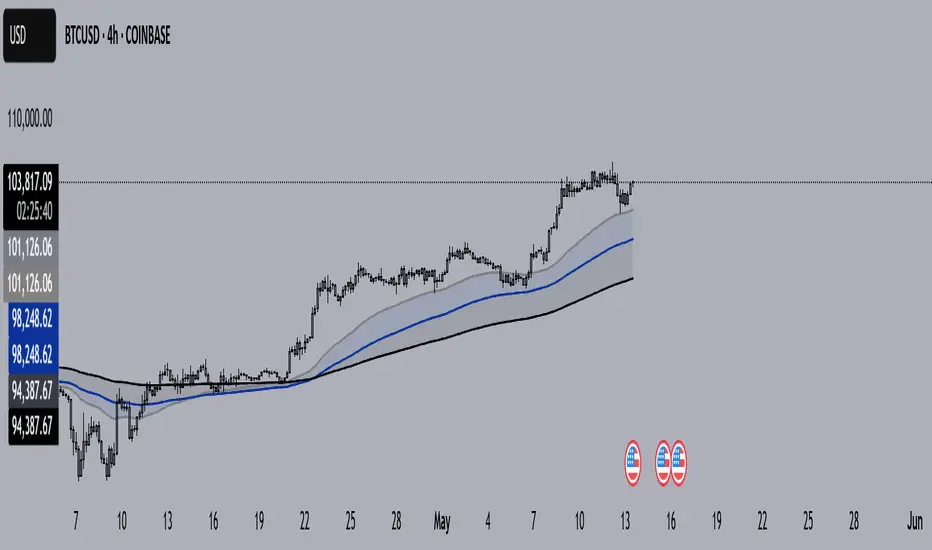
SR Nube 1.1The SR Nube 1.1 indicator offers a comprehensive perspective on price action through the strategic combination of three key elements: a dynamic cloud based on two Volume Weighted Moving Averages (VWMA), a consistent reference Exponential Moving Average (EMA) across all timeframes, and an intuitive information table.
The Dynamic Cloud: This cloud is calculated using two VWMA with lengths that automatically adjust based on the chart's timeframe. This dynamic adaptation allows for the identification of relevant support and resistance zones across different timeframes, providing contextual insight into potential price movement. The cloud visualizes areas of volume confluence, helping traders pinpoint zones where buying or selling pressure may be significant.
The Consistent Reference EMA: An EMA with a specific length (calculated to be representative of a higher timeframe, such as 1 hour, and displayed consistently across all timeframes) is overlaid on the chart. This EMA serves as a macro trend guide and a constant visual reference point, making it easier to identify the overall market direction regardless of the active trading timeframe. Its consistency across timeframes helps maintain perspective and align trades with the dominant trend.
The Information Table: Located in the top-left corner of the chart, a concise table summarizes the current price status relative to the cloud (on the 20-minute timeframe, as a reference for the main strategy) and the price's position concerning the reference EMA (based on the 1-hour timeframe). This table provides a quick, color-coded overview of trend alignment across multiple key timeframes, which can assist traders in making more informed decisions.
Utility and Underlying Concepts:
This indicator is designed for traders seeking a tool that combines volume analysis (through the VWMA in the cloud) with a higher timeframe trend reference (the consistent EMA). The dynamic cloud helps identify potential entry and exit zones within the trading timeframe, while the reference EMA provides a directional filter. The information table simplifies the evaluation of trend confluence across multiple timeframes, potentially increasing the probability of successful trades.
The underlying strategy is based on the idea of trading in the direction of volume and in alignment with a higher timeframe trend, using the cloud to identify value areas and the EMA as a key directional filter. The information table acts as a quick visual aid for assessing this alignment.
How to Use:
Add the "SR Nube 1.1" indicator to your TradingView chart.
Observe the dynamic cloud to identify potential support and resistance zones on your trading timeframe.
Use the blue EMA as a guide for the overall market trend.
Consult the information table in the top-left corner to see the price alignment with the 20-minute cloud and the 1-hour EMA. The colors will provide a quick indication of the potential direction.
Look for confluence between the cloud signals on your trading timeframe, the price's position relative to the EMA, and the information provided in the table to identify potential entry and exit opportunities.

EMA Break & Retest + Trend TableThis script is designed to identify potential buy and sell trading opportunities based on 21 EMA (Exponential Moving Average) break and retest patterns, with confirmation from multi-timeframe trend analysis. It combines actionable signal generation with a clean, real-time trend overview table.
✅ 1. EMA Break & Retest Logic
Detects when the price crosses above or below the 21 EMA and then closes in the direction of the breakout.
Generates buy signals on upward break/retest, and sell signals on downward break/retest.
✅ 2. Multi-Timeframe Confirmation
Filters signals using higher timeframe trends to avoid false entries.
Buy signals are shown only if the 1H or 4H trend is bullish.
Sell signals are shown only if the 1H or 4H trend is bearish.
✅ 3. Visual Signal Plotting
Displays green "BUY" labels below bars and red "SELL" labels above bars.
Users can toggle buy/sell signals on or off with checkboxes.
✅ 4. Alerts
Built-in alertcondition() functions allow traders to set real-time alerts when buy or sell signals are triggered.
✅ 5. Multi-Timeframe Trend Table
A dynamic table appears in the top-right corner showing trend status across:
Daily (D)
4 Hour (4H)
1 Hour (1H)
15 Minute (15M)
5 Minute (5M)
Each timeframe is marked as Bullish (green) or Bearish (red) depending on the current price vs. 21 EMA.
The latest signal (“BUY” / “SELL” / “—”) is displayed at the bottom of the table.
Triple EMA Bundle (50, 100, 200) - Osbrah CRG📈 Advanced EMA Indicator – 50/100/200
This custom-built indicator displays the 50, 100, and 200 Exponential Moving Averages (EMAs), giving traders a powerful visual tool to identify key trend directions, dynamic support/resistance levels, and potential market reversals.
Designed for both beginners and advanced users, this tool offers extensive customization options:
* Select which EMAs to display (50, 100, 200)
* Adjust colors, line styles, and thickness
* Choose between different price sources (close, open, hl2, etc.)
* Set custom EMA lengths to fit your strategy
Use Cases:
* Spot trend direction and strength at a glance
* Identify key zones of support and resistance
* Confirm entries/exits based on EMA crossovers or rejections
* Align your trades with higher timeframe trends
Whether you're a swing trader or a scalper, this indicator helps you stay in sync with the market by bringing clarity to long-term momentum zones.
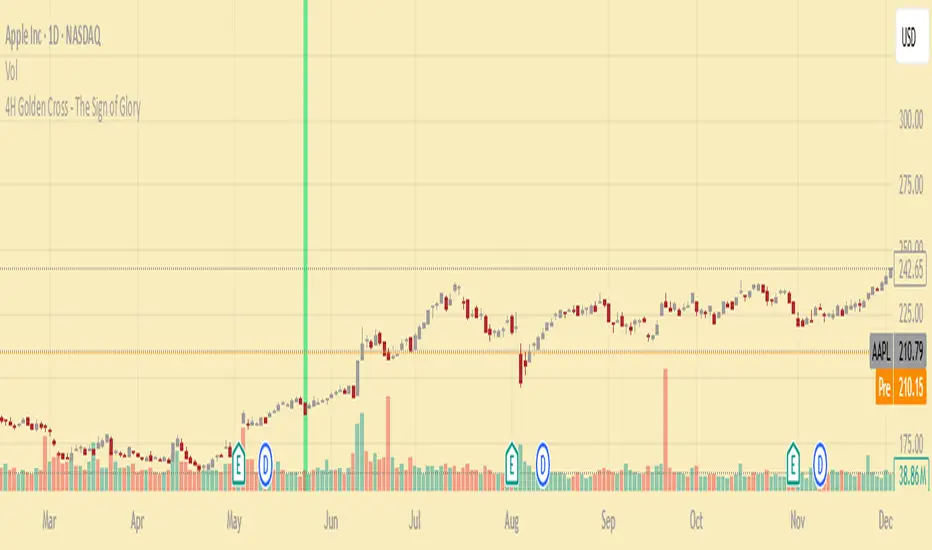
4H Golden Cross - The Sign of GloryCalculates the golden cross on the 4-hour timeframe
Displays the result on any timeframe
Draws a green vertical beam (a vertical line or background stripe) on the bar where the golden cross happened, so it’s clearly visible regardless of your chart timeframe
This is used to see the effectiveness of the 4h golden cross without having to change timeframes continually
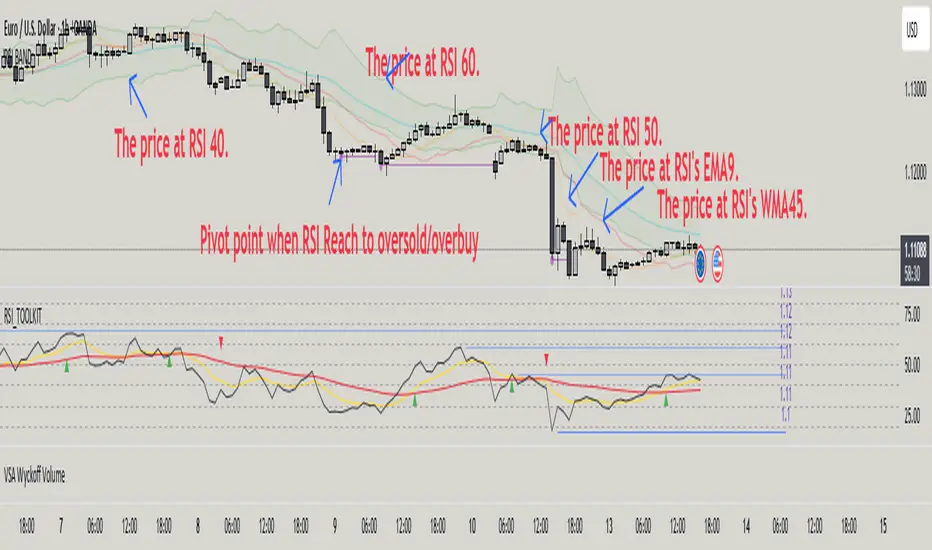
RSI BAND – RSI-Based Support & Resistance Levels📃 Description
RSI BAND is an original technical analysis tool that builds support and resistance levels based on the RSI (Relative Strength Index) indicator. This script is designed to enhance traders' understanding of RSI behavior and provide potential price zones where reversals or continuations may occur.
🔍 What it does
Calculates and visualizes horizontal levels on the price chart corresponding to RSI-based thresholds (e.g., RSI = 40, 50, 60).
Calculates and visualizes horizontal levels on the price chart corresponding to RSI's EMA9 & WMA45.
Detects pivot highs and lows in the RSI and marks corresponding price levels.
🎯 Key Features
🔺 RSI Resistance (e.g., RSI 60) and 🔻 RSI Support (e.g., RSI 40) levels calculated as price zones.
📉 Real-time calculation of price levels that correspond to RSI EMA (9) and RSI WMA (45).
🌀 Detects RSI Pivot Lows and Pivot Highs.
🎯 Includes alerts for Pivot points.
🧩 Fully configurable visibility and styling options for each plotted level.
🔬 How to read data
✅ How to Use
Use this indicator to:
See price action at key RSI levels (40, 50, 60) and RSI's EMA & WMA: For setting up reversal entries.
Identify RSI's pivot points at overbought or oversold levels: For setting up divergence entries.
📊 Visualizing RSI-Based Levels for Price Action
This script plots key RSI-based levels directly onto the chart, such as RSI support, resistance, and the 50-level, to help traders to easily see price action at key RSI zones.
The RSI Resistance and RSI Support levels (such as RSI = 60 and RSI = 40), RSI's EMA9 & WMA45 are plotted on the chart. These levels act as significant price action zones, where traders can anticipate potential reactions from the price based on the RSI's behavior.
By visualizing these levels as plots on the chart, traders can quickly see where price is in relation to these key RSI thresholds, allowing them to make more informed decisions when the price approaches these zones. For example, if the price is near the RSI resistance zone (RSI = 60), it might indicate a potential resistance area where the price could face selling pressure.
By utilizing these RSI-based plots, this script provides a clear, visual representation of key levels, enabling traders to make quicker and more confident decisions in relation to the price action and RSI dynamics.
🧠 Underlying Logic
The script uses standard RSI calculation (length = 14), combined with a reverse-engineered formula to calculate the required price change to reach a specific RSI value. This unique approach creates realistic price levels aligned with RSI expectations, unlike traditional static zones.
Function to calculate price from RSI level:
f_calc_target_price(targetRSI, close_price, avgGain, avgLoss, rsiLength) =>
targetRS = 100 / (100 - targetRSI) - 1
if targetRSI >= 50
requiredGain = targetRS * avgLoss - avgGain
requiredChange = requiredGain * rsiLength
close_price + requiredChange
else
requiredLoss = avgGain / targetRS - avgLoss
requiredChange = requiredLoss * rsiLength
close_price - requiredChange
Depending on whether the target RSI is above or below 50:
If RSI ≥ 50, the function estimates the additional gain needed to raise the RSI to the target, and adds the corresponding value to the current price.
If RSI < 50, it estimates the required loss and subtracts that value from the current price.
⚠️ Important Notes
Pivot Detection Offset: The script uses an offset of 3 bars to identify pivot points. This means that the pivot high and low points are calculated using the values from 3 bars before the current one. As a result, the pivot points may appear slightly delayed compared to the most recent price action.
No Lookahead Bias: The script does not rely on future data (lookahead bias). It strictly uses past price information for all calculations to maintain accuracy and avoid misleading results. The pivot points are plotted after the price has already formed, ensuring that the script does not predict future price movement but rather reacts to established patterns.
Pump Detector - EMA 4H + Retest H1 (Valid 10x4H bars)📈 Pump Detector – EMA 12/21 on 4H + Retest on H1
This indicator is designed to detect sudden bullish moves ("pumps") on the 4-hour timeframe, and alert traders of potential retest entry points on the 1-hour timeframe.
🔍 Pump activation conditions (on 4H):
EMA 12 crosses above EMA 21
Current volume exceeds the 20-period SMA of volume (on 4H)
When both conditions are met, a pump alert is triggered and a time window opens.
📉 Retest detection logic (on H1):
For the next 10 bars on the 4H chart (~40 hours), the indicator monitors price behavior on the 1H timeframe
If the LOW of any H1 candle touches or drops below EMA 12 or 21 (on H1), a second alert is triggered
✅ Key Features:
Draws EMA 12/21 from the 4H timeframe directly on the chart
Enforces 4H and H1 timeframes, regardless of the chart the script is applied to
One-time detection per pump window: once the 10-bar window expires, the retest alert is disabled until a new pump is detected
Ideal for capturing momentum breakouts followed by technical pullbacks
⚠️ Recommended for:
Traders looking for scalping or swing trading setups on crypto, forex, or stocks. Helps identify post-breakout entry opportunities using a structured and disciplined approach.

Ind JDV 2.2 PRO🛡️ Ind JDV 2.0 PRO – Chandelier Exit + FVG + EMA (Precise Entry)
Description:
Ind JDV 2.0 PRO is an advanced indicator that combines three powerful confirmations to find the best trading opportunities:
Chandelier Exit: Filters trade direction based on volatility breakouts controlled by ATR.
Fair Value Gap (FVG): Detects price inefficiency zones at their very first appearance.
EMA (Exponential Moving Average): Acts as a trend filter to ensure trading with the dominant market flow.
🔍 Key Features:
Marks only one precise signal on the candle where the FVG starts.
Confirms the trend using a 150-period EMA (fully adjustable).
Optionally draws Take Profit and Stop Loss target lines for clear visual guidance.
Background color changes (green or red) to reflect the active market trend.
Built-in automatic alerts for buy or sell opportunities.
Optimized code for maximum speed across all timeframes.
✅ Perfect for trading indices, forex, cryptocurrencies, and stocks.
✅ Compatible with all timeframes (5m, 15m, 1H, 4H, Daily).
✅ Fully customizable to fit scalping, intraday, or swing trading styles.
⚙️ Default Parameters:
ATR Period: 10
ATR Multiplier: 3.0
EMA Period: 150
FVG Lookback: 3 candles
Take Profit: 100 points
Stop Loss: 50 points
(All values are adjustable in settings.)
📈 How it works:
The indicator analyzes price structure.
Detects a valid Fair Value Gap (FVG) formation.
Confirms the breakout with a Chandelier Exit signal.
Verifies price alignment with the EMA trend.
Triggers a single entry signal (BUY or SELL) exactly on the first candle that meets all conditions.
🚀 Optimize your trading by focusing on high-probability zones, supported by solid confirmations and clean visual signals.
Add Ind JDV 2.0 PRO to your trading arsenal and take your strategy to the next level! 🔥

Order Block with BoSHere’s a professional and concise description you can use for publishing your **TradingView script** titled **"Order Block with BoS"**:
---
### 📌 **Description for TradingView Publication:**
**"Order Block with Break of Structure (BoS)"** is a powerful price action-based indicator designed to identify potential reversal zones and momentum shifts using **Order Block** detection combined with **Break of Structure (BoS)** confirmation.
### 🔍 **Key Features:**
* **Order Block Detection**: Highlights bullish and bearish order blocks using precise candle structure logic.
* **Break of Structure (BoS)**: Confirms structural breaks above swing highs or below swing lows to validate potential trend continuation or reversal.
* **Dynamic ATR Filter**: Uses a 14-period ATR with dynamic thresholds to confirm significant moves, filtering out weak breakouts.
* **Visual Aids**:
* Color-coded **boxes** to mark detected Order Blocks.
* **Arrows** at BoS confirmation points when ATR confirms strong momentum.
* Optional **dashed BoS lines** to show where price broke structure.
### ⚙️ **Customizable Inputs**:
* `Swing Length`: Defines the sensitivity of swing high/low detection.
* `Show Break of Structure`: Toggle on/off BoS confirmation lines.
* `Candle Lookback`: Number of historical candles to consider.
This indicator is ideal for traders who incorporate **smart money concepts**, **market structure analysis**, or **institutional order flow** strategies.
---
Would you like me to help write the **strategy** version of this or translate the description into another language for international audiences?

Volume MAs Supertrend | Lyro RS📊 Volume MAs Supertrend | Lyro RS is an advanced trading tool that combines volume-adjusted moving averages with a dynamic Supertrend system. This indicator provides a robust framework for identifying market trends and entry/exit points.
✨ Key Features :
📈 Volume-Weighted Moving Averages (VWMA): Integrates price and volume data to provide a more accurate moving average, allowing for better trend analysis.
🔧 Multiple MA Types: Choose from SMA, EMA, WMA, VWMA, DEMA, TEMA, RMA, HMA, ALMA to suit your preferred trading strategy.
📊 Dual-Multiplier Supertrend System: Uses ATR to dynamically calculate upper and lower bands for long and short trends, with distinct multipliers for each.
🎨 Customizable Color Schemes: Choose from Classic, Mystic, Accented, and Royal color palettes or customize your own colors for bullish and bearish trends.
🔍 Visual Enhancements: Color-coded Supertrend lines, candlesticks, and bars for quick trend identification.
⏰ Alert System: Alerts for long and short signals based on trend changes.
🔧 How It Works :
The Supertrend line is calculated using ATR over a user-defined period, with separate multipliers for long and short positions.
📈 A bullish trend is signaled when the price crosses above the upper band, and a bearish trend is signaled when the price crosses below the lower band.
🎨 The Supertrend line changes color to reflect trend direction, with candlesticks and bars matching the trend's color for visual clarity.
⚙️ Customization Options :
🛠️ Moving Average Settings: Select your preferred moving average type (SMA, EMA, VWMA, etc.) and adjust the length for smoother or more responsive trend signals.
📐 Supertrend Parameters: Define the ATR period and adjust multipliers to fine-tune sensitivity for long and short signals.
🎨 Color Configuration: Choose from predefined color palettes or create your own custom scheme for trend signals.
📈 Use Cases :
✅ Confirm market trends before entering trades.
🚪 Identify potential entry/exit points as trend directions shift.
👀 Visually analyze market conditions with color-coded candlesticks and bars.
⚠️ Disclaimer :
This indicator should not be used as a standalone tool for making trading decisions. Always combine with other forms of analysis and risk management practices.

VWAP Predictive Breakout + RSI + OB + Trend/Chop📈 VWAP Predictive Breakout + RSI + Order Blocks + Trend/Chop Filter
This multi-layered day trading and scalping tool is designed to predict price direction after a VWAP breakout, rather than react to it. It combines volume, RSI, candlestick structure, order blocks, and trend/chop analysis to improve the accuracy of intraday signals.
🔍 Core Features
VWAP Predictive Breakout
Signals are generated when price breaks above/below VWAP with strength (volume spike + strong candle body), supported by trend confirmation.
RSI Momentum Filter
Uses RSI divergence behavior to validate breakouts, filtering out weak or exhausted moves.
Order Block Detection
Marks bullish and bearish engulfing patterns and checks for proximity to these zones as confirmation for breakouts.
Trend vs Chop Detection
Uses ADX, ATR, EMA distance, Bollinger Band width, and candlestick cleanliness to dynamically identify whether the market is trending or choppy.
Clean Candle Behavior
Filters out noisy or indecisive candles by analyzing wick-to-body ratio and ATR-based body size.
📌 Visual Markers
🟢 Buy Signal: Green triangle below bar
🔴 Sell Signal: Red triangle above bar
🟢⚪ Bullish Order Block: Green circle
🔴⚪ Bearish Order Block: Red circle
🟩 Trending Background: Light green
🟥 Choppy Background: Light red
🛎 Alerts Included
Long signal: VWAP breakout + RSI + Order Block + Clean Candle
Short signal: VWAP breakdown + RSI + Order Block + Clean Candle
🧠 Best Use Cases
Scalping high-probability VWAP reversals or continuations
Day trading in markets where trend clarity is critical
Filtering noise in sideways conditions using real-time chop detection

Heikinisi Candle (With MA + Smoothing + Buy/Sell with Cooldown)This custom Heikinisi Candle (With MA + Smoothing + Buy/Sell with Cooldown) indicator combines the advantages of Heikin-Ashi candles with the flexibility of multiple moving averages and smoothing options. The built-in buy/sell signals with cooldown functionality help traders avoid overtrading while capturing trend reversals and momentum shifts. Whether you're a day trader, swing trader, or long-term investor, this indicator offers powerful tools for analyzing price action and making informed trading decisions.
Note: Disable the regular candle to get better visualization.
Key Features:
Custom Heikin-Ashi Candles:
The core feature of this script is the Heikin-Ashi candles, which are known for smoothing price action and helping traders identify market trends more clearly.
Unlike traditional Heikin-Ashi, this version adjusts the Heikin-Ashi close based on specific price action patterns, including rejection signals and engulfing patterns.
The custom Heikin-Ashi open also incorporates momentum, adjusting dynamically based on recent price changes.
Price Action Measurements:
The indicator measures key price action components, including:
Body: The absolute difference between the open and close.
Candle Range: The total range from high to low.
Upper Wick: The distance from the highest price to the maximum of open or close.
Lower Wick: The distance from the lowest price to the minimum of open or close.
These measurements help detect bullish and bearish conditions, as well as price rejection signals.
Buy/Sell Signal Logic:
Buy Signal: Triggered when the Heikin-Ashi close is above the chosen moving average (MA1), with a cooldown period to avoid too frequent signals.
Sell Signal: Triggered when the Heikin-Ashi close falls below the MA1 after a buy signal has already been issued.
The cooldown period ensures that buy and sell signals are spaced apart by a specific number of bars, preventing excessive signal generation during periods of price consolidation.
Multiple Moving Averages (MA):
This script supports up to three customizable moving averages (MA1, MA2, MA3), each of which can be set to different types and lengths, including:
Simple Moving Average (SMA)
Exponential Moving Average (EMA)
Weighted Moving Average (WMA)
Volume Weighted Moving Average (VWMA)
Volume Weighted Moving Price (VWMP)
Least Squares Moving Average (LSMA)
Hull Moving Average (HMA)
Double Exponential Moving Average (DEMA)
Triple Exponential Moving Average (TEMA)
Users can adjust the length and type of each MA for tailored analysis.
Smoothing Options for MAs:
Users can smooth the output of MAs using various types of smoothing algorithms (SMA, EMA, LSMA, WMA, Gaussian) and a customizable length. This helps to reduce noise in the moving average lines and provides clearer signals.
Gaussian Filter (Advanced Smoothing):
A Gaussian Filter is available as a smoothing option for MAs. This filter reduces noise and makes the moving averages smoother, which can be particularly helpful in volatile or choppy markets.
Alerts and Visualization:
The script allows users to plot buy and sell signals on the chart with distinctive markers. A Buy Signal is shown below the bar with a lime green marker and text "Buy," while a Sell Signal is shown above the bar with a red marker and text "Sell."
Traders can also set up alerts based on the buy/sell signals to get notified in real time.
Indicator Configuration:
Heikin-Ashi Candle Configuration:
Automatically adjusts Heikin-Ashi candles based on rejection signals, engulfing patterns, and momentum. It uses custom formulas for the Heikin-Ashi open and close, making it more sensitive to price action than standard Heikin-Ashi candles.
Moving Averages (MA) Configuration:
You can select from multiple moving average types and lengths (MA1, MA2, MA3) for trend-following analysis.
Choose between SMA, EMA, WMA, VWMA, VWMP, LSMA, HMA, DEMA, and TEMA.
Smoothing Options:
Enable or disable smoothing for the moving averages.
Select from different smoothing types, including SMA, EMA, RMA, WMA, LSMA, and Gaussian.
Cooldown Period:
Control the number of bars that must pass before a new buy/sell signal is triggered. This cooldown period helps prevent excessive trading signals in quick succession.
How to Use:
Analyze Price Action with Heikin-Ashi Candles:
The custom Heikin-Ashi candles are ideal for spotting market trends, reversals, and price rejection. Use the candle patterns to gauge the market sentiment.
Use MAs for Trend Confirmation:
The moving averages (MA1, MA2, MA3) can help identify the prevailing trend. A price above a rising MA indicates an uptrend, while a price below a falling MA suggests a downtrend.
Trigger Buy and Sell Signals:
When the Heikin-Ashi close crosses above MA1, a buy signal is triggered.
When the Heikin-Ashi close crosses below MA1 after a buy signal, a sell signal is triggered.
The cooldown period ensures that signals are spaced out, preventing overtrading.
Use Smoothing for Clearer Signals:
If you are trading in a volatile market, you can use the smoothing options to make the MAs smoother and reduce noise.
