MTF VEGASThe MTF Tunnel Vegas indicator is a multi-timeframe (MTF) technical analysis tool designed to help traders identify trends and key price zones. It is based on the Vegas Tunnel system, which uses three key exponential moving averages (EMAs) — the 144, 169, and 233-period EMAs — to create a dynamic tunnel or channel on the price chart.
The purpose of this tunnel is to highlight zones where price may react, either as support/resistance or as breakout levels. When price approaches, bounces off, or crosses the tunnel, it can signal potential trading opportunities, whether for continuation or reversal setups.
The MTF component means that the indicator overlays the tunnel from a higher timeframe directly onto the current chart, giving traders a clear view of the larger trend context without needing to switch between multiple charts. This allows for better alignment of short-term decisions with long-term trend dynamics.
Key features:
✅ Plots 144, 169, and 233-period EMA tunnels from higher timeframes
✅ Highlights dynamic zones of support and resistance
✅ Helps traders stay aligned with the dominant trend
✅ Reduces chart noise and improves trade filtering
Moving Averages

6 Dynamic EMAs by Koenigsegg🚀 6 Dynamic EMAs by Koenigsegg
Take control of your chart with ultimate flexibility. This tool gives you 6 customizable EMAs across any timeframe, helping you read the market like a pro — whether you're scalping seconds or swinging days. Built for precision, designed for dominance.
The combinations? Endless. Mix and match any EMA lengths and timeframes for tailored confluence — exactly how elite traders operate.
🔑 Key Features
✅ 6 Fully Customizable EMAs
⏳ Multi-Timeframe Support (from seconds to months)
🎨 Custom Colors & Thickness for each EMA
🚨 Built-in Cross Alerts for instant trade signals
🧠 Clean, efficient logic using request.security()
🔁 Dynamically toggle EMAs on/off
⚙️ Lightweight for smooth chart performance
🧩 Endless combo potential — confluence on your terms
📈 What Is an EMA?
The EMA is a type of moving average that adjusts more quickly to recent price changes than a Simple Moving Average (SMA). It does this by giving exponentially more weight to the most recent candles.
⚙️ How Does It Function?
Smoothing Price Data:
It takes the average of closing prices over a chosen period (like 20 or 50 candles), but gives more influence to the latest prices.
Reacts Quickly to Price Shifts:
Since recent data is weighted more heavily, the EMA adjusts faster to sudden price changes — helping you spot trend reversals or momentum shifts earlier.
Dynamic Support & Resistance:
Traders often use EMAs as moving support/resistance levels. Price often "respects" EMAs in trending markets — bouncing off them during pullbacks.
Trend Confirmation:
- If price is above the EMA, the market is likely in an uptrend.
- If price is below the EMA, the market is likely in a downtrend.
- Multiple EMAs (like 12/21 or 50/200) crossing each other are used for entry/exit signals.
💡 Example:
If you use a 21 EMA on a chart, it shows you the average price of the last 21 candles, but the most recent ones weigh heavier. This makes the EMA more responsive than an SMA, and better for short-term or active trading.
📊 Why EMAs Matter — and How Multi-Timeframe EMAs Give You the Edge
Exponential Moving Averages (EMAs) are essential tools for identifying trend direction, momentum shifts, and dynamic support/resistance. Because they weight recent price data more heavily, EMAs adapt quickly to changing market conditions, giving traders early insight into reversals or continuations.
Where this script shines is in its multi-timeframe (MTF) capability. For example, plotting a daily EMA on a 4H chart gives you high-level directional guidance while still allowing precision entries. This enables confluence between LTF (low timeframe) signals and HTF (high timeframe) momentum — a crucial edge used by institutional-level traders.
You can configure the tool to run classic combos like the 12/21 crossover on your current chart, while layering in a 50 or 200 EMA from a higher timeframe for macro confirmation. The 6th EMA, colored light blue by default, is perfect for adding one final level of structure insight — often used as a long-term anchor or trend bias marker.
Whether you're riding the wave or catching the reversal, these EMAs serve as your adaptable compass in every environment.
🎯 Purpose
This indicator was built to give traders a clear, responsive, and multi-timeframe edge using dynamic Exponential Moving Averages. Whether you're trend-following, identifying momentum shifts, or building a confluence system — these 6 EMAs are here to align with your strategy and style.
💡 Pro Tip
Instead of cluttering your chart with multiple EMA indicators, this script consolidates all into one sleek tool. You can toggle off bands you don't currently need, like running only the 12/21 EMAs on your active chart timeframe, while adding the 12/21 EMAs from a higher timeframe to guide trade decisions.
With this setup, you're not just reacting — you're orchestrating your trades with intention.
⚠️ Disclaimer
This script is for educational and informational purposes only. It does not constitute financial advice. Always do your own research and trade responsibly. Past performance does not guarantee future results.

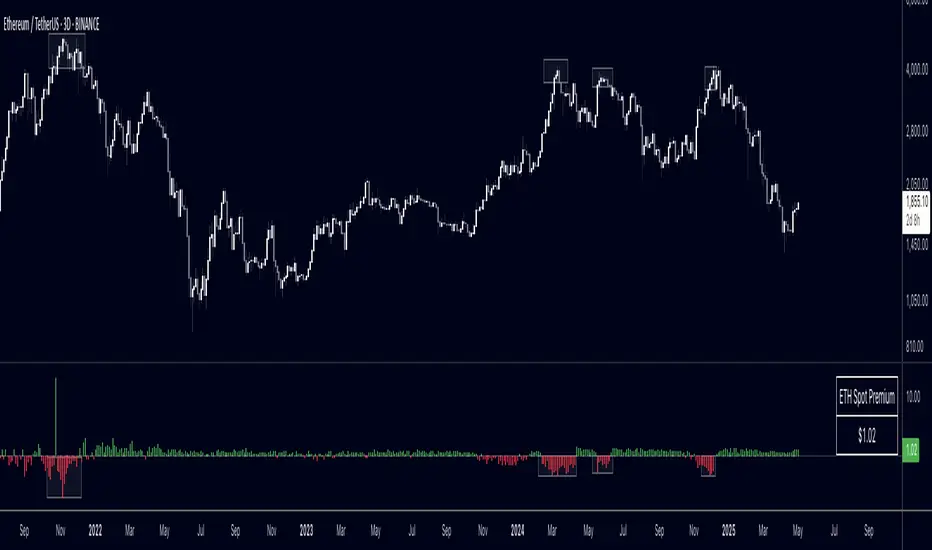
Spot Vs Perp PremiumThis indicator visualizes the price premium or discount between spot and perpetual futures markets for any crypto asset, using data from Binance, OKX, and Bybit. It helps traders track sentiment shifts, uncover arbitrage signals, and identify potential short-term reversals or continuation moves based on how aggressively traders are positioned in derivatives relative to the spot market.
What It Does
- Calculates the premium:
The difference between spot price and perp price is shown as a histogram. A positive premium (spot > perp) suggests cautious or bearish perp traders, while a negative premium (perp > spot) may indicate aggressive long positioning or speculative activity.
Supports multiple venues:
You can toggle between Binance, OKX, Bybit, or view a 3-exchange average for a more smoothed view.
Automatic pair detection:
The script auto-detects the base and quote currency from your active chart, dynamically tracking the correct spot and perp contracts for the asset you're analyzing.
Invert option:
Flip the calculation to view the perp premium instead of the spot premium, useful for comparing directional funding bias or for personal preference in visual analysis.
Optional moving average:
Smooth the premium signal over time to track sustained shifts in sentiment and filter out noise.
Table display:
Displays the real-time premium value in the corner of the chart for clarity.
Why It's Useful
This tool gives insight into derivatives trader behavior vs real market pricing. Spot prices reflect actual buying/selling of assets, while perpetual futures are often driven by speculation, leverage, and short-term positioning. When these diverge significantly, it often precedes market inflection points:
- Perp trading above spot (negative premium): excessive long exposure, potential for mean reversion or liquidations.
- Perp trading below spot (positive premium): risk-off behavior or hedging, potential for squeeze or unwind.
You can use this indicator to:
- Anticipate liquidation-driven moves
- Spot early signs of trend exhaustion
- Confirm breakout strength with perp alignment
- Monitor crowd positioning in real-time
Inputs
- Exchange – Select from Binance, OKX, Bybit, or average all three
- Inverse Premium – Flip the calculation to see perp - spot instead
- Show MA – Overlay a moving average for premium smoothing
- Show Table – Toggle live premium table display
- MA Period – Customize the smoothing window
Enjoy! Please comment and like!
Multi-Symbol Trend DashboardMulti-Symbol Trend Dashboard - MA Cross Trend Monitor
Short Description
A customizable dashboard that displays trend direction across multiple symbols and timeframes using moving average crossovers.
Full Description
Overview
This Multi-Symbol Trend Dashboard allows you to monitor trend direction across 7 different symbols and 5 timeframes simultaneously in a single view. The dashboard uses moving average crossovers to determine trend direction, displaying bullish trends in green and bearish trends in red.
Key Features
Multi-Symbol Monitoring : Track up to 7 different trading instruments at once
Multi-Timeframe Analysis: View 5 different timeframes simultaneously for each instrument
Customizable Moving Averages: Choose between SMA, EMA, or WMA with adjustable periods
Visual Clarity: Color-coded cells provide immediate trend identification
Flexible Positioning: Place the dashboard anywhere on your chart
Customizable Appearance: Adjust sizes, colors, and text formatting
How It Works
The dashboard calculates a fast MA and slow MA for each symbol-timeframe combination. When the fast MA is above the slow MA, the cell shows green (bullish). When the fast MA is below the slow MA, the cell shows red (bearish).
Use Cases
Get a bird's-eye view of market trends across multiple instruments
Identify potential trading opportunities where multiple timeframes align
Monitor your watchlist without switching between charts
Spot divergences between related instruments
Track market breadth across sectors or related instruments
Notes and Limitations
Limited to 7 symbols and 5 timeframes due to TradingView's security request limits
Uses simple MA crossover as trend determination method
Dashboard is most effective when displayed on a dedicated chart
Performance may vary on lower-end devices due to multiple security requests
Settings Explanation
MA Settings: Configure the periods and types of moving averages
Display Settings: Adjust dashboard positioning and visual elements
Trading Instruments: Select which symbols to monitor (defaults to major forex pairs)
Timeframes: Choose which timeframes to display (default: M15, H1, H4, D1, W1)
Colors: Customize the color scheme for bullish/bearish indications and headers
This dashboard provides a straightforward way to maintain situational awareness across multiple markets and timeframes, helping traders identify potential setups and market conditions at a glance.

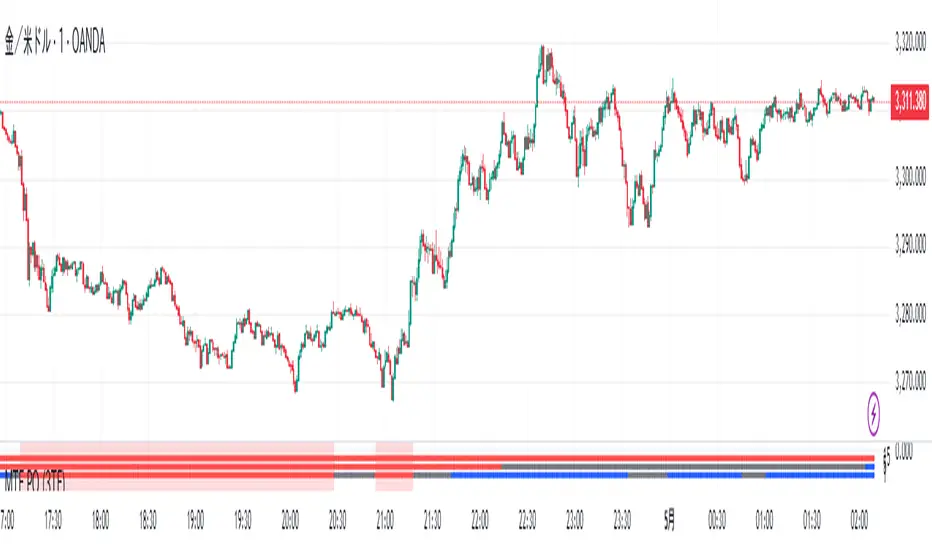
MTF PO (3TF)Title: SmartMA Multi-Timeframe Signal Strategy
Description (English):
This indicator provides buy/sell signals based on a multi-timeframe adaptive moving average. It allows traders to align short-term entries with higher time-frame trends. The script integrates a trend-following logic that reacts to price crossovers and adaptive MA slope, helping traders reduce noise and improve entry precision.
概要(日本語)
このインジケーターは、複数時間足の適応型移動平均線(SmartMA)を用いて売買シグナルを生成します。下位足でのエントリーが、上位足のトレンドと一致するよう設計されており、ノイズの除去とトレード精度の向上に貢献します。価格のクロスとMAの傾きを用いたトレンドフォロー型ロジックを搭載しています。
特徴
上位時間足の移動平均(SmartMA)と価格のクロスを検出
傾きフィルターによるトレンド整合性チェック
上位足に合わせて下位足のシグナルを制限
チャート上にシンプルなBuy/Sellラベルを表示
EMA, SMA, RMAなどのカスタム選択が可能
使用方法
チャートにインジケーターを追加し、上位足(例:1時間)と現在の時間足(例:5分)を設定
トレンド方向に沿ったタイミングでエントリーを検討
複数フィルターを用いることで、レンジ相場での誤認識を回避可能
注意事項
本インジケーターは補助的な分析ツールです。過去のパフォーマンスが将来を保証するものではありません。
スクリプトは再描画しない設計ですが、時間足の切り替え等で見た目が変わる可能性があります。
戦略構築には他のリスク管理指標との併用を推奨します。
Multi-Timeframe EMAs with Cross Alerts (Up & Down)📌 Indicator Name:
Multi-Timeframe EMAs with Cross Alerts (Up & Down)
🛠️ Core Features:
✅ 1. Multi-Timeframe EMA Display
The script calculates and displays 6 different Exponential Moving Averages (EMAs).
Each EMA has:
Custom length input (e.g., 9, 21, etc.).
Custom timeframe selection (e.g., 1H, 4H, 1D).
Custom color for easy identification on the chart.
✅ 2. EMA Visualization
Each of the six EMAs is plotted on the chart using the selected color and thickness.
They respond dynamically to different timeframes (current or higher/lower).
✅ 3. Cross Detection Logic
The script can detect crossover and crossunder between EMA pairs:
EMA 1 and EMA 2
EMA 3 and EMA 4
EMA 5 and EMA 6
(Optional: can be extended to other combinations.)
✅ 4. Alert Toggles
Users can enable or disable alerts for each pair independently:
Alert: EMA 1 crosses EMA 2
Alert: EMA 3 crosses EMA 4
Alert: EMA 5 crosses EMA 6
(You added an additional option for EMA 4 vs EMA 6 later.)
✅ 5. Visual Alert Markers
The script uses alert() function to send alert messages when:
An EMA crosses above another (crossover)
An EMA crosses below another (crossunder)
Alerts include clear icons like 🔼 and 🔽 in the messages.
🔔 Use Case Scenarios
Swing traders: Identify longer-term cross signals on higher timeframes.
Scalpers: Use lower-timeframe EMAs with fast alert reactions.
Multi-timeframe analysis: Spot alignment between trend-following EMAs across different periods.
✅ Bonus
Fully customizable — great for adapting to your own strategy, whether it's trend confirmation, re-entry signals, or early reversals
📌 اسم المؤشر:
المتوسطات المتحركة الأسية (EMA) متعددة الفريمات مع تنبيهات تقاطع صاعدة وهابطة
🛠️ الميزات الأساسية:
✅ 1. دعم متعدد للفريمات الزمنية
يقوم السكربت بحساب وعرض 6 متوسطات متحركة أسية (EMA) مختلفة.
يمكن تخصيص كل EMA من حيث:
الطول (مثل: 9، 21...).
الفريم الزمني (مثل: الساعة، الأربع ساعات، اليومي...).
اللون، لتسهيل التمييز بين الخطوط على الشارت.
✅ 2. عرض المتوسطات على الرسم البياني
يتم رسم كل من المتوسطات الستة باستخدام اللون والتنسيق الذي تختاره.
المتوسطات تتفاعل تلقائيًا مع التغييرات في الفريم الزمني.
✅ 3. كشف التقاطعات
يمكن للسكربت كشف تقاطعات (صعودًا أو هبوطًا) بين أزواج المتوسطات التالية:
EMA 1 و EMA 2
EMA 3 و EMA 4
EMA 5 و EMA 6
(ويمكنك إضافة المزيد مثل EMA 4 مع EMA 6 حسب الحاجة)
✅ 4. التحكم في التنبيهات
يمكن للمستخدم تفعيل أو تعطيل التنبيهات لكل زوج من المتوسطات على حدة:
تنبيه عند تقاطع EMA 1 و EMA 2
تنبيه عند تقاطع EMA 3 و EMA 4
تنبيه عند تقاطع EMA 5 و EMA 6
(وأي أزواج إضافية يتم إضافتها لاحقًا)
✅ 5. تنبيهات مرئية برسائل واضحة
السكربت يرسل تنبيهات عبر وظيفة alert() عند حدوث:
تقاطع صاعد (EMA يتقاطع من الأسفل إلى الأعلى).
تقاطع هابط (EMA يتقاطع من الأعلى إلى الأسفل).
التنبيه يحتوي على رموز توضيحية مثل 🔼 و 🔽 ليسهل قراءته.
🎯 مناسب لـ:
المتداولين المتأرجحين (Swing Traders): لاكتشاف تقاطعات على الفريمات الكبرى.
المضاربين (Scalpers): باستخدام EMA سريعة على فريمات صغيرة مع تنبيهات فورية.
محللي الفريمات المتعددة: لتأكيد الاتجاه أو الانعكاس بناءً على تقاطع متوسطات من فريمات مختلفة.
✅ مزايا إضافية:
قابل للتخصيص بشكل كامل حسب استراتيجيتك.
مناسب لعدة أساليب: تأكيد الترند، إعادة الدخول، أو إشارات الانعكاس المبكر.

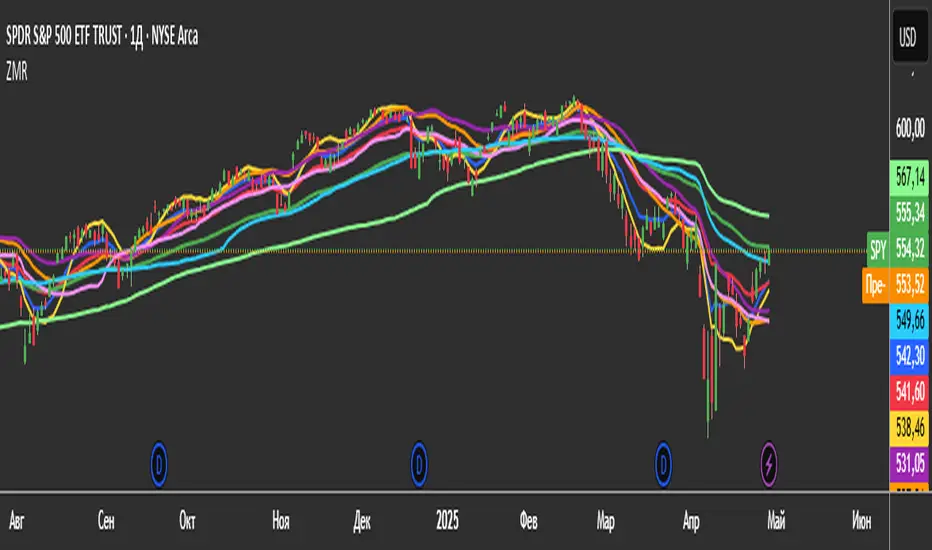
3 Zero Lag + 3 Moving Averages + 3 RVWAPThe "3 Zero Lag + 3 Moving Averages + 3 RVWAP" (ZMR) indicator combines three groups of tools for technical analysis.
1. Three Customizable Moving Averages (MAs):
Configuration for Each MA:
Choice of 7 types (SMA, EMA, WMA, HMA, VWMA, LSMA, SMMA).
Independent periods and price sources for each line.
Visualization:
MA1 (Blue), MA2 (Red), MA3 (Green).
2. Three Zero Lag EMAs (ZLEMA) with Individual Settings:
Lag Reduction: Corrects traditional EMA lag using:
Adjusted Price = 2 * Current Price - Price .
Flexibility:
Unique lengths (20, 50, 70) and individual price sources for each ZLEMA (HLC3, HL2, Close, etc.).
Colors:
ZLEMA1 (Yellow), ZLEMA2 (Orange), ZLEMA3 (Purple).
3. Three Rolling VWAPs with Custom Parameters:
Volume-Weighted Average Price (VWAP):
Calculated for three periods (20, 50, 100) with dedicated price sources for each VWAP.
Colors:
VWAP1 (Pink), VWAP2 (Light Blue), VWAP3 (Neon Green).
Price Change Sentiment Index [tradeviZion]Price Change Sentiment Index
A technical indicator that measures price changes relative to the day's range.
Indicator Overview
Normalizes price changes on a 0-100 scale
Uses a smoothing period for signal clarity
Shows potential overbought/oversold conditions
Inputs
Smoothing Period (default: 3)
Show Background Colors (on/off)
Overbought Level (default: 75)
Oversold Level (default: 25)
Reading the Indicator
Values above 75: Price change showing strong upward movement
Values below 25: Price change showing strong downward movement
Around 50: Neutral price movement
Technical Details
// Core calculation
changePct = (currClose - prevClose) / (high - low)
normalized = 50 + (changePct * 50)
smoothedNormalized = ta.sma(normalizedClamped, smoothingPeriod)
Usage Notes
Best used with other technical analysis tools
Adjustable smoothing period affects signal sensitivity
Background colors highlight extreme readings
Works on any timeframe
Settings Guide
Smoothing Period:
- Lower values (1-3): More responsive
- Higher values (5-10): Smoother output
Visual Settings: Toggle background colors
Levels: Adjust overbought/oversold thresholds
This indicator is a technical analysis tool. Please conduct your own research and testing before use.

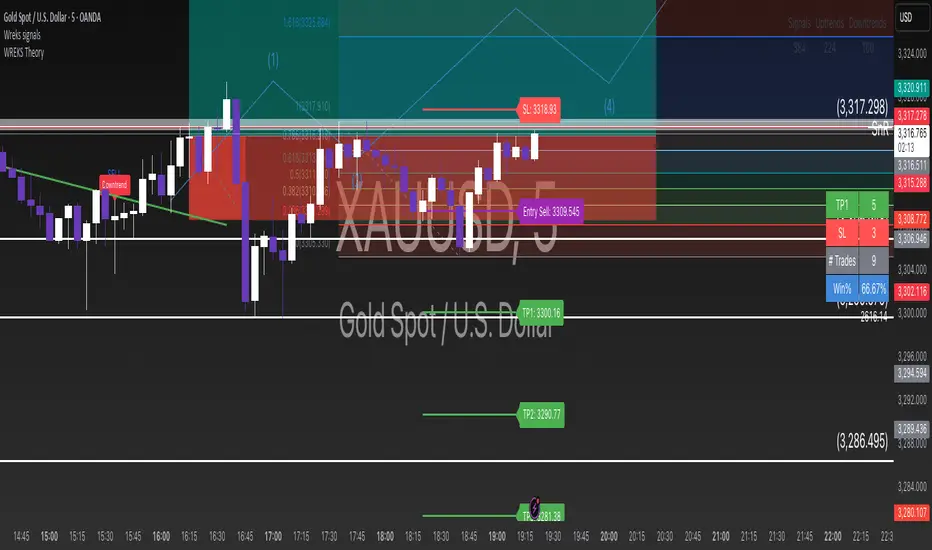
WREKS Theory📊 WREKS Theory – Advanced Market Structure & Auto-Fibonacci Indicator
By WREKS Trading Community
📊 WREKS Theory – Advanced Market Structure & Auto-Fibonacci Indicator
By WREKS Trading Community
✅ Overview
The WREKS Theory indicator is a robust, all-in-one technical analysis tool designed to identify trend direction, generate buy/sell signals, and project key Fibonacci levels for precision trading. It merges the logic of Dow Theory (Higher Highs & Higher Lows), SMA filtering, and automated Fibonacci clusters based on ZigZag pivots to highlight optimal price zones for entry, reversal, and take-profit.
🧠 Built-in Logic
Dow Theory Engine: Detects confirmed uptrends and downtrends based on recent pivot highs and lows.
SMA-144 Filter: Confirms signal strength by filtering trades aligned with the dominant trend.
ZigZag-based Auto-Fibonacci: Dynamically maps Fibonacci retracement and extension levels from the most recent swing, with color-coded visual lines and labels.
Signal Dashboard: Displays trend change counts (Uptrends / Downtrends) and real-time status in a clean table on the chart.
Smart Alerts: Triggers when buy/sell signals occur or when price crosses Fibonacci levels.
📌 Key Features
🔺 Buy / Sell Markers: Auto-labeled on the chart using real-time trend shift confirmation.
📈 Fibonacci Cluster Map: Automatically draws up to 22 customizable Fib levels including negative retracements and advanced extensions (0.236 to 4.618+).
🎯 Trend Labels: Clearly marks “Uptrend” and “Downtrend” zones.
💡 Visual Table: Quick reference for signal frequency and trend transitions.
🔔 Alerts: Built-in alerts for trade signals and price interactions with Fib levels.
⚙️ Fully Customizable: Modify SMA, pivot length, depth, deviation multiplier, line extension style, color themes, and more.
📈 Benefits for Traders
✅ Enhanced Trend Confirmation using Dow Theory logic with SMA filtering.
✅ Precision Entry & Exit Zones through auto-drawn Fibonacci retracement and extension levels.
✅ Reduces False Signals by requiring both market structure and trend alignment.
✅ Saves Time with automated drawing and real-time alerts.
✅ Ideal for All Assets & Timeframes: Works seamlessly across Forex, Crypto, Stocks, and Commodities.
💼 Best Use Cases
Intraday & swing trading using market structure.
Identifying major retracement zones for pullback entries.
Recognizing Fibonacci confluence zones to set stop-loss and take-profit levels.
Trend-following strategies validated by SMA and Dow confirmation.
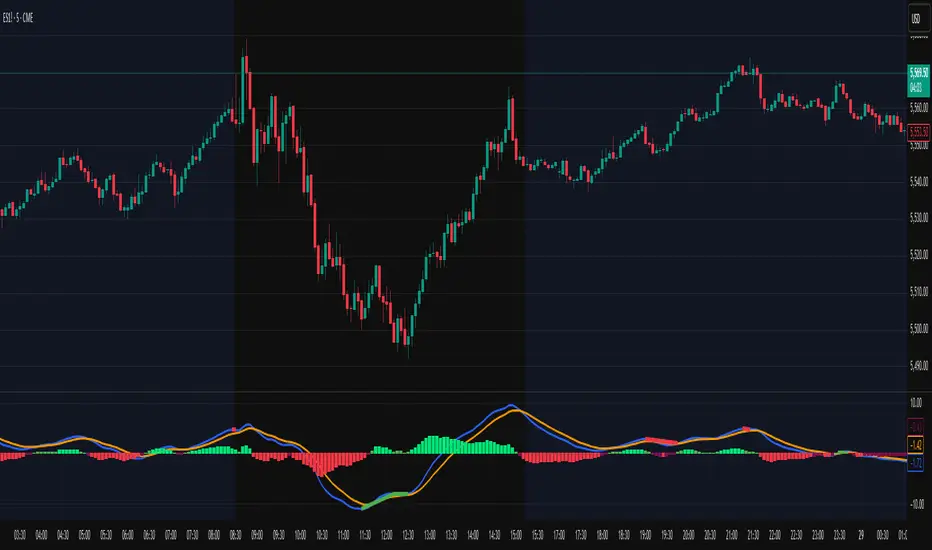
Smart Adaptive MACDAn advanced MACD variant that dynamically adapts to market volatility using ATR-based scaling.
Key Features:
Volatility-sensitive MACD and Signal lengths
Optional smoothed MACD line
Dynamic histogram heatmap (strong vs. weak momentum)
Built-in Regular and Hidden Divergence detection
Clear visual signals via solid (regular) and dashed (hidden) divergence lines
What makes this different:
Unlike traditional MACD indicators with fixed-length settings, this version adapts in real time
to changing volatility conditions. It shortens during high-momentum environments for faster
reaction, and lengthens during low-volatility phases to reduce noise. This allows better
alignment with market behavior and cleaner momentum signals.
Divergence Detection – How It Works
The Smart Adaptive MACD detects both regular and hidden divergences by comparing price action with the smoothed MACD line. It uses recent pivot highs and lows to evaluate divergence and draws lines on the chart when conditions are met.
Regular Divergence Detection
This type of divergence signals potential reversals. It occurs when the price moves in one
direction while the MACD moves in the opposite.
Bullish Regular Divergence:
Price makes lower lows, but MACD makes higher lows.
Result: A solid green line is plotted beneath the MACD curve.
Bearish Regular Divergence:
Price makes higher highs, but MACD makes lower highs.
Result: A solid red line is plotted above the MACD curve.
Hidden Divergence Detection
This type of divergence signals trend continuation. It occurs when price pulls back slightly,
but the MACD shows deeper movement in the opposite direction.
Bullish Hidden Divergence:
Price makes higher lows, but MACD makes lower lows.
Result: A dashed green line is plotted below the MACD curve.
Bearish Hidden Divergence:
Price makes lower highs, but MACD makes higher highs.
Result: A dashed red line is plotted above the MACD curve.
How to Use:
This tool is best used alongside price structure, key support/resistance levels, or as a
secondary confirmation for your trend or reversal strategy. It is designed to enhance your
interpretation of market momentum and divergence without needing extra chart clutter.
Disclaimer:
This script is provided for educational and informational purposes only. It is not intended as
financial advice or a recommendation to buy or sell any asset. Always conduct your own
research and consult with a licensed financial advisor before making trading decisions. Use
at your own risk.
License:
This script is published under the Mozilla Public License 2.0 and is fully open-source.
Built by AresIQ | 2025
MTF Analysis Panel [Invesmate]MTF Analysis Panel
This indicator provides a compact Multi-Timeframe (MTF) view of trend and momentum conditions directly on the chart. It combines EMA trend checks, RSI momentum checks, and optional Relative Strength analysis to offer an intuitive overview of market structure across intraday, daily, weekly, and monthly timeframes.
Trend and Momentum Analysis
The script uses two primary methods for assessing the market:
Trend Detection: Based on price relation to a user-selected EMA for each timeframe.
Momentum Detection: Based on whether RSI is above or below 50 for each timeframe.
Users can independently toggle these modules through inputs to customize the panel for different analysis needs.
Trend and momentum are calculated separately to avoid bias, helping traders capture the real state of the market across multiple timeframes.
Relative Strength (Optional)
If enabled, when either Weekly or Monthly timeframes are selected, the panel will display Relative Strength (RS ) data.
RS measures the stock's performance relative to a benchmark symbol (like NSE:NIFTY).
This value shows the percent outperformance or underperformance over a user-defined period (default 55 days), allowing deeper market strength analysis.
Table and Display Logic
The indicator draws a neat panel on the chart using TradingView’s table functionality.
Each selected timeframe (15m, 1h, 4h, 1D, 1W, 1M) will display:
Trend (EMA): Green for bullish trend (Price > EMA), Red for bearish trend (Price < EMA), Gray if neutral or not applicable.
Momentum (RSI): Green if RSI > 50, Red if RSI < 50, Gray if neutral.
Symbols for trend and momentum can be customized between:
Emoji mode (e.g., 🟢, 🔴, 🟦, 🟥)
Text mode (e.g., UP, DOWN, NEUTRAL)
The panel is customizable for position (Top Left, Top Right, Bottom Left, Bottom Right) to fit user preference.
Color Codes
Strong Bullish: All selected timeframes are trending up and momentum is rising — shown with a light green background.
Strong Bearish: All selected timeframes are trending down and momentum is falling — shown with a light red background.
Mixed: Any mixed state (some up, some down) — shown with a neutral gray background.
This helps traders instantly recognize overall market sentiment without manually checking individual timeframes.
Summary Labels
At the bottom of the panel, two powerful summaries are displayed:
Trend Summary: Overall trend aggregation across selected timeframes ("STRONG BULLISH", "STRONG BEARISH", or "MIXED").
Momentum Summary: Overall momentum aggregation ("MOMENTUM UP", "MOMENTUM DOWN", or "MOMENTUM MIXED").
When Relative Strength is available (Weekly or Monthly enabled), it is also shown separately at the bottom, providing a complete strength-versus-benchmark view.
Input Controls
Enable EMA Trend Check: Toggle EMA-based trend detection.
Enable RSI Momentum Check: Toggle RSI-based momentum detection.
Timeframes to Display: 15m, 1h, 4h, 1D, 1W, 1M can be independently turned on or off.
EMA Length per Timeframe: Customize EMA lengths for different timeframes.
RSI Length: Set RSI calculation period.
Comparative Symbol: Select the benchmark symbol for Relative Strength calculations.
RS Period: Choose the lookback period for Relative Strength.
Emoji Display Toggle: Switch between emoji-based or text-based display styles.
Table Location: Choose where the analysis panel appears on the chart.
Special Features
Realtime Updating: The panel updates dynamically as bars close, maintaining real-time relevance.
Maximum Label Control : Designed to respect TradingView's maximum label limits to avoid runtime errors.
Optimized for Performance: Uses conditional requests and security calls efficiently, minimizing script execution load.
Known Limitations
Request.security limitations: Relative Strength is only calculated on Daily data for stability; lower timeframe RS is not implemented.
TradingView Table Size: On some screen sizes or with many timeframes selected, table may overlap candles. Adjust panel location accordingly.

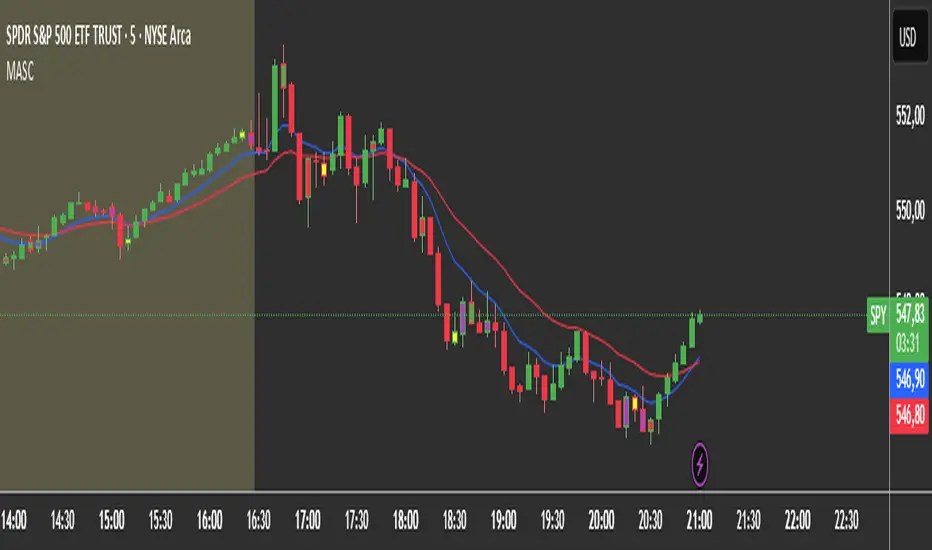
2 MA + Strat Candle ColorsThe "2 MA + Strat Candle Colors" indicator combines two customizable moving averages (MAs) with a strategic candle-coloring system to help traders analyze trends and price action. Here’s a breakdown of its features:
1. Two Moving Averages (MAs):
MA 1 & MA 2 Settings:
Users can select between 7 MA types for each line: SMA, EMA, WMA, HMA, VWMA, LSMA, SMMA.
Adjustable periods and price sources (e.g., close, open) for both MAs.
Default settings: MA 1 = 9-period EMA, MA 2 = 20-period EMA.
Plotting:
MA 1 is blue, MA 2 is red (colors customizable via inputs).
Crossovers between the MAs can signal trend changes.
2. Strategic Candle Coloring:
Candles are colored based on their relationship to the previous candle:
Green (Bullish): "Two-Up Bar" – current high > prior high, and low does not break prior low.
Red (Bearish): "Two-Down Bar" – current low < prior low, and high does not break prior high.
Purple (Outside Bar): "Three Bar" – current candle engulfs the prior candle (higher high and lower low).
Yellow (Inside Bar): "One Bar" – current candle is contained within the prior candle’s range.
Candle coloring is based on:
Long Bar With ATR Multi Timframe | Amoo HassanLong Bar with ATR Multi Timeframe | Amoo Hassan
Looking for a smarter way to spot powerful moves in the market?
Long Bar with ATR Multi Timeframe is built exactly for that!
This tool helps you catch strong trend breakouts and potential reversals — in a simple, clear, and effective way.
What This Script Does:
Detects Long Bars: It looks for candles with a larger body compared to recent averages and confirms them with ATR (Average True Range). Only truly significant moves are highlighted.
Trend Filtering: Uses fast and slow moving averages (60 EMA, 34 EMA, and 200 SMA) to check if the overall market trend supports your trade.
Multi-Timeframe Supertrend: Supertrend signals are combined across different timeframes to give extra confirmation and reduce false signals.
Sharp Peaks and Valleys: Special candlestick patterns like sharp tops and bottoms are detected automatically.
Smart Trading Sessions: Trades are filtered based on the most active trading hours, avoiding dead times when price action is messy.
Important Date Control: On days with historically strange price action (like the 13th and 20th), the script stays cautious by disabling trades.
Clear Buy and Sell Labels: When all conditions are aligned, you'll see clean and clear "BUY" or "SELL" signals right on your chart.
Why You'll Like It:
It's easy to use, even if you're not a technical analysis expert.
It helps you avoid bad trades and focus on quality setups.
It fits into your existing trading system — or it can work as a standalone entry tool.
Friendly Reminder:
No indicator is 100% perfect! Always combine signals with good risk management and your own judgment.
And remember: Past results don't guarantee future performance.
Best Timeframes:
For the best results, we recommend using this script on 5-minute and 1-minute timeframes.

[blackcat] L3 Dynamic CrossOVERVIEW
The L3 Dynamic Cross indicator is a powerful tool designed to assist traders in identifying potential buy and sell opportunities through the use of dynamic moving averages. This versatile script offers a wide range of customizable options, allowing users to tailor the moving averages to their specific needs and preferences. By providing clear visual cues and generating precise crossover signals, it helps traders make informed decisions about market trends and potential entry/exit points 📈💹.
FEATURES
Multiple Moving Average Types:
Simple Moving Average (SMA): Provides a straightforward average of prices over a specified period.
Exponential Moving Average (EMA): Gives more weight to recent prices, making it responsive to new information.
Weighted Moving Average (WMA): Assigns weights to all prices within the look-back period, giving more importance to recent prices.
Volume Weighted Moving Average (VWMA): Incorporates volume data to provide a more accurate representation of price movements.
Smoothed Moving Average (SMMA): Averages out fluctuations to create a smoother trend line.
Double Exponential Moving Average (DEMA): Reduces lag by applying two layers of exponential smoothing.
Triple Exponential Moving Average (TEMA): Further reduces lag with three layers of exponential smoothing.
Hull Moving Average (HullMA): Combines weighted moving averages to minimize lag and noise.
Super Smoother Moving Average (SSMA): Uses a sophisticated algorithm to smooth out price data while preserving trend direction.
Zero-Lag Exponential Moving Average (ZEMA): Eliminates lag entirely by adjusting the calculation method.
Triangular Moving Average (TMA): Applies a double smoothing process to reduce volatility and enhance trend identification.
Customizable Parameters:
Length: Adjust the period for both fast and slow moving averages to match your trading style.
Source: Select different price sources such as close, open, high, or low for more nuanced analysis.
Visual Representation:
Fast MA: Displayed as a green line representing shorter-term trends.
Slow MA: Shown as a red line indicating longer-term trends.
Crossover Signals:
Generate buy ('BUY') and sell ('SELL') labels based on crossover events between the fast and slow moving averages 🏷️.
Clear visual cues help traders quickly identify potential entry and exit points.
Alert Functionality:
Receive real-time notifications when crossover conditions are met, ensuring timely action 🔔.
Customizable alert messages for personalized trading strategies.
Advanced Trade Management:
Support for pyramiding levels allows traders to manage multiple positions effectively.
Fine-tune your risk management by setting the number of allowed trades per signal.
HOW TO USE
Adding the Indicator:
Open your TradingView chart and go to the indicators list.
Search for L3 Dynamic Cross and add it to your chart.
Configuring Settings:
Choose your desired Moving Average Type from the dropdown menu.
Adjust the Fast MA Length and Slow MA Length according to your trading timeframe.
Select appropriate Price Sources for both fast and slow moving averages.
Monitoring Signals:
Observe the plotted lines on the chart to track short-term and long-term trends.
Look for buy and sell labels that indicate potential trade opportunities.
Setting Up Alerts:
Enable alerts based on crossover conditions to receive instant notifications.
Customize alert messages to suit your trading plan.
Managing Positions:
Utilize the pyramiding feature to handle multiple entries and exits efficiently.
Keep track of your position sizes relative to the defined pyramiding levels.
Combining with Other Tools:
Integrate this indicator with other technical analysis tools for confirmation.
Use additional filters like volume, RSI, or MACD to enhance decision-making accuracy.
LIMITATIONS
Market Conditions: The effectiveness of the indicator may vary in highly volatile or sideways markets. Be cautious during periods of low liquidity or sudden price spikes 🌪️.
Parameter Sensitivity: Different moving average types and lengths can produce varying results. Experiment with settings to find what works best for your asset class and timeframe.
False Signals: Like any technical indicator, false signals can occur. Always confirm signals with other forms of analysis before executing trades.
NOTES
Historical Data: Ensure you have enough historical data loaded into your chart for accurate moving average calculations.
Backtesting: Thoroughly backtest the indicator on various assets and timeframes using demo accounts before deploying it in live trading environments 🔍.
Customization: Feel free to adjust colors, line widths, and label styles to better fit your chart aesthetics and personal preferences.
EXAMPLE STRATEGIES
Trend Following: Use the indicator to ride trends by entering positions when the fast MA crosses above/below the slow MA and exiting when the opposite occurs.
Mean Reversion: Identify overbought/oversold conditions by combining the indicator with oscillators like RSI or Stochastic. Enter counter-trend positions when the moving averages diverge significantly from the mean.
Scalping: Apply tight moving average settings to capture small, quick profits in intraday trading. Combine with volume indicators to filter out weak signals.

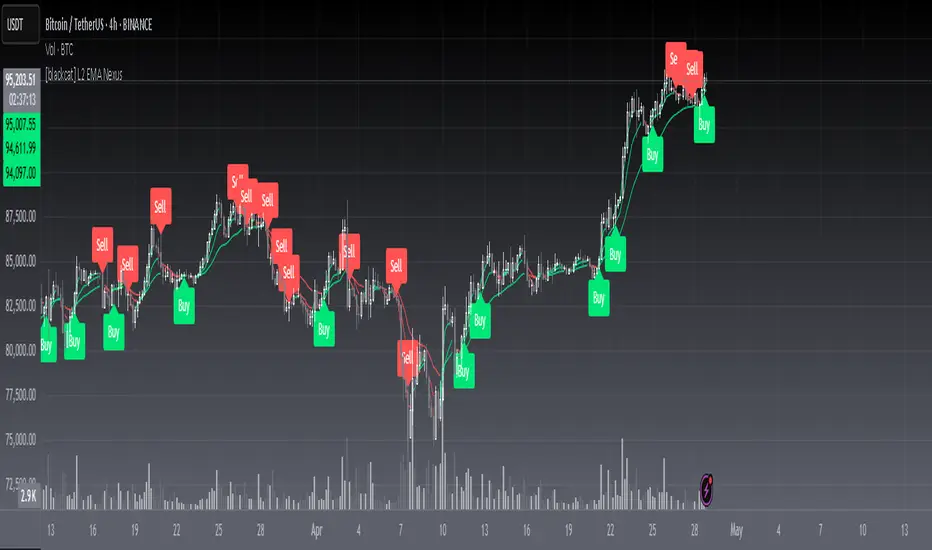
[blackcat] L2 EMA NexusOVERVIEW
The L2 EMA Nexus is a comprehensive trading indicator that utilizes a three-tiered Exponential Moving Average (EMA) system to identify potential trading opportunities. This script combines technical analysis with robust risk management features to help traders make informed decisions.
KEY FEATURES
• Triple EMA Analysis:
Customizable source inputs for each EMA
Adjustable length parameters (3, 8, 21 periods)
Dynamic color coding based on trend direction
Real-time price action monitoring
• Advanced Entry Signals:
High-low price action verification
EMA cross-overs and cross-unders
Multi-timeframe trend confirmation
Dynamic position sizing limits
• Risk Management:
Configurable Take Profit levels
Flexible Stop Loss settings
Optional TP/SL activation
Clear visual indicators for levels
HOW TO USE
Setup Initial Parameters:
Configure EMA lengths for your timeframe
Set Take Profit percentage (default 25%)
Define Stop Loss percentage (default 2.5%)
Adjust pyramiding limit as needed
Enable/Disable Features:
Toggle TP/SL settings based on strategy
Customize alert conditions
Modify visual labels for clarity
Monitor Trading Signals:
Watch for buy/sell labels
Track TP/SL levels
Monitor position status
TRADE MANAGEMENT
• Entry Conditions:
Long Entry: Higher high with rising EMA1 and stable EMA3
Short Entry: Lower low with falling EMA1 and stable EMA2
• Exit Conditions:
Take Profit: Price reaches defined percentage above/below entry
Stop Loss: Price reaches defined percentage below/above entry
• Position Control:
Limited to specified number of positions
Automatic position tracking
Clear visual indication of current trades
TECHNICAL DETAILS
• EMA Calculation:
Uses Exponential Moving Average for trend following
Color-coded based on 2-bar trend direction
Multiple timeframe compatibility
• Label System:
Clear buy/sell markers
Take Profit and Stop Loss indicators
Real-time position status updates
• Alert Configuration:
Customizable alert messages
Multiple alert conditions
Option to enable/disable specific alerts
LIMITATIONS
⚠️ Important Considerations:
Results may vary across different market conditions
Historical performance does not guarantee future results
Always backtest strategy before live trading
Consider complementing with additional analysis tools
BEST PRACTICES
• Recommended Timeframes:
Daily charts for long-term strategies
4-hour charts for swing trading
1-hour charts for short-term trading
• Risk Management Tips:
Start with small position sizes
Always use TP/SL in live trading
Monitor market volatility before entering trades
TROUBLESHOOTING
• Common Issues:
Ensure proper chart resolution
Verify alert conditions are enabled
Check for conflicting indicators
• Performance Optimization:
Use appropriate timeframe for your strategy
Adjust indicator parameters based on market conditions
Monitor for potential overfitting
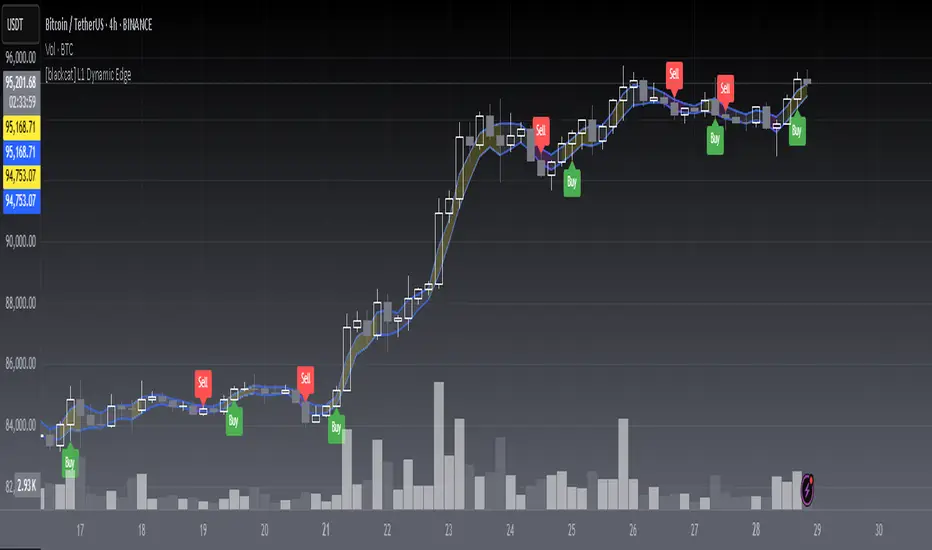
[blackcat] L1 Dynamic EdgeOVERVIEW
📈 The L1 Dynamic Edge is a sophisticated trend-following indicator designed to empower traders with a comprehensive view of market dynamics and precise buy/sell signals. By leveraging multiple Exponential Moving Averages (EMAs) and advanced signal processing, this indicator aims to capture the essence of price momentum and provide actionable insights across various financial instruments and timeframes.
🔑 Key Features:
Fully customizable EMA settings
Multi-dimensional trend analysis using high, low, and midpoint EMAs
Intuitive color-coded trend visualization
Accurate buy/sell signals with visual confirmation
Flexible alert system for real-time notifications
Seamless integration with TradingView's charting tools
FEATURES
📉 Advanced Trend Detection:
Utilizes three distinct EMAs (high, low, and midpoint) for a holistic view of market trends
Employs sophisticated logic to determine rising and falling trends
🌟 Dynamic Visualization:
Automatically adjusts the color of EMA plots based on detected trend direction
Fills the area between high and low EMAs for enhanced visual clarity
📈 Precision Signal Generation:
Identifies potential trend reversals using a combination of price action and EMA behavior
Generates clear buy/sell signals based on trend changes
📊 Comprehensive Chart Integration:
Displays buy/sell signals as easily identifiable shapes on the chart
Adds descriptive labels to signal bars for quick reference
🔔 Customizable Alert System:
Provides alert conditions for both buy and sell signals
Allows users to stay informed about potential trading opportunities even when away from the chart
🛠️ User-Friendly Interface:
Simple input parameters for easy customization
Clean and uncluttered chart appearance without overwhelming the user
🌐 Versatile Application:
Adaptable to various financial instruments, including stocks, forex, commodities, and cryptocurrencies
Effective across different timeframes, from short-term scalping to long-term investing
HOW TO USE
✨ Adding the Indicator:
Open your TradingView chart
Click on "Add Indicator" at the top of the screen
Search for " L1 Dynamic Edge" and add it to your chart
🔧 Customizing Settings:
Adjust the EMA length in the input panel to suit your trading style and preferences
Experiment with different values to find what works best for your specific strategy
🕵️♂️ Analyzing Trends:
Observe the color of the EMA bands to quickly assess the overall market sentiment
Note how the filling between the high and low EMAs responds to price movements
📈 Identifying Opportunities:
Watch for buy/sell signals indicated by triangles and labels on the chart
Consider these signals as potential entry/exit points for your trades
🎯 Implementing Strategies:
Combine the indicator's signals with your own analysis and risk management techniques
Use the provided alerts to stay informed about new trading opportunities
🚨 Setting Up Alerts:
Configure alert conditions for buy and sell signals
Choose your preferred notification method (email, SMS, push notifications, etc. )
📊 Fine-Tuning Your Approach:
Regularly review and analyze the indicator's performance
Adjust the EMA length and other parameters as needed to adapt to changing market conditions
LIMITATIONS
Like any technical indicator, the L1 Dynamic Edge should not be used as a standalone trading system
Its effectiveness may be limited during periods of extreme volatility or in highly ranging markets
The indicator's performance will vary depending on the specific instrument and timeframe being analyzed
New traders might need some time to fully understand and effectively utilize all features of the indicator
NOTES
This script utilizes Pine Script version 5 for optimal performance and compatibility with TradingView's latest features
The default EMA length is set to 3, which provides a balance between responsiveness and noise reduction
The indicator's color scheme has been carefully chosen to ensure maximum visibility while maintaining a clean chart appearance
For best results, consider combining this indicator with other forms of technical and fundamental analysis
Regular backtesting and forward testing are crucial to optimize the indicator's settings for your specific trading style and market conditions
THANKS
We extend our deepest gratitude to the vibrant TradingView community for their invaluable feedback, suggestions, and support throughout the development process of the L1 Dynamic Edge indicator. Special thanks to all the dedicated traders who took the time to test and refine this tool, helping us create a more robust and user-friendly experience for everyone.
Swing Trade TarayıcıSwing Trade Scanner (v6) User Guide
1. Purpose:
This TradingView indicator (written in Pine Script v6) is designed to help identify swing trading opportunities. It calculates an overall trend strength and direction score by combining multiple technical analyses for up to 20 financial assets (stocks, cryptocurrencies, forex, etc.) that you specify. It presents the results in a customizable table, allowing you to quickly scan the market.
2. Analyses Used and Their Roles:
By default, the indicator uses the following 4 main technical analyses:
EMA Crossover (Default: 9/21): Used to capture short-term trend direction and potential momentum shifts. When the fast EMA (9) crosses above the slow EMA (21), it's considered a bullish signal; when it crosses below, it's a bearish signal. It's often one of the main entry/exit triggers.
RSI (Relative Strength Index - Default: 14): Measures the speed of price movements to identify overbought (OB) and oversold (OS) conditions. Reversals from the OB zone can signal potential downturns, while reversals from the OS zone can signal potential upturns. It also provides insight into the strength of the momentum.
MACD (Moving Average Convergence Divergence - Default: 12, 26, 9): A trend-following momentum indicator. The relationship between the MACD line and the signal line (crossovers) and the state of the histogram (position relative to the zero line) are used to confirm momentum shifts and trend strength.
ADX/DI (Average Directional Index - Default: 14, 14): Measures the strength (ADX) and direction (+DI/-DI lines) of a trend. Its main role is to filter signals from other indicators. A trend is considered to exist if the ADX is above a certain threshold (e.g., 25). +DI above -DI indicates an uptrend, and the reverse indicates a downtrend.
3. Scoring System:
The indicator calculates an individual score for each analysis and then combines these scores using weights you define to create a final Trend Score:
Individual Scores: Each analysis (EMA, RSI, MACD, ADX/DI) generates a decimal score between -1.0 (Strong Negative/Bearish) and +1.0 (Strong Positive/Bullish) based on its own rules. For example, RSI might score +1.0 if oversold, -1.0 if overbought, and 0.0 if neutral. MACD and ADX/DI scores can also take intermediate values reflecting both direction and strength (e.g., ±1.0, ±0.6, ±0.3, 0.0).
Weighting: In the settings, you can assign a weight (between 0.0 and 1.0) to each analysis, determining how much it influences the final score. For instance, you might give EMA crossover a higher weight and use RSI with a lower weight.
Total Score: The individual scores of the active analyses are multiplied by their assigned weights and summed up. This total is then divided by the sum of the weights of the active analyses to obtain a final, normalized Trend Score between -1.0 and +1.0. This score represents the combined view of all analyses.
4. Trend Determination:
The calculated final Trend Score is classified into an overall TREND status based on threshold values you set in the settings:
S.UP (Strong Up): Score > Strong Up Threshold (Default: 0.70)
UP: Up Threshold < Score <= Strong Up Threshold (Default: 0.35 < Score <= 0.70)
NEUTRAL: Down Threshold <= Score <= Up Threshold (Default: -0.35 <= Score <= 0.35)
DOWN: Strong Down Threshold <= Score < Down Threshold (Default: -0.70 <= Score < -0.35)
S.DOWN (Strong Down): Score < Strong Down Threshold (Default: -0.70)
This classification allows you to see at a glance which assets have strong trend potential.
5. Table Structure and Meanings:
The indicator displays the results in a table with the following columns:
TICKER: The symbol of the analyzed asset (abbreviated).
TREND: The overall trend status determined by the total score (S.UP, UP, NEUTRAL, DOWN, S.DOWN). The background color of this column also reflects this overall trend (Dark Green, Green, Gray, Red, Dark Red).
SCORE: The calculated weighted total score (between -1.00 and +1.00, with two decimal places). The background color of this column also reflects the overall trend.
EMA: Shows the result of only the EMA 9/21 analysis.
▲: EMA(9) > EMA(21) (Green Background)
▼: EMA(9) < EMA(21) (Red Background)
N: Neutral (Gray Background)
-: Analysis disabled or no data (Pale Gray Background)
RSI: Shows the result of only the RSI analysis.
OS: Oversold (RSI < 30) (Green Background)
M+: Mid Positive (30 <= RSI < 45) (Light Green/Lime Background)
N: Neutral (45 <= RSI <= 55) (Gray Background)
M-: Mid Negative (55 < RSI <= 70) (Orange Background)
OB: Overbought (RSI > 70) (Red Background)
-: Analysis disabled or no data (Pale Gray Background)
MACD: Shows the result of only the MACD analysis.
S+: Strong Positive (MACD > Signal AND Histogram > 0) (Green Background)
M+: Mid Positive (MACD > Signal BUT Histogram < 0) (Light Green/Lime Background)
N: Neutral (Other cases) (Gray Background)
M-: Mid Negative (MACD < Signal BUT Histogram > 0) (Orange Background)
S-: Strong Negative (MACD < Signal AND Histogram < 0) (Red Background)
-: Analysis disabled or no data (Pale Gray Background)
ADX/DI: Shows the result of only the ADX/DI analysis.
S+: Strong Uptrend (ADX > 40 AND +DI > -DI) (Green Background)
M+: Mid Uptrend (25 < ADX <= 40 AND +DI > -DI) (Light Green/Lime Background)
W: Weak Trend (ADX <= 25) (Gray Background)
M-: Mid Downtrend (25 < ADX <= 40 AND -DI > +DI) (Orange Background)
S-: Strong Downtrend (ADX > 40 AND -DI > +DI) (Red Background)
-: Analysis disabled or no data (Pale Gray Background)
6. Settings (Inputs):
You can customize the indicator's behavior using the following settings:
General Settings:
Analysis Timeframe: Select the timeframe for the scans (Leave blank to use the chart timeframe).
Auto Adjust Parameters and Weights: If checked, predefined parameters and weights based on the selected timeframe (1h, 4h, 1D, 1W) are used. If unchecked, or if an unsupported timeframe is selected, the manual settings below apply.
Strong/Normal Up/Down Thresholds: Adjust the score thresholds used to determine the TREND column.
Analysis Settings (Separate Group for Each Analysis):
Enable ... Analysis: Check to include the respective analysis in the score.
... Weight (Manual): If auto-adjust is off, set the weight of this analysis in the total score.
... Period/Level (Manual): If auto-adjust is off, adjust the parameters (period, level, etc.) of the respective indicator.
Symbols (1-10):
Checkbox: Check to include the respective symbol in the scan.
Text Box: Enter the symbol of the asset you want to analyze (e.g., "NASDAQ:AAPL", "BINANCE:BTCUSDT").
Table Settings:
Table Position: Choose where the table appears on the chart.
Cell Width: Adjust the width of the table cells.
Text Size: Select the general size of the text in the table (individual analysis columns are usually shown one size smaller).
7. How to Use:
Add the indicator to your TradingView chart.
Enter the indicator settings.
In the Symbols section, enter the symbols of the assets you want to analyze and check the boxes next to them.
In the General Settings section, select your desired Analysis Timeframe.
Decide whether the Auto Adjust Parameters and Weights option should be checked. If not, adjust the manual parameters and weights for each indicator in the Analysis Settings section according to your strategy.
Examine the table:
The TREND and SCORE columns give you a general overview. Focus on strong signals (S.UP, S.DOWN) or states that have just crossed thresholds (UP, DOWN).
The EMA, RSI, MACD, ADX/DI columns allow you to see in detail which analyses influenced the overall score. You can track confirming or conflicting signals here.
Combine these scan results with other rules of your swing trading strategy (support/resistance, patterns, risk management, etc.) to make trading decisions.
8. Important Notes:
This indicator does not constitute financial advice. It is merely a tool that combines technical analysis tools to help you scan the market.
The default parameters and weights in the indicator settings are for general use. For best results, it is strongly recommended that you optimize these settings by backtesting them on historical data according to your own strategy, the assets you trade, and market conditions.
No technical indicator or system generates 100% accurate signals. Always apply risk management principles and do not trade with money you cannot afford to lose.
I hope this guide helps you use the indicator effectively!

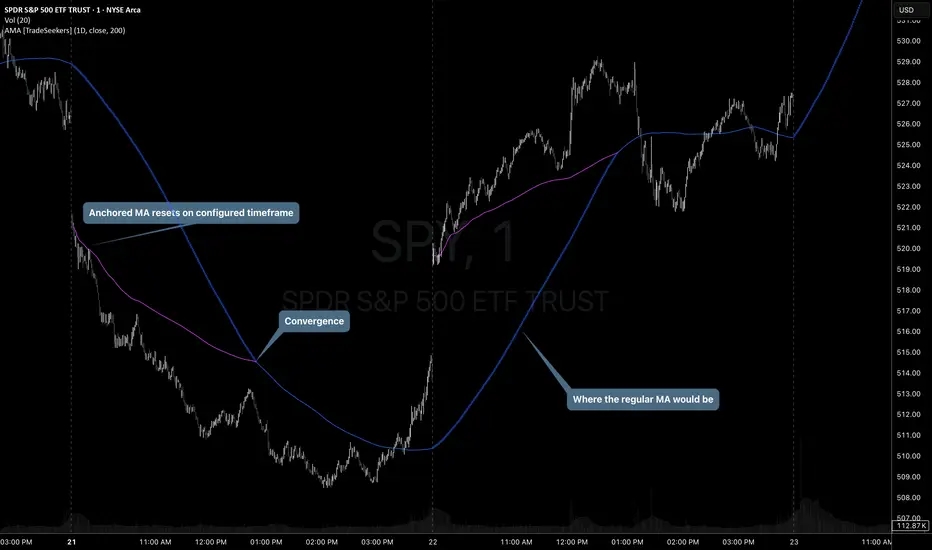
Anchored Moving Average by TradeSeekersThis script plots an SMA that resets based on the selected anchored timeframe, by default it is 1D.
There exists some other AMA scripts but I didn't find anything that plotted the non-anchored MA alongside the AMA and displayed the point of convergence.
The non-anchored MA presents slightly opaque as a circle plot until the anchored MA converges.
Until the anchored MA contains enough data an simple average is calculated of all source prices collected starting from the anchor.
For example, if the timeframe has reset and source is set to closing prices, then after the first bar the AMA is essentially the last closing price. After two bars have closed then the AMA is an average of the last two closing prices.
Future updates may add additional average types as time permits.
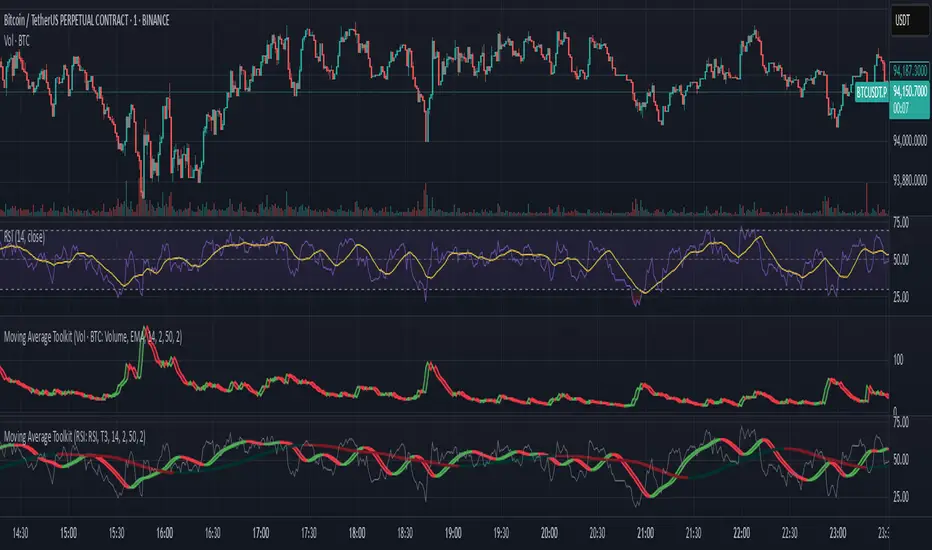
Moving Average ToolkitMoving Average Toolkit - Advanced MA Analysis with Flexible Source Input
A powerful and versatile moving average indicator designed for maximum flexibility. Its unique source input feature allows you to analyze moving averages of ANY indicator or price data, making it perfect for creating custom combinations with RSI, Volume, OBV, or any other technical indicator.
Key Features:
• Universal Source Input:
- Analyze moving averages of any data: Price, Volume, RSI, MACD, Custom Indicators
- Perfect for creating advanced technical setups
- Identify trends in any technical data
• 13 Moving Average Types:
- Traditional: SMA, EMA, WMA, RMA, VWMA
- Advanced: HMA, T3, DEMA, TEMA, KAMA, ZLEMA, McGinley, EPMA
• Dual MA System:
- Compare two different moving averages
- Independent settings for each MA
- Perfect for multiple timeframe analysis
• Visual Offset Analysis:
- Dynamic color changes based on momentum
- Fill between current and offset values
- Clear visualization of trend strength
Usage Examples:
• Price Trend: Traditional MA analysis using price data
• Volume Trend: Apply MA to volume for volume trend analysis
• RSI Trend: Smooth RSI movements for clearer signals
• Custom: Apply to any indicator output for unique insights
Settings:
• Fully customizable colors for bull/bear conditions
• Adjustable offset periods
• Independent length settings
• Optional second MA for comparison
Perfect for:
• Advanced technical analysts
• Multi-indicator strategy developers
• Custom indicator creators
• Traders seeking flexible analysis tools
This versatile toolkit goes beyond traditional moving averages by allowing you to apply sophisticated MA analysis to any technical data, creating endless possibilities for custom technical analysis strategies.
BTC Price-Volume Efficiency Z-Score (PVER-Z)Overview:
This PVER-Z Score measures Bitcoin’s price movement efficiency relative to trading volume, normalized using a Z-Score over a long-term 200-day period.
It highlights statistically rare inefficiencies, helping investors spot extreme accumulation and distribution zones for systematic SDCA strategies.
Concept:
- Measures how efficiently price has moved relative to the volume that supported it over a long historical window (Default 200 days) but can be adjustable.
- It compares cumulative price changes vs cumulative volume flow.
- Then normalizes those inefficiencies using Z-Score statistics.
How It Works:
1. Calculates the absolute daily price change divided by volume (price-volume efficiency ratio).
2. Applies EMA smoothing to remove noisy fluctuations.
3. Normalizes the result into a Z-Score to detect statistically significant outliers.
4. Plots dynamic heatmap colors as the efficiency score moves through different deviation zones.
5. Background fills appear when the Z-Score moves beyond ±2 to ±3 SD, signaling rare macro opportunities.
Why is Bitcoin price rising while PVER-Z is falling toward green zone?
1. PVER-Z is not just "price" — it's price change relative to volume. PVER-Z measures how efficient the price movement is relative to volume. It's not "price going up" or "price going down" directly. It's how unusual or inefficient the price versus volume relationship is, compared to its historical average.
2. A rising Bitcoin price + weak efficiency = PVER-Z falls.
If Bitcoin rises but volume is super strong (normal buying volume), no problem, the PVER-Z stays normal. If Bitcoin rises but with very weak volume support, PVER-Z falls.
***Usage Notes***:
- Best used on the daily timeframe or higher.
- When the Z-Score enters the green zone (-2 to -3 SD), it signals a historically rare accumulation zone — favoring long-term buying for SDCA.
- When the Z-Score enters the red zone (+2 to +3 SD), it signals overextended distribution — caution recommended.
- Designed strictly for mean-reversion analysis, no trend-following signals.
- The red zone on a proper Z chart would be -2SD to -3SD and +2SD to +3SD for the green zone. At the time of publishing I do not know how to adjust the values on the indicator itself. The red zone at -2SD is actually +2 Standard Deviations on a Z Score SD Chart. (overbought zone).
- Your green zone at +2SD is actually -2SD Standard Deviations (oversold zone).
- Built manually with no reliance on built-in indicators
- Designed for Bitcoin on the 1D, 3D, or Weekly timeframes. NOT for intraday trading.
- DO NOT SOELY RELY ON THIS INDICATOR FOR YOUR LONG TERM VALUATION. I AM NOT RESPONSIBLE FOR YOUR FINANICAL ASSETS.

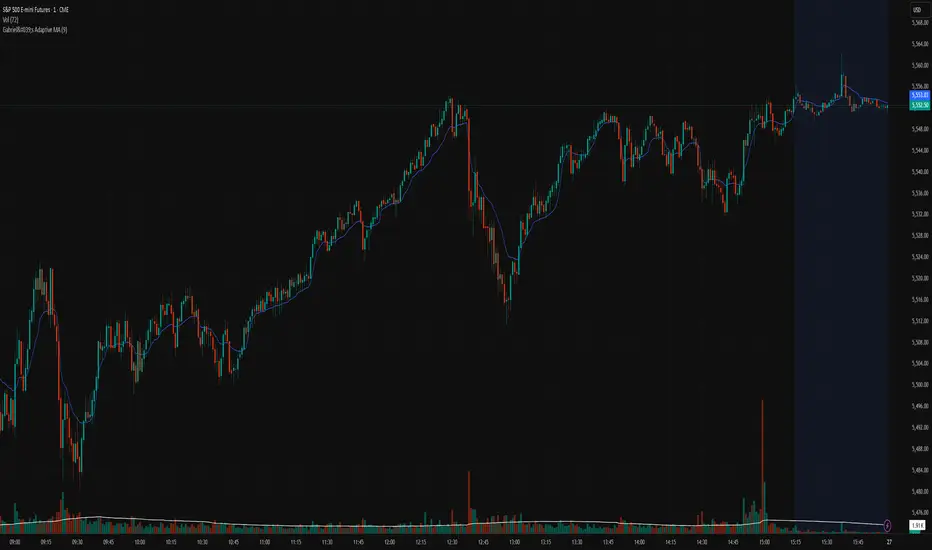
Gabriel's Adaptive MA📜 Gabriel's Adaptive MA — Indicator Description
Gabriel's Adaptive Moving Average (GAMA) is a dynamic trend-following indicator that intelligently adjusts its smoothing based on both trend strength and market volatility.
It is designed to provide faster responsiveness during strong moves while maintaining stability during choppy or consolidating periods.
🧠 What it does:
This indicator plots a custom-built, highly dynamic Moving Average that adapts itself intelligently based on:
Trend Strength (via Perry Kaufman's Efficiency Ratio)
Market Volatility (via Tushar Chande's Volatility Ratio)
It reacts faster when the market is trending strongly and/or highly volatile,
and it smooths out and slows down when the market is choppy or calm.
🔍 How it works (step-by-step):
1. User Inputs:
length: (default 14)
How many bars to look back for calculations.
fastSC: Fastest possible smoothing constant (hardcoded as 2 / (2+1))
slowSC: Slowest possible smoothing constant (hardcoded as 2 / (30+1))
(These are used to control how fast/slow the KAMA can react.)
2. Calculate Trendiness — Kaufman Efficiency Ratio (ER):
Net Change = Absolute difference between current close and close from length bars ago.
Sum of Absolute Changes = Sum of absolute price changes between every bar inside the length window.
Efficiency Ratio (ER) = Net Change divided by Sum of Changes.
✅ If ER is close to 1 → Smooth, trending market.
✅ If ER is close to 0 → Choppy, sideways market.
3. Calculate Bumpiness — Volatility Ratio (VR):
Short-Term Volatility = Standard deviation of close over length.
Long-Term Volatility = Standard deviation of close over length * 2.
Volatility Ratio (VR) = Short-Term Volatility divided by Long-Term Volatility.
✅ If VR is >1 → Market is becoming more volatile recently.
✅ If VR is <1 → Market is calming down.
4. Create the Hybrid Alpha:
Multiply ER × VR.
Then square the result (math.pow(..., 2)).
This hybrid alpha decides how aggressive the MA should be based on both trend and volatility.
If ER and VR are both strong → big alpha → fast movement.
If ER and/or VR are weak → small alpha → slow movement.
5. Calculate the Final Adaptive Smoothing Constant (hybridSC):
hybridSC = slowSC + hybridAlpha × (fastSC - slowSC)
This smoothly interpolates between the slowest and fastest smoothing depending on market conditions.
6. Calculate and Plot the Adaptive MA:
The moving average is manually calculated:
hybridMA := na(hybridMA ) ? close : hybridMA + hybridSC * (close - hybridMA )
It behaves like an EMA but with dynamic smoothing, not a fixed alpha.
✅ If hybridSC is high → MA hugs the price closely.
✅ If hybridSC is low → MA stays smooth and resists noise.
Finally, it plots this Adaptive MA on the chart in blue color.
📊 Visual Summary
Market Type What Happens to GAMA
Trending hard + volatile Follows price quickly
Trending hard + calm Follows steadily but carefully
Sideways + volatile Reacts carefully (won't chase noise)
Sideways + calm Smooths heavily (avoids fakeouts)
✨ Main Strengths:
Adapts automatically without you tuning settings manually every time market changes.
Responds smartly to both trend quality (ER) and market energy (VR).
Reduces lag during real moves.
Filters out false signals during choppy mess.
🧪 Key Innovation compared to normal MAs:
Traditional MA Gabriel's Adaptive MA
Same smoothing every bar Dynamic smoothing every bar
Slow during fast moves Adapts fast during real moves
No understanding of volatility or trendiness Full market sensitivity
⚡ **Simple One-Line Description:**
"Gabriel's Adaptive MA is a dynamic, trend-and-volatility-sensitive moving average that intelligently adjusts its speed to match market conditions."
Cointegration Buy and Sell Signals [EdgeTerminal]The Cointegration Buy And Sell Signals is a sophisticated technical analysis tool to spot high-probability market turning points — before they fully develop on price charts.
Most reversal indicators rely on raw price action, visual patterns, or basic and common indicator logic — which often suffer in noisy or trending markets. In most cases, they lag behind the actual change in trend and provide useless and late signals.
This indicator is rooted in advanced concepts from statistical arbitrage, mean reversion theory, and quantitative finance, and it packages these ideas in a user-friendly visual format that works on any timeframe and asset class.
It does this by analyzing how the short-term and long-term EMAs behave relative to each other — and uses statistical filters like Z-score, correlation, volatility normalization, and stationarity tests to issue highly selective Buy and Sell signals.
This tool provides statistical confirmation of trend exhaustion, allowing you to trade mean-reverting setups. It fades overextended moves and uses signal stacking to reduce false entries. The entire indicator is based on a very interesting mathematically grounded model which I will get into down below.
Here’s how the indicator works at a high level:
EMAs as Anchors: It starts with two Exponential Moving Averages (EMAs) — one short-term and one long-term — to track market direction.
Statistical Spread (Regression Residuals): It performs a rolling linear regression between the short and long EMA. Instead of using the raw difference (short - long), it calculates the regression residual, which better models their natural relationship.
Normalize the Spread: The spread is divided by historical price volatility (ATR) to make it scale-invariant. This ensures the indicator works on low-priced stocks, high-priced indices, and crypto alike.
Z-Score: It computes a Z-score of the normalized spread to measure how “extreme” the current deviation is from its historical average.
Dynamic Thresholds: Unlike most tools that use fixed thresholds (like Z = ±2), this one calculates dynamic thresholds using historical percentiles (e.g., top 10% and bottom 10%) so that it adapts to the asset's current behavior to reduce false signals based on market’s extreme volatility at a certain time.
Z-Score Momentum: It tracks the direction of the Z-score — if Z is extreme but still moving away from zero, it's too early. It waits for reversion to start (Z momentum flips).
Correlation Check: Uses a rolling Pearson correlation to confirm the two EMAs are still statistically related. If they diverge (low correlation), no signal is shown.
Stationarity Filter (ADF-like): Uses the volatility of the regression residual to determine if the spread is stationary (mean-reverting) — a key concept in cointegration and statistical arbitrage. It’s not possible to build an exact ADF filter in Pine Script so we used the next best thing.
Signal Control: Prevents noisy charts and overtrading by ensuring no back-to-back buy or sell signals. Each signal must alternate and respect a cooldown period so you won’t be overwhelmed and won’t get a messy chart.
Important Notes to Remember:
The whole idea behind this indicator is to try to use some stat arb models to detect shifting patterns faster than they appear on common indicators, so in some cases, some assumptions are made based on historic values.
This means that in some cases, the indicator can “jump” into the conclusion too quickly. Although we try to eliminate this by using stationary filters, correlation checks, and Z-score momentum detection, there is still a chance some signals that are generated can be too early, in the stock market, that's the same as being incorrect. So make sure to use this with other indicators to confirm the movement.
How To Use The Indicator:
You can use the indicator as a standalone reversal system, as a filter for overbought and oversold setups, in combination with other trend indicators and as a part of a signal stack with other common indicators for divergence spotting and fade trades.
The indicator produces simple buy and sell signals when all criteria is met. Based on our own testing, we recommend treating these signals as standalone and independent from each other . Meaning that if you take position after a buy signal, don’t wait for a sell signal to appear to exit the trade and vice versa.
This is why we recommend using this indicator with other advanced or even simple indicators as an early confirmation tool.
The Display Table:
The floating diagnostic table in the top-right corner of the chart is a key part of this indicator. It's a live statistical dashboard that helps you understand why a signal is (or isn’t) being triggered, and whether the market conditions are lining up for a potential reversal.
1. Z-Score
What it shows: The current Z-score value of the volatility-normalized spread between the short EMA and the regression line of the long EMA.
Why it matters: Z-score tells you how statistically extreme the current relationship is. A Z-score of:
0 = perfectly average
> +2 = very overbought
< -2 = very oversold
How to use it: Look for Z-score reaching extreme highs or lows (beyond dynamic thresholds). Watch for it to start reversing direction, especially when paired with green table rows (see below)
2. Z-Score Momentum
What it shows: The rate of change (ROC) of the Z-score:
Zmomentum=Zt − Zt − 1
Why it matters: This tells you if the Z-score is still stretching out (e.g., getting more overbought/oversold), or reverting back toward the mean.
How to use it: A positive Z-momentum after a very low Z-score = potential bullish reversal A negative Z-momentum after a very high Z-score = potential bearish reversal. Avoid signals when momentum is still pushing deeper into extremes
3. Correlation
What it shows: The rolling Pearson correlation coefficient between the short EMA and long EMA.
Why it matters: High correlation (closer to +1) means the EMAs are still statistically connected — a key requirement for cointegration or mean reversion to be valid.
How to use it: Look for correlation > 0.7 for reliable signals. If correlation drops below 0.5, ignore the Z-score — the EMAs aren’t moving together anymore
4. Stationary
What it shows: A simplified "Yes" or "No" answer to the question:
“Is the spread statistically stable (stationary) and mean-reverting right now?”
Why it matters: Mean reversion strategies only work when the spread is stationary — that is, when the distance between EMAs behaves like a rubber band, not a drifting cloud.
How to use it: A "Yes" means the indicator sees a consistent, stable spread — good for trading. "No" means the market is too volatile, disjointed, or chaotic for reliable mean reversion. Wait for this to flip to "Yes" before trusting signals
5. Last Signal
What it shows: The last signal issued by the system — either "Buy", "Sell", or "None"
Why it matters: Helps avoid confusion and repeated entries. Signals only alternate — you won’t get another Buy until a Sell happens, and vice versa.
How to use it: If the last signal was a "Buy", and you’re watching for a Sell, don’t act on more bullish signals. Great for systems where you only want one position open at a time
6. Bars Since Signal
What it shows: How many bars (candles) have passed since the last Buy or Sell signal.
Why it matters: Gives you context for how long the current condition has persisted
How to use it: If it says 1 or 2, a signal just happened — avoid jumping in late. If it’s been 10+ bars, a new opportunity might be brewing soon. You can use this to time exits if you want to fade a recent signal manually
Indicator Settings:
Short EMA: Sets the short-term EMA period. The smaller the number, the more reactive and more signals you get.
Long EMA: Sets the slow EMA period. The larger this number is, the smoother baseline, and more reliable trend bases are generated.
Z-Score Lookback: The period or bars used for mean & std deviation of spread between short and long EMAs. Larger values result in smoother signals with fewer false positives.
Volatility Window: This value normalizes the spread by historical volatility. This allows you to prevent scale distortion, showing you a cleaner and better chart.
Correlation Lookback: How many periods or how far back to test correlation between slow and long EMAs. This filters out false positives when EMAs lose alignment.
Hurst Lookback: The multiplier to approximate stationarity. Lower leads to more sensitivity to regime change, higher produces a more stricter filtering.
Z Threshold Percentile: This value sets how extreme Z-score must be to trigger a signal. For example, 90 equals only top/bottom 10% of extremes, 80 = more frequent.
Min Bars Between Signals: This hard stop prevents back-to-back signals. The idea is to avoid over-trading or whipsaws in volatile markets even when Hurst lookback and volatility window values are not enough to filter signals.
Some More Recommendations:
We recommend trying different EMA pairs (10/50, 21/100, 5/20) for different asset behaviors. You can set percentile to 85 or 80 if you want more frequent but looser signals. You can also use the Z-score reversion monitor for powerful confirmation.

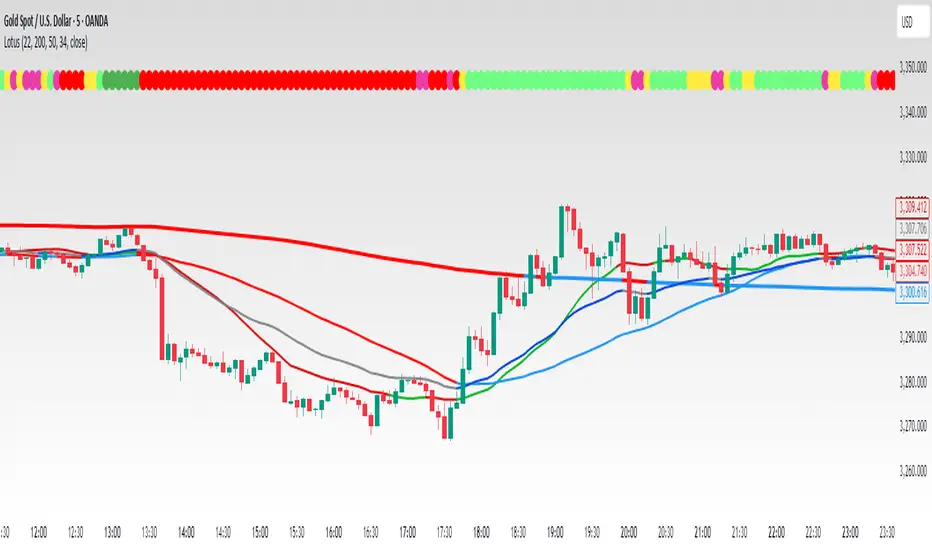
LotusThis Pine Script is designed to plot multiple moving averages (SMA and EMA) on the chart, with dynamic color changes based on whether the price is above or below each moving average. The script includes customizable inputs for different SMA and EMA lengths, and each moving average has its own color scheme, which changes depending on the market price's position relative to the moving average.
Features:
Multiple Moving Averages:
SMA (Simple Moving Average) SELL: Configured with a default length of 22. This moving average is used for determining the "SELL" zone, and its color changes based on price action.
SMA (Simple Moving Average) CONTROL: Configured with a default length of 200. This moving average is a longer-term trend indicator used as a "control" reference. It’s color changes as well depending on price action.
SMA (Simple Moving Average) BUY: Configured with a default length of 50. This moving average acts as the "BUY" zone, where color changes help signal when price is above or below this moving average.
EMA (Exponential Moving Average): Configured with a default length of 13, which reacts more quickly to price changes compared to SMA. It’s plotted but hidden by default.
Dynamic Color Changes: Each moving average has two color states:
When the price is above the moving average, the color shifts to a positive tone, signaling potential buy signals.
When the price is below the moving average, the color turns negative, signaling potential sell or warning zones.
Colors used are:
SMA SELL: Green when above, Red when below.
SMA CONTROL: Blue when above, Red when below.
SMA BUY: Blue when above, Red when below.
EMA: Dark tone when above, Blue tone when below.
Customizable Inputs:
SMA 22 (SELL), SMA 200 (CONTROL), SMA 50 (BUY), and EMA 13 can be adjusted via the input panel to suit different trading strategies.
Source for calculations: The default source for all calculations is the close price.
Plotting and Visibility:
The SMA 22 and EMA 13 are hidden by default but can be revealed as per user preferences.
The SMA 200 and SMA 50 are visible by default for comparison.
How the Script Works:
Color Logic:
The moving averages are colored based on the position of the price relative to the moving average:
Green (Up trend): Price is above the moving average.
Red (Down trend): Price is below the moving average.
Blue (Neutral): For the SMA 50 and EMA, price is either neutral or ranging.
Dynamic Indicators:
The SMA SELL (22) helps traders spot short-term selling opportunities when the price is below this line.
The SMA CONTROL (200) helps gauge the long-term trend and acts as a control line.
The SMA BUY (50) is considered a neutral or buy zone, where the price is seen as more favorable for buying when above the line.
The EMA 13 reacts quickly to price changes, providing faster signals for traders looking for a more dynamic approach.
How to Use:
Trend Confirmation: Use the SMA 200 (Control line) for long-term trend confirmation.
Entry and Exit:
Buy: Look for price above the SMA 50 (BUY) and the SMA 22 (SELL) showing an uptrend.
Sell: Watch for price below the SMA 50 (BUY) or SMA 22 (SELL) indicating a possible downtrend or a selling opportunity.
EMA 13: Acts as a faster, more responsive trend indicator that can be used for shorter time-frame trades.
Example:
SMA SELL (22): The green line suggests potential buying opportunities when the price is above it. The red line suggests possible selling when the price is below.
SMA CONTROL (200): This acts as the primary trend indicator. If the price is above this, the long-term trend is bullish. If the price is below, the long-term trend is bearish.
SMA BUY (50): When the price is above this line, it indicates a favorable buying zone. When the price is below it, it suggests a potential bearish move.
EMA 13: Often used for short-term trades, especially when the price is moving quickly either above or below it.
Customization:
You can adjust the lengths of the SMA SELL, SMA CONTROL, SMA BUY, and EMA based on your personal strategy or trading style.
Modify the colors of each moving average line to better suit your chart preferences.
This script is suitable for traders looking to combine trend-following and short-term trading strategies using moving averages. It allows for an adaptable approach with visual cues based on the price's relationship with key moving averages.