Rogue ORB PRORogue ORB Pro is a precision-engineered Opening Range Breakout (ORB) indicator built for active intraday traders who need real signals, not noise.
This tool identifies high-probability breakout entries from the opening range, enhanced with optional ATR-based stop loss levels, deviation targets, cooldown filters, and a relative volume gate to filter weak setups.
🔍 Key Features:
Opening Range High/Low: Drawn from a user-defined time window and locked for the day
Deviations: Automatically plots target zones above and below the OR range (e.g. 1, 2 deviations)
Pre-Market Levels: Automatically draws pre market high and low lines at the end of pre market session
Buy/Sell Signals: Triggered on breakout of the OR High/Low with configurable breakout logic (touch or close)
ATR Stop Loss Line: Dynamically drawn at a fixed ATR distance from breakout candle, with optional SL label
Cooldown Period: Prevents back-to-back signals by enforcing a user-defined bar delay between entries, can help with overtrading
Volume Filter: Optional relative volume filter that requires breakout candles to exceed a custom volume threshold
VWAP Overlay: Visual VWAP for directional bias and confluence
Moving Averages

Oil/gas ratio MAOil/Gas Ratio-Based Equivalent Price
This indicator calculates the gas-equivalent price based on the current oil price and a defined oil/gas ratio. It helps identify relative overvaluation or undervaluation of natural gas compared to oil.
Features:
- Choose between a static or dynamic (SMA-based) oil/gas ratio
- Displays the fair value of gas derived from oil prices
- Works with any oil ticker symbol (e.g. BRENT, USOIL, etc.)
Useful for traders analyzing intermarket relationships and looking for relative value signals between energy commodities.

Liquidity Sweep with EMAThis Pine Script indicator helps traders identify potential market reversals based on liquidity sweeps, where the price moves through the previous candle's low or high and then closes above or below the previous candle's wick. These are often seen as significant market moves or liquidity grabs before a potential reversal or continuation.
The indicator is also equipped with an EMA (Exponential Moving Average) as an optional visual aid to give traders a sense of the prevailing trend, though it is not used as part of the signal generation logic.
Key Features:
Liquidity Sweep Detection:
Bullish Sweep: Triggered when the current candle sweeps below the low of the previous candle and then closes above the high of the previous candle. This indicates a potential market reversal to the upside after the liquidity sweep.
Bearish Sweep: Triggered when the current candle sweeps above the high of the previous candle and then closes below the low of the previous candle. This indicates a potential market reversal to the downside after the liquidity sweep.
EMA:
The EMA (50) is plotted on the chart for visual trend guidance. While it is not used to confirm the signals, it can help traders see if the market is in a general uptrend or downtrend.
Signal Presentation:
Buy Signal: The indicator will plot a green upward arrow below the candle when a bullish liquidity sweep is detected.
Sell Signal: The indicator will plot a red downward arrow above the candle when a bearish liquidity sweep is detected.
Timeframe Filter:
The indicator only generates signals on the following timeframes: 30-minute, 1-hour, 4-hour, and Daily. This helps to ensure the sweeps are significant and likely to result in meaningful price moves.
Alerts:
Alerts can be set up for both bullish and bearish sweep signals, so traders can be notified when these events occur.
Customizable:
EMA Length: The length of the Exponential Moving Average (EMA) can be adjusted. By default, it is set to 50, but you can modify this to fit your trading strategy.
Show EMA Option: You can toggle whether or not to display the EMA line on the chart.
How It Works:
The indicator looks for price action patterns where the current candle sweeps through the high or low of the previous candle and closes beyond the previous wick.
These patterns are often seen as potential traps, where the price initially moves in one direction (sweeping the liquidity) and then quickly reverses, making them important for traders who want to catch reversals or breakouts after a liquidity sweep.
The EMA (50) gives a general trend direction but doesn't directly affect the trade signals. It serves as a visual reference for trend analysis.
Potential Use Cases:
Reversal Trading: Traders can use this indicator to catch reversals after a liquidity sweep. The green upward arrows may indicate a bullish reversal, while the red downward arrows may indicate a bearish reversal.
Trend Trading: The EMA can help traders gauge the overall market trend. If the price is above the EMA, the market may be in an uptrend, and traders may focus on bullish sweeps. Conversely, if the price is below the EMA, the market may be in a downtrend, and traders may focus on bearish sweeps.
Confirmation with Other Indicators: Although the EMA is not used to confirm signals in this script, it can be combined with other indicators (like RSI, Volume, or MACD) to enhance the accuracy of your trades.
Final Thoughts:
This script is designed to identify liquidity sweeps and price reversals based on price action alone, without relying on complex indicators. The optional EMA serves as a helpful tool for understanding the overall market trend. It’s ideal for traders looking to spot potential reversal points after significant price sweeps and is suitable for multiple timeframes (30m, 1h, 4h, Daily).
You can use this description to help potential users understand the functionality of your indicator when publishing it on TradingView or selling it as an invite-only script. Let me know if you need any adjustments or further details!
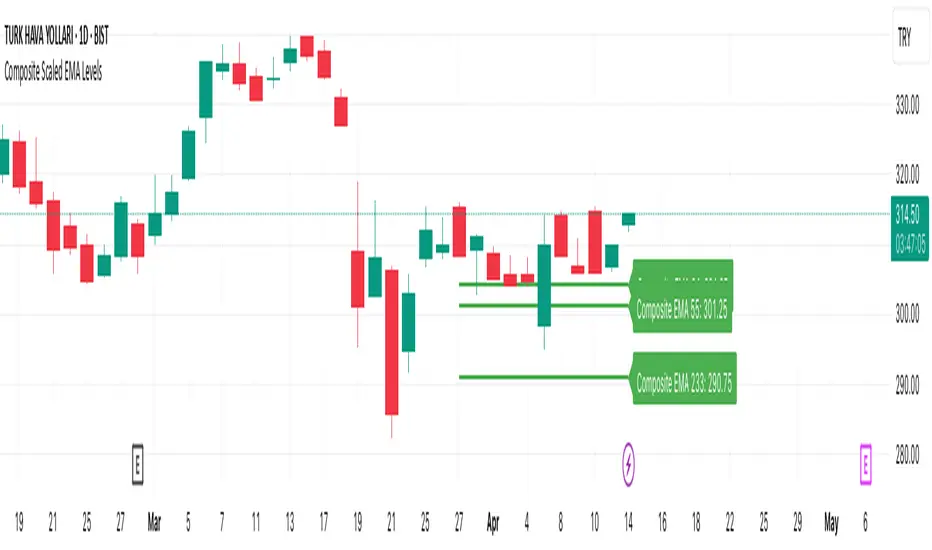
Composite Scaled EMA LevelsComposite Scaled EMA Levels Indicator
This TradingView Pine Script indicator calculates a “composite EMA” that compares the closing price of the current asset with that of the XU100 index and scales the EMA values to the XU100 level. It then visualizes these computed levels as horizontal lines on the chart with corresponding labels.
Key Components:
Inputs and Data Retrieval:
Length Input: The user defines a parameter length (default is 10) which determines over how many bars the horizontal line is drawn.
Data Collection:
The daily closing price of the current symbol (current_close) is retrieved using request.security().
The daily closing price of the XU100 index (xu100) is also retrieved.
A ratio is computed as current_close / xu100. This ratio serves as the basis for calculating the composite EMAs.
EMA Calculations:
The indicator computes Exponential Moving Averages (EMAs) on the ratio for specific periods.
In the provided version, the script calculates EMAs for three periods (34, 55, and 233), though you can easily expand this to other periods if needed.
Each computed EMA (for instance, EMA34, EMA55, EMA233) is then scaled by multiplying it with the XU100 index’s close, converting it to a price level that is meaningful on the chart.
Drawing Horizontal Lines:
Instead of using the standard plot() function, the script uses line.new() to draw horizontal lines representing the scaled EMA values over the last “length” bars.
Before drawing new lines, any existing lines and labels are deleted to ensure that only the most current values are shown.
Adding Labels to Lines:
The script creates a label for each EMA using label.new(), placing the label at the current bar (i.e., the rightmost position on the chart) using label.style_label_left so that the text appears to the right of the line.
The label displays the name of the composite EMA (e.g., "Composite EMA 34") along with its current scaled value.
Visualization:
The horizontal lines and labels provide a visual reference for the composite EMA levels. These lines help traders see critical support/resistance levels derived from the relationship between the current asset and the XU100 index.
Colors are assigned for clarity (for example, the EMA lines in this version use green).
Summary:
The Composite Scaled EMA Levels indicator is designed to help traders analyze the relationship between an asset’s price and the broader market index (XU100) by calculating a ratio and then applying EMAs on that ratio. By scaling these EMAs back to price levels and displaying them as horizontal lines with clear labels on the chart, the indicator offers a visual tool to assess trend direction and potential support or resistance levels. This can assist in making informed trading decisions based on composite trend analysis.
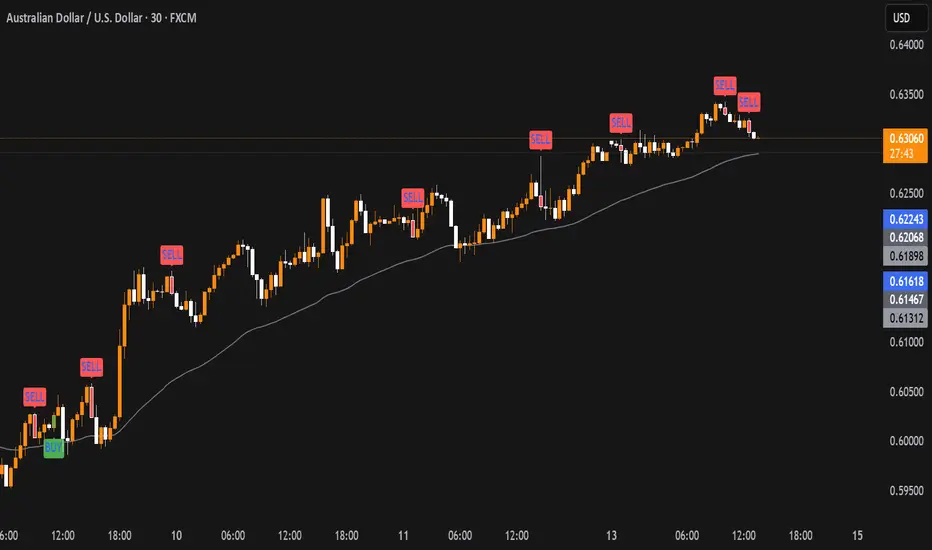
MTF RSI & SMA Crossover [OB/OS Filtered Signals]MTF RSI & SMA Crossover
This custom indicator combines the power of Multi-Timeframe (MTF) RSI, Simple Moving Average (SMA), and overbought/oversold (OB/OS) conditions to provide precise buy and sell signals based on the crossovers of the RSI and its SMA. The indicator includes the following features:
MTF RSI: The Relative Strength Index (RSI) is calculated on a customizable timeframe, giving traders the ability to analyze price momentum across different timeframes.
SMA of RSI: The RSI is smoothed using a Simple Moving Average (SMA), helping to filter out market noise and identify clearer trend reversals.
Overbought/Oversold Filter: Signals are only triggered when the RSI has been in an overbought (above 70) or oversold (below 30) condition, improving the reliability of potential trend reversals.
Buy/Sell Signals:
Buy signals occur when the RSI crosses above its SMA after being oversold, indicating potential upward momentum.
Sell signals occur when the RSI crosses below its SMA after being overbought, indicating potential downward momentum.
Customizable Label Colors: Choose your own colors for the "BUY" and "SELL" labels to match your chart's design and preferences.
Alerts: Set alerts for buy and sell signals, ensuring you don't miss a potential trade.
This indicator is ideal for traders who want to capture trend reversals and momentum shifts while filtering out false signals by using overbought and oversold conditions. Customize the settings to suit your trading style and strategy.

Trap Zone 2 minTrap Zone 2 Min — Visual Detection of Trap and Expansion Zones
This indicator is designed to clearly identify key price zones on lower timeframes, particularly the 2-minute chart. It's ideal for scalpers and intraday traders looking for structured, high-probability setups.
Trap Zone (No Trade Zone)
A central shaded area where trading is discouraged.
Marks potential liquidity traps or manipulation zones.
Calculated using recent highs, lows, and moving averages (MA20 and MA200).
Zones + and -
Positioned two times the size of an EB (Elephant Bar) above and below the trap zone.
Represent the first expansion level.
Useful for identifying potential long or short entries based on price breakout direction.
Zones ++ and --
Extend from the first + or - level to the next line outward.
Represent a second expansion layer, often aligning with price continuation or reaction zones.
Helpful for profit-taking or adjusting risk.
Zones +++ and ---
The most extreme levels plotted.
Serve as final take-profit areas or potential reversal zones.
Additional Features
Optional display of MA20 and MA200.
Configurable ADR (Average Daily Range) labels.
Full visual customization for better chart integration.
Best For
Scalpers and intraday traders.
Identifying and reacting to structured market zones.
Mapping price expansions and potential reversal points.

ScalpSwing Pro SetupScript Overview
This script is a multi-tool setup designed for both scalping (1m–5m) and swing trading (1H–4H–Daily). It combines the power of trend-following , momentum , and mean-reversion tools:
What’s Included in the Script
1. EMA Indicators (20, 50, 200)
- EMA 20 (blue) : Short-term trend
- EMA 50 (orange) : Medium-term trend
- EMA 200 (red) : Long-term trend
- Use:
- EMA 20 crossing above 50 → bullish trend
- EMA 20 crossing below 50 → bearish trend
- Price above 200 EMA = uptrend bias
2. VWAP (Volume Weighted Average Price)
- Shows the average price weighted by volume
- Best used in intraday (1m to 15m timeframes)
- Use:
- Price bouncing from VWAP = reversion trade
- Price far from VWAP = likely pullback incoming
3. RSI (14) + Key Levels
- Shows momentum and overbought/oversold zones
- Levels:
- 70 = Overbought (potential sell)
- 30 = Oversold (potential buy)
- 50 = Trend confirmation
- Use:
- RSI 30–50 in uptrend = dip buying zone
- RSI 70–50 in downtrend = pullback selling zone
4. MACD Crossovers
- Standard MACD with histogram & cross alerts
- Shows trend momentum shifts
- Green triangle = Bullish MACD crossover
- Red triangle = Bearish MACD crossover
- Use:
- Confirm swing trades with MACD crossover
- Combine with RSI divergence
5. Buy & Sell Signal Logic
BUY SIGNAL triggers when:
- EMA 20 crosses above EMA 50
- RSI is between 50 and 70 (momentum bullish, not overbought)
SELL SIGNAL triggers when:
- EMA 20 crosses below EMA 50
- RSI is between 30 and 50 (bearish momentum, not oversold)
These signals appear as:
- BUY : Green label below the candle
- SELL : Red label above the candle
How to Trade with It
For Scalping (1m–5m) :
- Focus on EMA crosses near VWAP
- Confirm with RSI between 50–70 (buy) or 50–30 (sell)
- Use MACD triangle as added confluence
For Swing (1H–4H–Daily) :
- Look for EMA 20–50 cross + price above EMA 200
- Confirm trend with MACD and RSI
- Trade breakout or pullback depending on structure

Uptrick: Stellar NexusOverview
Uptrick: Stellar Nexus is a multi-layered chart tool designed to help traders visualize market behavior with enhanced clarity and depth. It presents various overlays, signal triggers, and an asset-level behavioral table in one cohesive interface. Its core focus is to illustrate how different market states shift over time. By displaying directional structures, dynamic zones, momentum shifts, and a real-time probability assessment of multiple assets, it aims to deliver a comprehensive perspective for those looking to navigate complex market environments more confidently.
Purpose
The primary purpose of Stellar Nexus is to unify several market assessment methods into a single framework, sparing users the need to rely on multiple disjointed indicators. It is especially useful for traders who value having layered signals, interactive overlays, and a quick reference to asset-specific metrics within one tool. By consolidating multiple market insights, the script aspires to reduce guesswork, limit information overload, and present clear triggers for potential trade opportunities or risk management decisions.
Originality
Stellar Nexus stands out because it relies on a proprietary set of logic layers, each carefully designed to detect nuanced shifts in price movement. The script brings forward a streamlined depiction of underlying market changes through color-coded zones, shape markers, and short textual tags. Its architecture also accommodates multiple “modes” of viewing the market—be it through layered cloud structures, trend ribbons, or step-based overlays—so traders can adapt its outputs to match changing conditions. The presence of a specialized probability table and a real-time market state meter (HUD Meter) further underscores its uniqueness, providing at-a-glance scoring for various instruments and a gauge that visually displays ongoing transitions from trending to ranging phases.
Inputs
Stellar Nexus includes several user-configurable settings, organized into themed groups. Each input subtly modifies how information is derived or rendered on the chart:
General
Silken Veil (integer input) : Governs how smooth or responsive various underlying signals will appear.
Canvas (dropdown) : Chooses the primary visual overlay style among Nebula Trail, Velora, or Stellar Stepfilter.
Signals (dropdown) : Selects which built-in signal engine (Fluxor or Flowgen) is responsible for painting buy and sell markers.
Nova Tension (integer input) : Influences the internal motion sensitivity used by certain triggers.
Astral Ribbon (integer input) : Imparts a broader directional bias layer that can highlight whether the current environment is bullish or bearish.
Bands
Phase Delay (integer input) : Impacts baseline offsets for certain dynamic band calculations.
Band Softener (float input) : Creates a blended baseline, balancing two distinct smoothing techniques.
Spread Factor (float input) : Scales how wide or narrow the generated envelope bands become.
Layer Offset (float input) : Adjusts spacing between multiple layered boundaries in the band structure.
Smooth Mode (dropdown boolean) : Toggles an extra layer of smoothing on or off for the plotted envelopes.
Feed Matrix
Burst (integer input) : Adjusts how the Flowgen engine interprets momentum buildup. Higher values generally lead to more conservative signals.
Delta Curve Sync (integer input) : Alters the sensitivity of directional alignment within the Flowgen system, refining how quickly the script adapts to market slope changes.
Lambda Pulse Shift (integer input) : Controls timing offsets within the Flowgen structure, subtly influencing the trigger timing of transitions.
Sync Drift Limit (integer input) : Provides a stabilizing effect on the internal motion detection engine, helping reduce erratic behavior during choppy conditions.
WMA Open Filter Tunnel (integer input) : Filters signal validity by applying a dynamic range check on opening price structures, reducing false positives in unstable markets.
Probability Table
Show Predictability Table (boolean) : Enables or disables a table of asset metrics.
Show Numeric Values (boolean) : Switches between displaying numeric values and using simple directional markers in the table cells.
Stepfilter
Sensitivity (dropdown) : Offers a range of speed profiles (Very Fast to Very Slow and TURTLE option) that define how quickly or slowly the step-based overlay reacts to price changes.
HUD Meter
Show Stellar HUD Meter (boolean) : Turns on or off a specialized gauge for quick insight into trending vs. ranging conditions.
Take Profit Signals
Show TP Signals (boolean) : Determines whether exit or take-profit markers are displayed after certain conditions have been met.
Phase Length (integer input) : Influences the internal baseline used for the exit signal logic.
Sync Channel (integer input) : Sets a period within which different data points are compared or synced.
Filter (integer input) : Imposes an additional smoothing on exit-related cues.
Features
Signals (Fluxor and Flowgen)
Fluxor
Logic: Fluxor focuses on detecting specific price transitions, validating them against an internal directional and momentum layer, and then confirming the move based on the script’s overarching market bias.
Visual Representation: When Fluxor is activated, up and down label markers (“▲+” or “▼+”) appear at points the system regards as noteworthy transitions. These do not guarantee trades but are designed to guide users on when buying or selling pressure may have intensified or reversed.
How It Helps: Fluxor is streamlined for those who want simpler, clearer triggers that factor in both trend alignment and short-term motion shifts. This option is more for mean reversion traders.
Flowgen
Logic: Flowgen employs a slightly more sophisticated approach that evaluates multiple “environmental layers,” including structural alignment, directional slope checks, and distinct open-state filters.
Visual Representation: When Flowgen senses a valid transition, it prints discrete up and down markers, much like Fluxor, but triggered by different, multi-layer considerations.
How It Helps: Flowgen caters to traders who desire more emphasis on layered agreement—where multiple aspects of the market must line up before a signal is shown. This option is more for trend following traders.
Overlays (Nebula Trail, Velora, Stellar Stepfilter)
Nebula Trail
Purpose: This indicator employs dynamic, color-coded bands around price action to illustrate prevailing market bias and track which side—bulls or bears—wields greater influence, aligning with a trend-following approach.
Usage: This indicator creates outer and inner “band” regions that can function as potential support or resistance in alignment with market momentum. In bullish phases, the cloud below price acts as a supportive barrier, whereas during bearish conditions, the cloud above price provides a point of resistance. When a bearish signal is detected, traders may enter short positions on a price bounce off this band and then exit when subsequent take-profit cues appear, effectively leveraging the band for both entry and exit strategies.
Velora
Purpose: Extends the concept of band visualization into layered “tiers,” giving a more fine-grained view of how price transitions from one band to another.
Representation: Zones are subdivided into multiple steps, each with distinct shading. As the script’s internal logic detects shifts between bullish or bearish conditions, these layered bands expand or contract to reflect changing momentum.
Usage: Velora subdivides zones into multiple steps, each featuring distinct shading. As the script's internal logic detects shifts between bullish or bearish conditions, these layered bands expand or contract, signaling changes in momentum. When price enters the upper band, especially if the HUD meter shows less definitive momentum, it may hint at a non-trending environment; conversely, in a bearish scenario, the lower band can act as potential support. Narrower bands often point to an impending breakout, while wider bands can suggest a possible reversion in price. Velora is well-suited for traders wanting to see more intermediate zones where the market may hesitate or show partial confirmation—ideal for refined entries or exits.
Smooth:
Choppy:
Stellar Stepfilter
Purpose: Focuses on a persistent directional line that only updates when the script’s logic deems a genuine shift is taking place.
Representation: A single line plots on the chart to represent the “locked” direction. During periods of noise or indecision, this line may remain static, reducing false signals. Optionally, bars can be recolored to reflect bullish or bearish states.
Usage: Traders who prefer a minimalistic, stand-back approach often select Stellar Stepfilter for its ability to filter out choppy conditions and highlight clearer momentum strides. When the line remains flat—particularly in the very slow or “turtle” mode—it signals a ranging market, offering valuable insight into periods of reduced volatility. In TURTLE mode, bars are recolored green or orange to reflect locked trend direction more visibly. TURTLE mode offers the most conservative setting within the Stepfilter engine, emphasizing stability and clarity by reacting only to the strongest directional conditions and visually reinforcing its state through bar coloring.
Very Fast
Very Slow
TURTLE Mode
Probability Table
Description: The Probability Table is displayed on the top-right corner (by default). It automatically fetches data for a handful of assets (in this case, five popular cryptocurrencies), then scores each asset on multiple behavioral metrics. By default, the Probability Table monitors SOL, BTC, ETH, BNB, and XRP from Binance.
Metrics Explained:
HV: Suggests how the asset’s price is fluctuating relative to a standard reference.
ATR/Vol: A ratio that provides insight into volatility compared to trading activity.
WBR: Compares candle wicks against their bodies to gauge the frequency of price swings outside an open-close range.
Liq Clust: Indicates if there are pockets of stable or unstable liquidity.
Momentum: Observes shifts in buying or selling pressure.
PRI: Shows a baseline measure of how far price has deviated from a certain average over time.
Final Verdict: Based on each metric’s reading, an overall classification emerges: Predictable, Moderate, or Chaotic.
How It Helps: Traders can quickly scan this table to see if an asset’s environment is “Predictable” (potentially more structured), “Moderate” (balanced or transitional), or “Chaotic” (unstable and riskier). Each cell can optionally show either numeric approximations or simple “up/down” arrows to reduce clutter.
Non Numeric Values
Numeric Values
Stellar HUD Meter
Description: Located at the top center of the chart, this horizontal gauge toggles between “Trending” and “Ranging,” representing how firmly price is locked in directional expansion versus sideways hesitation.
Mechanics (General): The gauge increments or decrements over time, smoothing out abrupt shifts. A pointer slides across the meter, indicating whether conditions are leaning more toward persistent momentum or uncertain, choppy movement.
How It Helps: This immediate visual feedback helps traders decide if momentum strategies or mean-reversion approaches are more suitable at a given moment, avoiding reliance on guesswork alone.
Take Profit Signals
Description: After any buy or sell trigger occurs (either through Fluxor or Flowgen), the script can flag up to three potential exit points.
Trigger Logic (General): These exits appear when certain internal checks sense that short-term upside or downside pressure may be waning.
Representation: Small markers (“X”) appear near the top or bottom of the candle.
How It Helps: Rather than passively holding a position, these optional signals remind traders of possible exhaustion points. If they choose to follow them, it can help secure partial or full profits during a trend.
Why more than one indicator?
Having more than one internal indicator engine allows Stellar Nexus to adapt to different market behaviors and personal trading styles. Sometimes traders require swift, high-frequency triggers (Fluxor). Other times, they prefer more layered agreement before taking a position (Flowgen). Similarly, each overlay—Nebula Trail, Velora, and Stellar Stepfilter—offers a distinct method for visualizing price action. Markets are dynamic, and no single representation is ideal for all conditions. By blending multiple approaches into one script, Stellar Nexus provides flexibility: a user can switch between sets of signals or overlays based on market phase, personal risk preference, or the timeframe being traded.
Additional Features
Alert System: Built-in alerts for every trigger or state change ensure that traders can receive real-time notifications, even when away from the chart. The alert system includes buy/sell triggers, trend shifts, overlay transitions, take-profit points, and predictability status changes across monitored assets.
Selective Visibility: Users can enable or disable various modules—Probability Table, HUD Meter, Take Profit Signals—to keep their chart interface uncluttered.
State Persistence: Certain modules “lock in” their reading until a strong reason emerges to change it, which can help minimize false flips in volatile conditions.
Tailored Aesthetics: Color choices and label styling are curated to be visually distinct, reducing confusion when multiple signals or overlays occur simultaneously.
Conclusion
Uptrick: Stellar Nexus is a comprehensive, multi-layer script that merges aesthetic clarity with functional depth. It combines diverse overlays, signal engines, probability analyses, and a heads-up market meter into one cohesive tool. By handling trending vs. ranging states, evaluating asset predictability, and offering selective take-profit cues, it serves as a versatile companion for traders who want organized, visually intuitive guidance. Its originality is found not only in how it disguises internal computations, but in the ease with which users can cycle through different overlays and signals to suit changing market conditions. As always, personal due diligence, market awareness, and risk management remain essential. Stellar Nexus simply provides a refined canvas on which to read and interpret price action more confidently.
Disclaimer
This indicator is provided solely for informational and educational purposes. It does not constitute investment advice or a recommendation to engage in any trading activities. Trading and investing in financial markets involve significant risk, and past performance is not indicative of future results. Always conduct your own research, utilize proper risk management, and consider consulting a qualified financial professional before making any investment decisions. Neither the creator nor any contributors to this script accept any liability for financial losses or damages arising from its use. Users of this indicator assume full responsibility for their trading activities.

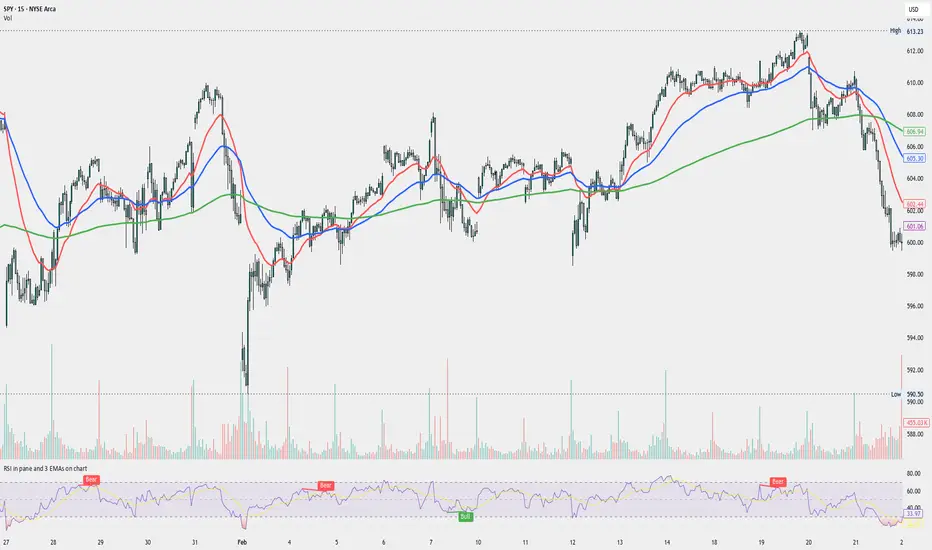
RSI in pane and 3 EMAs on chartCustom RSI in Pane + 3 EMAs on Chart — with Optional RSI Divergence Detection
Combines RSI in a separate pane with 3 EMAs on the chart and optional RSI-based divergence detection. Useful for analyzing both momentum and trend structure.
Features
RSI Pane
Custom RSI calculation (not built-in ta.rsi) with adjustable source and length
Overlay optional moving average (SMA, EMA, SMMA/RMA, WMA, VWMA, or Bollinger Bands) Overbought/oversold gradient fill for visual clarity (70 / 30 zones)
Midline (50) for neutral RSI territory
RSI Divergence Detection
Optional: toggle on/off with one input
Regular Bullish Divergence : Price makes a lower low, RSI makes a higher low
Regular Bearish Divergence : Price makes a higher high, RSI makes a lower high
Customizable lookback for pivot detection
Visual markers and labels plotted on RSI
Built-in alert conditions for both divergence types
3 EMA Trend Indicators on Price Chart
Three customizable EMAs (default: 20, 50, 200)
Color-coded and clearly plotted on main chart
Use to determine short/mid/long-term trend bias
No repainting or smoothing artifacts
Why use this script?
Gives a full view of trend + momentum without cluttering the main price chart, and it helps confirm entries and exits by observing RSI behavior alongside EMAs. The optional divergence detection can act as a signal for potential exhaustion or reversal (not entry signals on their own). It is a Good fit for traders who use RSI zones, divergences, and EMA structure in their decision-making, both for intra-day and swing trades (where it performs best).
How to use
Add this script to your chart. EMAs will appear on the main price chart; RSI and divergence will appear in a separate pane.
Adjust RSI and MA settings to fit your trading style (e.g., fast RSI for scalping, slower for swing)
Enable "Show Divergence" if you want visual alerts and markers
Use alerts to get notified when a divergence occurs without watching the chart
Always check the divergences on different time frames to validate the setup, and do not consider them valid on small time frames (<15 minutes).
Built for traders who want both momentum and trend context in a single tool — without clutter, repainting, or noise. I created this script to streamline my own analysis and avoid switching between multiple indicators. It's not meant to be a "signal generator" but a visual assistant for making better decisions. If you find it useful or have feedback, feel free to reach out.
Win-Loss Streak PlotterWin-Loss Streak Plotter
This indicator tracks the win/loss streaks of moving average crossovers (using simple moving averages for illustration purposes). It calculates the price change after each crossover, marking each as a win (green) or loss (red). The win rate is shown separately.
Inputs:
Source: Price series (default: open)
Fast MA: Fast moving average (default: open)
Slow MA: Slow moving average (default: open)
Total Crosses to Analyze: Number of crossovers to track
Crosses per Row: Number of crossovers per row in the table
Output:
A table displays each crossover’s result (win/loss).
A separate win rate table shows the percentage of wins.
Suggestions are always welcomed!

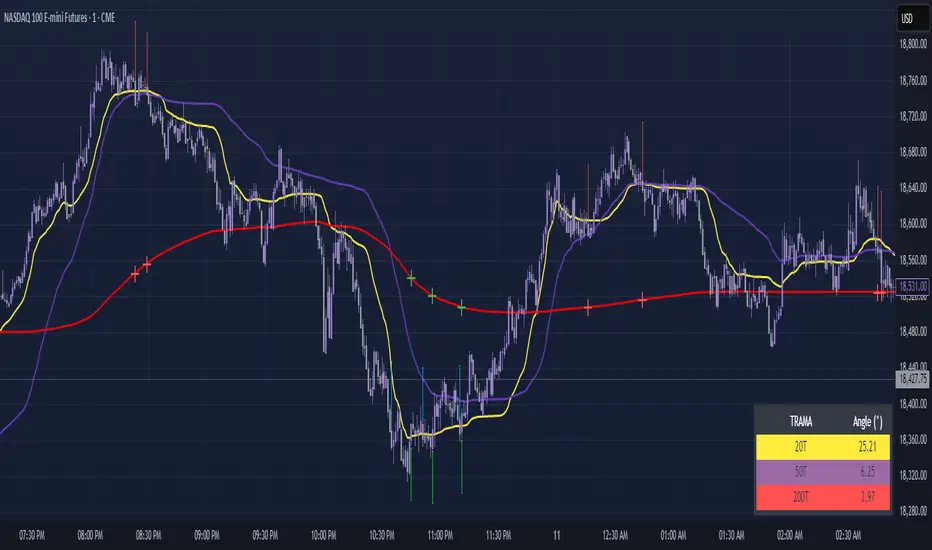
Thunderbird Volcano & Waterfall SignalsThe Thunderbird Volcano & Waterfall signal Indicator is a strategy that incorporates the use of Price Action and TRAMA positioning to determine entry and exit points. There are 3 scenarios in which the indicator will signal an entry and exit if applicable. Keep in mind the suggested entry and exit points must be taken as consideration; further confirmations such as TRAMA pointing down or up, market structure, IFVG, etc. should be used in order for a successful trade.
Scenario 1 (SHORT) is the Thunderbird Volcano setup, TRAMA alignment is in accordance with the Volcano setup; A red arrow above will indicate entry when a candle closes below the 20T and a red cross will indicate the potential target at the 200T.
Scenario 2 (SHORT) is the Thunderbird Waterfall setup, TRAMA alignment is in accordance with the Waterfall setup; A blue arrow above will indicate entry when a candle closes below all 3 TRAMAs after corresponding position is established. Target is not indicated and can vary according to user specification.
Scenario 3 (LONG) is the Inverse Volcano setup, TRAMA alignment is in accordance with the Inverse Volcano setup. A green arrow will indicate entry below when a candle closes above the 20T and a green cross will indicate the potential target at the 200T.
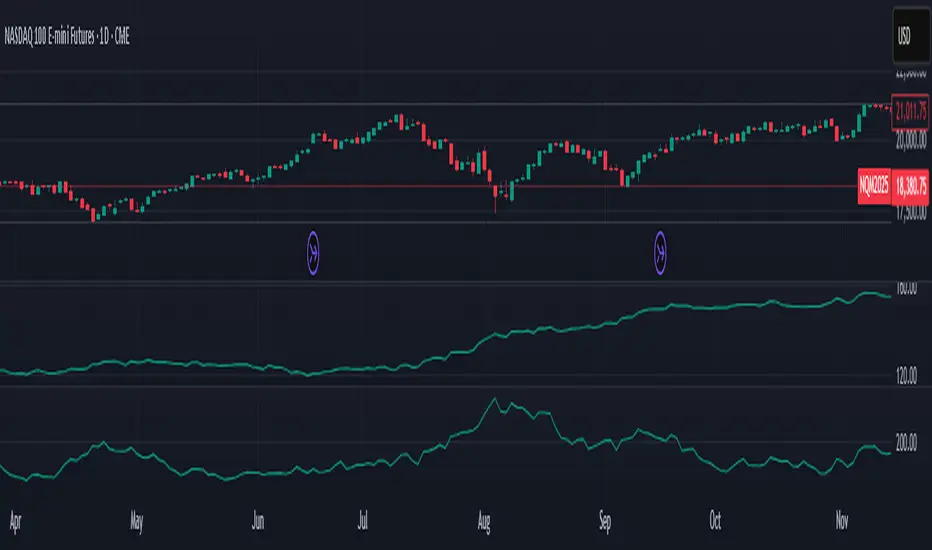
ES1! vs ZB1! Exponentially Weighted CorrelationES1! vs ZB1! Exponentially Weighted Correlation
This indicator calculates and visualizes the exponentially weighted correlation between the S&P 500 E-mini futures (ES1!) and the 30-Year U.S. Treasury Bond futures (ZB1!) over a user-defined lookback period. By using an exponential moving average (EMA) approach, it emphasizes recent price movements, providing a dynamic view of the relationship between these two key financial instruments.
Features:
- Customizable Inputs: Adjust the lookback length (default: 60) and alpha (default: 0.1) to fine-tune the sensitivity of the correlation calculation.
- Exponentially Weighted Correlation: Measures the strength and direction of the relationship between ES1! and ZB1! prices, with more weight given to recent data.
- Visual Clarity: Displays correlation as colored bars (green for positive, red for negative) for quick interpretation, with reference lines at 0, +1, and -1 for context.
- Non-Overlay Design: Plotted in a separate panel below the chart to avoid cluttering price data.
How It Works:
The indicator fetches closing prices for ES1! and ZB1!, applies an EMA to smooth the data, and computes the exponentially weighted covariance and variances. The correlation is then derived and plotted as a histogram, helping traders identify whether the two markets are moving together (positive correlation), in opposite directions (negative correlation), or independently.
Use Cases:
- Market Analysis: Gauge the relationship between equity and bond markets to inform trading strategies.
- Risk Management: Monitor correlation shifts to adjust portfolio exposure.
- Intermarket Insights: Identify trends or divergences in the stock-bond dynamic for macroeconomic analysis.
Ideal for traders and analysts tracking intermarket relationships, this indicator offers a clear, responsive tool for understanding ES1! and ZB1! correlation in real-time.

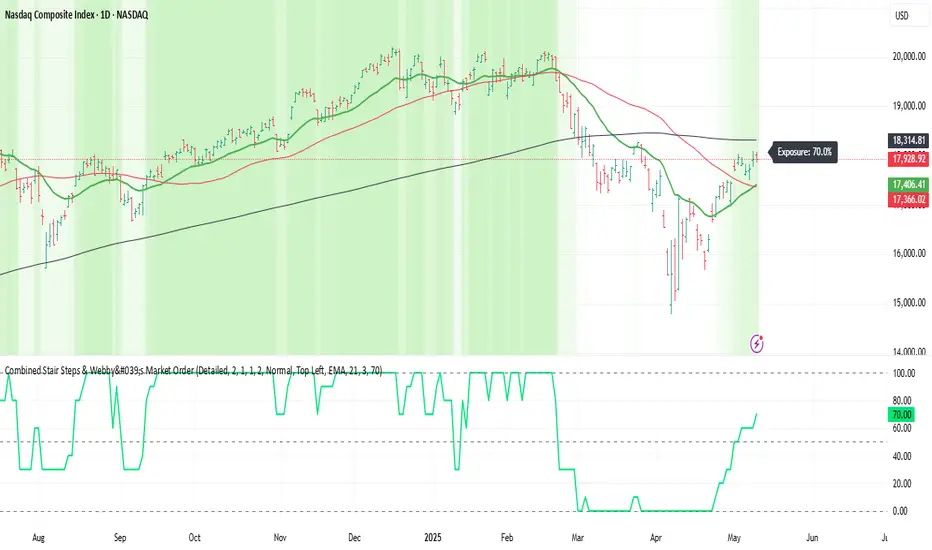
Webby's Market OrderThis is visual representation of Webby's Market Order.
When three consecutive lows are above 21 EMA, Uptrend expectation is natural.
When three highs are below 21 EMA, Downtrend expectation is natural.
Alert Conditions can be set when uptrend and down trend are expected.
Use this indicator with IXIC or SPY or major indices.
This is set at three lows/Highs above 21 EMA as looked by Mike Webster.
Average Body RangeThe Average Body Range (ABR) indicator calculates the average size of a candle's real body over a specified period. Unlike the traditional Average Daily Range (ADR), which measures the full range from high to low, the ABR focuses solely on the absolute difference between the open and close of each bar. This provides insight into market momentum and trading activity by reflecting how much price is actually moving from open to close , not just in total.
This indicator is especially useful for identifying:
Periods of strong directional movement (larger body sizes)
Low-volatility or indecisive markets (smaller body sizes)
Changes in trend conviction or momentum
Customization:
Length: Number of bars used to compute the average (default: 14)
Use ABR to enhance your understanding of price behavior and better time entries or exits based on market strength.
Visualisation tendancesThis script allows you to visualize the current trend of a financial asset.
It has two colors:
- Green for bullish phases
- Red for bearish phases
This allows you to instantly position yourself in the direction of the trend.
It also integrates Bollinger Bands, a volatility indicator.
This allows you to display two different indicators in a single indicator.

Multi-timeframe Moving Average Overlay w/ Sentiment Table🔍 Overview
This indicator overlays selected moving averages (MA) from multiple timeframes directly onto the chart and provides a dynamic sentiment table that summarizes the relative bullish or bearish alignment of short-, mid-, and long-term moving averages.
It supports seven moving average types — including traditional and advanced options like DEMA, TEMA, and HMA — and provides visual feedback via table highlights and alerts when strong momentum alignment is detected.
This tool is designed to support traders who rely on multi-timeframe analysis for trend confirmation, momentum filtering, and high-probability entry timing.
⚙️ Core Features
Multi-Timeframe MA Overlay:
Plot moving averages from 1-minute, 5-minute, 1-hour, 1-day, 1-week, and 1-month timeframes on the same chart for visual trend alignment.
Customizable MA Type:
Choose from:
EMA (Exponential Moving Average)
SMA (Simple Moving Average)
DEMA (Double EMA)
TEMA (Triple EMA)
WMA (Weighted MA)
VWMA (Volume-Weighted MA)
HMA (Hull MA)
Adjustable MA Length:
Change the length of all moving averages globally to suit your strategy (e.g. 9, 21, 50, etc.).
Sentiment Table:
Visually track trend sentiment across four key zones (Hourly, Daily, Weekly, Monthly). Each is based on the relative positioning of short-term and long-term MAs.
Sentiment Symbols Explained:
↑↑↑: Strong bullish momentum (short-term MAs stacked above longer-term MAs)
↑↑ / ↑: Moderate bullish bias
↓↓↓: Strong bearish momentum
↓↓ / ↓: Moderate bearish bias
Table Customization:
Choose the table’s position on the chart (bottom right, top right, bottom left, top left).
Style Customization:
Display MA lines as standard Line or Stepline format.
Color Customization:
Individual colors for each timeframe MA line for visual clarity.
Built-in Alerts:
Receive alerts when strong bullish (↑↑↑) or bearish (↓↓↓) sentiment is detected on any timeframe block.
📈 Use Cases
1. Trend Confirmation:
Use sentiment alignment across multiple timeframes to confirm the overall trend direction before entering a trade.
2. Entry Timing:
Wait for a shift from neutral to strong bullish or bearish sentiment to time entries during pullbacks or breakouts.
3. Momentum Filtering:
Only trade in the direction of the dominant multi-timeframe trend. For example, ignore long setups when all sentiment blocks show bearish alignment.
4. Swing & Intraday Scalping:
Use hourly and daily sentiment zones for swing trades, or rely on 1m/5m MAs for precise scalping decisions in fast-moving markets.
5. Strategy Layering:
Combine this overlay with support/resistance, RSI, or volume-based signals to enhance decision-making with multi-timeframe context.
⚠️ Important Notes
Lower-timeframe values (1m, 5m) may appear static on higher-timeframe charts due to resolution limits in TradingView. This is expected behavior.
The indicator uses MA stacking, not crossover events, to determine sentiment.

Michael's EMA (Selectable TF) by Koenigsegg📌 Michael’s EMA (Selectable TF) by Koenigsegg
A multi-timeframe EMA crossover trend tool for clear market direction.
🔍 CORE LOGIC & PURPOSE
This indicator visualizes the trend based on two Exponential Moving Averages (EMAs) — fast and slow — from a user-defined timeframe.
Referencing a higher timeframe strengthens the trend signal and reduces the noise from short-term volatility.
Perfect for traders seeking cleaner entries and exits , especially those who get faked out by lower timeframe chop.
✅ KEY FEATURES
1. Multi-Timeframe EMA Calculation
- Fetches EMAs from any timeframe using `request.security()`.
- Selecting a higher timeframe makes signals more meaningful and decisive .
2. Customizable EMAs
- Small EMA (default: 12) and Big EMA (default: 21).
- Clear logic:
- Uptrend = Small EMA ≥ Big EMA
- Downtrend = Small EMA < Big EMA
3. Dynamic Trend Coloring
- EMAs change color based on the trend:
- Uptrend: Green (customizable)
- Downtrend: Red (customizable)
4. Crossover Detection & Arrows
- Clean visual arrows on trend flips only.
- Optional visibility, customizable size & color.
- Built with a debounce mechanic to avoid spam signals.
5. Built-In Alerts
- Trend Up Alert when fast EMA crosses above slow EMA.
- Trend Down Alert when fast EMA crosses below slow EMA.
- Compatible with automation, bots, and manual strategies.
⚠️ PRO TIP
Using a higher timeframe (e.g., 1H on a 15m chart, or 15m on a 5m chart as visually represented on the chart) makes trend flips more decisive and reliable, helping you avoid being faked out by short-term volatility. When the higher TF flips red — that’s your true trend shift, not just noise.
🏷️ HASHTAGS
#EMA #MovingAverage #MultiTimeframe #TrendIndicator #TradingViewScript #TradingTools
#TechnicalAnalysis #PriceAction #ForexTrader #CryptoTrader #StockTrader
#AlgoTrading #TrendFlip #SmartMoney #SwingTrading #DayTrading #MarketStructure #TradingEdge #ProfMichaelG #Koenigsegg #Bitcoin
⚠️ DISCLAIMER
This script is provided for educational and informational purposes only .
It does not constitute financial advice , investment advice, or a recommendation to buy or sell any financial instruments.
Always do your own research and consult with a licensed financial advisor before making any trading decisions.
Use this tool at your own risk.

MultiTF Trigger 999 - Multi-Timeframe VersionMultiTF Trigger 999 – Multi-Timeframe Entry + Exit Assistant
This script provides high-confidence trade signals based on synchronized conditions across multiple timeframes (5m, 15m, 30m, 1H). It is designed to help traders identify breakout entries supported by momentum, structure, and confirmation across layers of the market.
🟢 Entry Signal:
The script generates a strong buy trigger only when all monitored timeframes align under a custom scoring system. A built-in cooldown prevents signal overuse and overtrading.
🔴 Exit Signal:
Includes a 5-minute MACD-based divergence detector to warn of potential local tops for take-profit or de-risking decisions.
🧠 Visual Aids:
Signal markers
Price label annotations
Multi-timeframe scoring tooltip for transparency
Built-in alerts for automation
This is a powerful tool for traders seeking precise timing in trend continuation setups.

Guntavnook Katta - Price Action PROOverview:
This script is designed to provide traders with a structured, multi-layered view of market behavior. It combines three key components - trend direction analysis, oscillator-based pattern recognition, and projected candle visualization - to help identify meaningful setups and anticipate potential price movements. Additionally, it includes an automated system for plotting multi-level support and resistance zones using swing logic, making it valuable for both discretionary traders and those developing rule-based or semi-systematic frameworks.
Purpose:
The primary purpose of this tool is to empower traders with a structured, multi-dimensional analysis tool that combines both quantitative signals and visual interpretation. Rather than relying on fixed indicators or static strategies, this script allows users to understand the evolving nature of price action through a lens of historical behavior, oscillator dynamics, and market trend context.
It is especially useful for traders who value context-driven decision making - those who prefer to look beyond raw signals and study the sequence of conditions that preceded past price moves, enabling them to better anticipate future possibilities.
Core Logic:
The script brings together three independently developed analytical engines, each built on custom logic and refined through real-market application. Unlike traditional tools that rely on fixed indicator crossovers or rigid rules, this script focuses on pattern dynamics, contextual interpretation, and forward-looking structure - giving it a distinct edge in adapting to different market conditions.
Trend Engine (Volatility-Adjusted Slope Framework):
A moving average alone doesn't reveal much - it’s the slope of the moving average compared against a volatility-normalized threshold that gives meaning. This engine calculates the SMA slope across a user-defined window and dynamically adjusts the threshold using ATR-based volatility. The result: a more adaptive classification of trend into Uptrend, Downtrend, or Sideways, designed to reduce noise and align with real momentum shifts.
Pattern Detection Engine (Zone-Based Signature Matching):
Rather than comparing raw oscillator values, this system maps them into discrete behavioral zones, then tracks their sequential patterns. The most recent pattern is then scanned across historical data to detect exact zone signatures - a method that captures rhythm and structure rather than simple threshold breaks. When a match is found, the script projects what happened next by scaling and rendering those historical candles as projected candle visuals on the current chart - offering a clear and proportionate view of possible price behavior.
Support & Resistance Engine (Tiered Swing-Based Projection):
This module detects significant turning points using user-defined swing lengths, and automatically extends multi-level support and resistance zones (1x, 2x, 3x) into the future. These levels are not based on arbitrary highs/lows, but on tiered confirmation across timeframes, making them highly useful for anticipating potential reaction zones in both trending and consolidating phases.
Together, these components work in sync to offer a layered, context-rich view of price behavior - allowing traders to make better-informed decisions, whether they’re seeking confirmation, confluence, or clarity.
This script is not a signal generator - it is a decision-support tool that allows traders to study market structure in a deeper, more structured way.
It helps answer three essential trading questions:
* What is the current market trend?
* Have similar oscillator-based patterns occurred before, and what followed?
* Where are the likely support and resistance zones based on recent swings?
Key Functional Blocks:
1 - Trend Analysis Using SMA Slope Logic
The script calculates a Simple Moving Average (SMA) over a user-defined period. It compares the slope of this SMA over a second window of candles.
The slope is measured as a percentage and compared against a dynamic threshold derived from price volatility (using ATR).
The market is categorized into:
Uptrend
Downtrend
Sideways
This classification appears in a dedicated trend table at the top-right of the chart, along with the selected oscillator and relevant settings.
2 - Oscillator Pattern Matching Engine
You can select from a variety of studies:
RSI
CCI
Stochastic
Ultimate Oscillator
Money Flow Index
Chande Momentum Oscillator
Relative Volatility Index
The selected oscillator values are converted into different zones. The system continuously monitors the recent pattern of these zones and checks if it matches any past sequence.
Once a historical match is detected:
A message appears in the trend table confirming a match.
The script then activates the projected candle visualization, showing how price behaved after that historical pattern.
3 - Projected Candle Visualization Engine
This feature helps you visualize how price moved historically after a matching oscillator pattern.
How it works:
It retrieves the actual candles that followed the matching pattern in history.
These candles are then scaled relative to the current price to maintain proportional movement.
Candles are drawn using box objects to replicate historical price bars with visual clarity.
Candle color logic is based on oscillator zone at that moment in history -
Green: When the selected oscillator was in an overbought zone (e.g., RSI > 70)
Red: When the selected oscillator was in an oversold zone (e.g., RSI < 30)
Gray: When the selected oscillator was in a neutral zone
This lets traders see:
What happened previously after a similar condition
The general path price followed
Where potential turning points or continuation zones may lie
4 - Multi-Level Dynamic Support & Resistance
Support and resistance levels are drawn based on swing highs and lows across three levels:
You enter an initial swing length (e.g., 10 candles)
The system calculates:
Swing 2 = 2x
Swing 3 = 3x
From there, the indicator detects recent high/low turning points and draws horizontal lines that extend into the future:
R1, R2, R3 (if available) for resistance
S1, S2, S3 (if available) for support
This creates a forward-looking price structure, helping you prepare for reaction zones.
Example Use Cases
Intraday Traders (Best suited for lower timeframes):
This script is particularly effective for intraday traders operating on lower timeframes. It identifies repeating oscillator zone patterns that often precede short-term price movements. When a historical match is found, the projected candles display how price moved in similar situations, offering an immediate visual reference for possible price behavior. Combined with dynamically generated support and resistance zones, the tool adds structure to fast-paced decision-making — helping traders define entries, exits, and stop placements more confidently.
While lower timeframes offer the best responsiveness, the script can be applied across other intraday intervals depending on trading style.
Positional Traders (Best suited for higher timeframes):
For positional traders, this script provides a powerful framework to evaluate whether the current setup mirrors past conditions that led to extended moves. The projected candles show how price evolved after similar oscillator patterns in the past, allowing traders to assess potential directional strength. The trend classification engine and swing-based support/resistance zones further assist in planning position entries, managing holding periods, and identifying key structural levels.
Although higher timeframes offer deeper context for positional trading, the tool remains effective across other multi-day or weekly views as well.
Disclaimer
This script is intended for educational and informational purposes only. It does not provide any form of investment advice, trade recommendations, or performance guarantees. All tools and projections included are meant to support learning and market analysis.
The word “PRO” in the script title refers to a professional-grade analytical tool and should not be interpreted as a claim of profitability or advisory capability.
This script has been developed for use within structured educational environments and is not intended to function as a trading signal or advisory service. Please consult a qualified financial advisor or licensed professional before making any investment decisions.

Heiken Ashi Supertrend ADXHeiken Ashi Supertrend ADX Indicator
Overview
This indicator combines the power of Heiken Ashi candles, Supertrend indicator, and ADX filter to identify strong trend movements across multiple timeframes. Designed primarily for the cryptocurrency market but adaptable to any tradable asset, this system focuses on capturing momentum in established trends while employing a sophisticated triple-layer stop loss mechanism to protect capital and secure profits.
Strategy Mechanics
Entry Signals
The strategy uses a unique blend of technical signals to identify high-probability trade entries:
Heiken Ashi Candles: Looks specifically for Heiken Ashi candles with minimal or no wicks, which signal strong momentum and trend continuation. These "full-bodied" candles represent periods where price moved decisively in one direction with minimal retracement. These are overlayed onto normal candes for more accuarte signalling and plotting
Supertrend Filter: Confirms the underlying trend direction using the Supertrend indicator (default factor: 3.0, ATR period: 10). Entries are aligned with the prevailing Supertrend direction.
ADX Filter (Optional) : Can be enabled to focus only on stronger trending conditions, filtering out choppy or ranging markets. When enabled, trades only trigger when ADX is above the specified threshold (default: 25).
Exit Signals
Positions are closed when either:
An opposing signal appears (Heiken Ashi candle with no wick in the opposite direction)
Any of the three stop loss mechanisms are triggered
Triple-Layer Stop Loss System
The strategy employs a sophisticated three-tier stop loss approach:
ATR Trailing Stop: Adapts to market volatility and locks in profits as the trend extends. This stop moves in the direction of the trade, capturing profit without exiting too early during normal price fluctuations.
Swing Point Stop: Uses natural market structure (recent highs/lows over a lookback period) to place stops at logical support/resistance levels, honoring the market's own rhythm.
Insurance Stop: A percentage-based safety net that protects against sudden adverse moves immediately after entry. This is particularly valuable when the swing point stop might be positioned too far from entry, providing immediate capital protection.
Optimization Features
Customizable Filters : All components (Supertrend, ADX) can be enabled/disabled to adapt to different market conditions
Adjustable Parameters : Fine-tune ATR periods, Supertrend factors, and ADX thresholds
Flexible Stop Loss Settings : Each of the three stop loss mechanisms can be individually enabled/disabled with customizable parameters
Best Practices for Implementation
[Recommended Timeframes : Works best on 4-hour charts and above, where trends develop more reliably
Market Conditions: Performs well across various market conditions due to the ADX filter's ability to identify meaningful trends
Performance Characteristics
When properly optimized, this has demonstrated profit factors exceeding 3 in backtesting. The approach typically produces generous winners while limiting losses through its multi-layered stop loss system. The ATR trailing stop is particularly effective at capturing extended trends, while the insurance stop provides immediate protection against adverse moves.
The visual components on the chart make it easy to follow the strategy's logic, with position status, entry prices, and current stop levels clearly displayed.
This indicator represents a complete trading system with clearly defined entry and exit rules, adaptive stop loss mechanisms, and built-in risk management through position sizing.

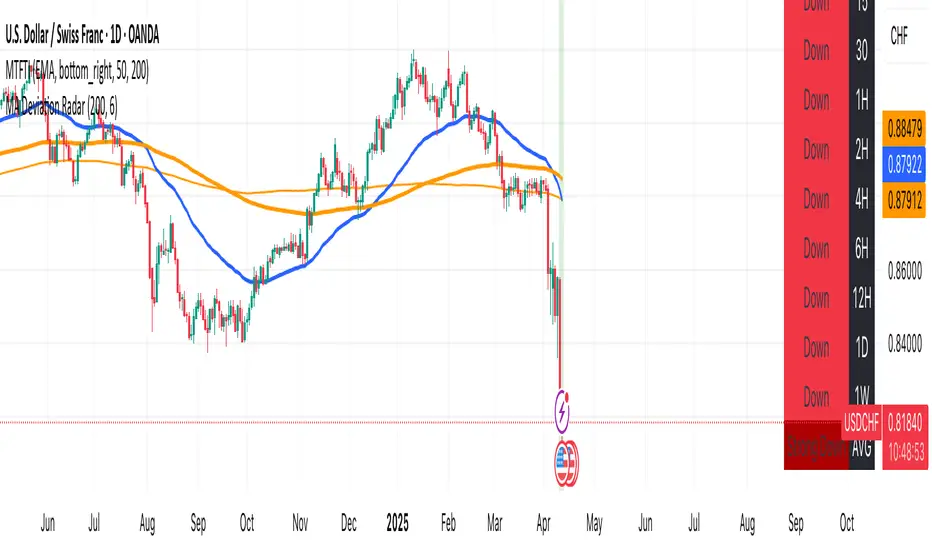
MA Deviation// -----------------------------------------------------------------------------
// MA Deviation Marking & Alert (MA Divergence)
// -----------------------------------------------------------------------------
// Short Title: MA Deviation Radar
// Author: zhipeng luo
// Version: 1.0
// Date: 2025-04-11
// -----------------------------------------------------------------------------
// Overview:
// This indicator identifies and highlights price bars where the closing price
// deviates significantly from its Simple Moving Average (SMA) by a user-defined
// percentage. It visually marks these bars on the chart and provides
// configurable alert conditions for threshold breaches.
//
// How it Works:
// 1. Calculates the Simple Moving Average (SMA) based on the 'MA Period' input.
// 2. Computes the percentage deviation of the closing price from the SMA value.
// Formula: `((Close - SMA) / SMA) * 100`
// 3. Compares the calculated deviation percentage against the positive and
// negative 'Threshold (%)' input values.
// 4. Marks the background of the price bars when a threshold is exceeded:
// - Red Background: Price deviation is greater than the positive threshold.
// - Green Background: Price deviation is less than the negative threshold.
// 5. Includes an optional, non-visible plot of the MA line itself.
// 6. Offers three distinct alert conditions for automation and notifications.
//
// Features:
// - Customizable Simple Moving Average period.
// - Adjustable deviation threshold percentage.
// - Clear visual signals using background colors on the main chart.
// - Built-in Alert Conditions:
// - MA Positive Deviation Alert (Triggers when price > MA + Threshold %)
// - MA Negative Deviation Alert (Triggers when price < MA - Threshold %)
// - MA Deviation Alert - Any (Triggers on either positive or negative breach)
//
// How to Use:
// - Identify Potential Extremes: Useful for spotting potential overbought (large
// positive deviation) or oversold (large negative deviation) conditions
// which might precede price corrections or mean reversion.
// - Gauge Trend Extension: Extreme deviations can sometimes indicate that a
// trend is overextended and might be due for a pause or reversal.
// - Parameter Tuning: Adjust the 'MA Period' and '(Threshold %)' settings to
// suit the specific asset, timeframe, and volatility characteristics you
// are analyzing. Lower thresholds yield more signals; higher thresholds
// focus on more significant deviations.
// - Alerts: Set up alerts via the TradingView alert menu using the provided
// conditions ("MA Positive Deviation Alert", "MA Negative Deviation Alert",
// "MA Deviation Alert - Any") to get notified of potential setups.
//
// Parameters:
// - MA Period (Default: 200): The lookback period for the SMA calculation.
// - (Threshold %) (Default: 7.0): The percentage deviation (positive and
// negative) from the MA required to trigger a background signal and alert.
//
// Alerts & Important Note:
// Three alert conditions corresponding to the signals are available:
// 1. "MA Positive Deviation Alert"
// 2. "MA Negative Deviation Alert"
// 3. "MA Deviation Alert - Any"
//
// ***Please Note:*** The value shown after "( {{plot_0}}%)" or
// "( {{plot_0}}%)" in the default alert message refers to the
// **Moving Average value** (`plot_0`), not the actual deviation percentage.
// The alert *triggers correctly* based on the deviation percentage crossing
// the threshold, but the number displayed by the `{{plot_0}}` placeholder
// in the message is the MA's value at that time due to the script's
// internal plot order.
//
// Disclaimer: This indicator is provided for informational and analytical
// purposes only. It does not constitute financial advice or a recommendation
// to buy or sell any asset. Always conduct your own research and use proper
// risk management. Trading involves significant risk.
// -----------------------------------------------------------------------------
Leavitt Convolution ProbabilityTechnical Analysis of Markets with Leavitt Market Projections and Associated Convolution Probability
The aim of this study is to present an innovative approach to market analysis based on the research "Leavitt Market Projections." This technical tool combines one indicator and a probability function to enhance the accuracy and speed of market forecasts.
Key Features
Advanced Indicators : the script includes the Convolution line and a probability oscillator, designed to anticipate market changes. These indicators provide timely signals and offer a clear view of price dynamics.
Convolution Probability Function : The Convolution Probability (CP) is a key element of the script. A significant increase in this probability often precedes a market decline, while a decrease in probability can signal a bullish move. The Convolution Probability Function:
At each bar, i, the linear regression routine finds the two parameters for the straight line: y=mix+bi.
Standard deviations can be calculated from the sequence of slopes, {mi}, and intercepts, {bi}.
Each standard deviation has a corresponding probability.
Their adjusted product is the Convolution Probability, CP. The construction of the Convolution Probability is straightforward. The adjusted product is the probability of one times 1− the probability of the other.
Customizable Settings : Users can define oversold and overbought levels, as well as set an offset for the linear regression calculation. These options allow for tailoring the script to individual trading strategies and market conditions.
Statistical Analysis : Each analyzed bar generates regression parameters that allow for the calculation of standard deviations and associated probabilities, providing an in-depth view of market dynamics.
The results from applying this technical tool show increased accuracy and speed in market forecasts. The combination of Convolution indicator and the probability function enables the identification of turning points and the anticipation of market changes.
Additional information:
Leavitt, in his study, considers the SPY chart.
When the Convolution Probability (CP) is high, it indicates that the probability P1 (related to the slope) is high, and conversely, when CP is low, P1 is low and P2 is high.
For the calculation of probability, an approximate formula of the Cumulative Distribution Function (CDF) has been used, which is given by: CDF(x)=21(1+erf(σ2x−μ)) where μ is the mean and σ is the standard deviation.
For the calculation of probability, the formula used in this script is: 0.5 * (1 + (math.sign(zSlope) * math.sqrt(1 - math.exp(-0.5 * zSlope * zSlope))))
Conclusions
This study presents the approach to market analysis based on the research "Leavitt Market Projections." The script combines Convolution indicator and a Probability function to provide more precise trading signals. The results demonstrate greater accuracy and speed in market forecasts, making this technical tool a valuable asset for market participants.

RSI Full [Titans_Invest]RSI Full
One of the most complete RSI indicators on the market.
While maintaining the classic RSI foundation, our indicator integrates multiple entry conditions to generate more accurate buy and sell signals.
All conditions are fully configurable, allowing complete customization to fit your trading strategy.
⯁ WHAT IS THE RSI❓
The Relative Strength Index (RSI) is a technical analysis indicator developed by J. Welles Wilder. It measures the magnitude of recent price movements to evaluate overbought or oversold conditions in a market. The RSI is an oscillator that ranges from 0 to 100 and is commonly used to identify potential reversal points, as well as the strength of a trend.
⯁ HOW TO USE THE RSI❓
The RSI is calculated based on average gains and losses over a specified period (usually 14 periods). It is plotted on a scale from 0 to 100 and includes three main zones:
Overbought: When the RSI is above 70, indicating that the asset may be overbought.
Oversold: When the RSI is below 30, indicating that the asset may be oversold.
Neutral Zone: Between 30 and 70, where there is no clear signal of overbought or oversold conditions.
⯁ ENTRY CONDITIONS
The conditions below are fully flexible and allow for complete customization of the signal.
______________________________________________________
🔹 CONDITIONS TO BUY 📈
______________________________________________________
• Signal Validity: The signal will remain valid for X bars .
• Signal Sequence: Configurable as AND/OR .
📈 RSI Conditions:
🔹 RSI > Upper
🔹 RSI < Upper
🔹 RSI > Lower
🔹 RSI < Lower
🔹 RSI > Middle
🔹 RSI < Middle
🔹 RSI > MA
🔹 RSI < MA
📈 MA Conditions:
🔹 MA > Upper
🔹 MA < Upper
🔹 MA > Lower
🔹 MA < Lower
📈 Crossovers:
🔹 RSI (Crossover) Upper
🔹 RSI (Crossunder) Upper
🔹 RSI (Crossover) Lower
🔹 RSI (Crossunder) Lower
🔹 RSI (Crossover) Middle
🔹 RSI (Crossunder) Middle
🔹 RSI (Crossover) MA
🔹 RSI (Crossunder) MA
🔹 MA (Crossover) Upper
🔹 MA (Crossunder) Upper
🔹 MA (Crossover) Lower
🔹 MA (Crossunder) Lower
📈 RSI Divergences:
🔹 RSI Divergence Bull
🔹 RSI Divergence Bear
______________________________________________________
______________________________________________________
🔸 CONDITIONS TO SELL 📉
______________________________________________________
• Signal Validity: The signal will remain valid for X bars .
• Signal Sequence: Configurable as AND/OR .
📉 RSI Conditions:
🔸 RSI > Upper
🔸 RSI < Upper
🔸 RSI > Lower
🔸 RSI < Lower
🔸 RSI > Middle
🔸 RSI < Middle
🔸 RSI > MA
🔸 RSI < MA
📉 MA Conditions:
🔸 MA > Upper
🔸 MA < Upper
🔸 MA > Lower
🔸 MA < Lower
📉 Crossovers:
🔸 RSI (Crossover) Upper
🔸 RSI (Crossunder) Upper
🔸 RSI (Crossover) Lower
🔸 RSI (Crossunder) Lower
🔸 RSI (Crossover) Middle
🔸 RSI (Crossunder) Middle
🔸 RSI (Crossover) MA
🔸 RSI (Crossunder) MA
🔸 MA (Crossover) Upper
🔸 MA (Crossunder) Upper
🔸 MA (Crossover) Lower
🔸 MA (Crossunder) Lower
📉 RSI Divergences:
🔸 RSI Divergence Bull
🔸 RSI Divergence Bear
______________________________________________________
______________________________________________________
🤖 AUTOMATION 🤖
• You can automate the BUY and SELL signals of this indicator.
______________________________________________________
______________________________________________________
⯁ UNIQUE FEATURES
______________________________________________________
Signal Validity: The signal will remain valid for X bars
Signal Sequence: Configurable as AND/OR
Condition Table: BUY/SELL
Condition Labels: BUY/SELL
Plot Labels in the Graph Above: BUY/SELL
Automate and Monitor Signals/Alerts: BUY/SELL
Signal Validity: The signal will remain valid for X bars
Signal Sequence: Configurable as AND/OR
Condition Table: BUY/SELL
Condition Labels: BUY/SELL
Plot Labels in the Graph Above: BUY/SELL
Automate and Monitor Signals/Alerts: BUY/SELL
______________________________________________________
📜 SCRIPT : RSI Full
🎴 Art by : @Titans_Invest & @DiFlip
👨💻 Dev by : @Titans_Invest & @DiFlip
🎑 Titans Invest — The Wizards Without Gloves 🧤
✨ Enjoy the Spell!
______________________________________________________
o Mission 🗺
• Inspire Traders to manifest Magic in the Market.
o Vision 𐓏
• To elevate collective Energy 𐓷𐓏
