CVD (Cumulative Volume Delta)
Cumulative Volume Delta
Use a moving average with three different
I thought about determining the volatility and direction of the price of the stock price and finding a place to break through.
I made some Mistake coz I'm new corder
I'm reposting this simple script due to house rule violation. (Whatever can haha) 😁
I'm erasing all the comments in my native language that I had in my script... I thought it would make the User uncomfortable, so I locked the code, and I thought maybe that's the problem
Anyway, I'm sorry 😅
Moving Averages

Advanced Momentum Scanner [QuantAlgo]The Advanced Momentum Scanner is a sophisticated technical indicator designed to identify market momentum and trend direction using multiple exponential moving averages (EMAs), momentum metrics, and adaptive visualization techniques. It is particularly valuable for those looking to identify trading and investing opportunities based on trend changes and momentum shifts across any market and timeframe.
🟢 Technical Foundation
The Advanced Momentum Scanner utilizes a multi-layered approach with four different EMA periods to identify market momentum and trend direction:
Ultra-Fast EMA for quick trend changes detection (default: 5)
Fast EMA for short-term trend analysis (default: 10)
Mid EMA for intermediate confirmation (default: 30)
Slow EMA for long-term trend identification (default: 100)
For momentum detection, the indicator implements a Rate of Change (RoC) calculation to measure price momentum over a specified period. It further enhances analysis by incorporating RSI readings for overbought/oversold conditions, volatility measurements through ATR, and optional volume confirmation. When these elements align, the indicator generates trading signals based on the selected sensitivity mode (Conservative, Balanced, or Aggressive).
🟢 Key Features & Signals
1. Multi-Period Trend Identification
The indicator combines multiple EMAs of different lengths to provide comprehensive trend analysis within the same timeframe, displaying the information through color-coded visual elements on the chart.
When an uptrend is detected, chart elements are colored with the bullish theme color (default: green/teal).
Similarly, when a downtrend is detected, chart elements are colored with the bearish theme color (default: red).
During neutral or indecisive periods, chart elements are colored with a neutral gray color, providing clear visual distinction between trending and non-trending market conditions.
This visualization provides immediate insights into underlying trend direction without requiring separate indicators, helping traders and investors quickly identify the market's current state.
2. Trend Strength Information Panel
The trend panel operates in three different sensitivity modes (Conservative, Aggressive, and Balanced), each affecting how the indicator processes and displays market information.
The Conservative mode prioritizes trend sustainability over frequency, showing only strong trend movements with high probability.
The Aggressive mode detects early trend changes, providing more frequent signals but potentially more false positives.
The Balanced mode offers a middle ground with moderate signal frequency and reliability.
Regardless of the selected mode, the panel displays:
Current trend direction (UPTREND, DOWNTREND, or NEUTRAL)
Trend strength percentage (0-100%)
Early detection signals when applicable
The active sensitivity mode
This comprehensive approach helps traders and investors:
→ Assess the strength of current market trends
→ Identify early potential trend changes before full confirmation
→ Make more informed trading and investing decisions based on trend context
3. Customizable Visualization Settings
This indicator offers extensive visual customization options to suit different trading styles and preferences:
Display options:
→ Fully customizable uptrend, downtrend, and neutral colors
→ Color-coded price bars showing trend direction
→ Dynamic gradient bands visualizing potential trend channels
→ Optional background coloring based on trend intensity
→ Adjustable transparency levels for all visual elements
These visualization settings can be fine-tuned through the indicator's interface, allowing traders and investors to create a personalized chart environment that emphasizes the most relevant information for their strategy.
The indicator also features a comprehensive alert system with notifications for:
New trend formations (uptrend, downtrend, neutral)
Early trend change signals
Momentum threshold crossovers
Other significant market conditions
Alerts can be customized and delivered through TradingView's notification system, making it easy to stay informed of important market developments even when you are away from the charts.
🟢 Practical Usage Tips
→ Trend Analysis and Interpretation: The indicator visualizes trend direction and strength directly on the chart through color-coding and the information panel, allowing traders and investors to immediately identify the current market context. This information helps in assessing the potential for continuation or reversal.
→ Signal Generation Strategies: The indicator generates potential trading signals based on trend direction, momentum confirmation, and selected sensitivity mode. Users can choose between Conservative (fewer but more reliable signals), Balanced (moderate approach), or Aggressive (more frequent but potentially less reliable signals).
→ Multi-Period Trend Assessment: Through its layered EMA approach, the indicator enables users to understand trend conditions across different lookback periods within the same timeframe. This helps in identifying the dominant trend and potential turning points.
🟢 Pro Tips
Adjust EMA periods based on your timeframe:
→ Lower values for shorter timeframes and more frequent signals
→ Higher values for higher timeframes and more reliable signals
Fine-tune sensitivity mode based on your trading style:
→ "Conservative" for position trading/long-term investing and fewer false signals
→ "Balanced" for swing trading/medium-term investing with moderate signal frequency
→ "Aggressive" for scalping/day trading and catching early trend changes
Look for confluence between components:
→ Strong trend strength percentage and direction in the information panel
→ Overall market context aligning with the expected direction
Use for multiple trading approaches:
→ Trend following during strong momentum periods
→ Counter-trend trading at band extremes during overextension
→ Early trend change detection with sensitivity adjustments
→ Stop loss placement using dynamic bands
Combine with:
→ Volume indicators for additional confirmation
→ Support/resistance analysis for strategic entry/exit points
→ Multiple timeframe analysis for broader market context

Advanced Volatility Activator [AlgoFuego]🔵 Advanced Volatility Activator (AVA)
The Advanced Volatility Activator (AVA) is an innovative technical analysis indicator designed to help traders identify and react to market volatility.
By blending adaptive volatility metrics with a refined moving‑average algorithm, the indicator offers traders a dynamically responsive framework for trend identification.
🔸Dynamic Volatility Analysis
The indicator examines the high and low prices of each candle to evaluate market movements.
It categorizes price movements into different states (e.g., outside bars, inside bars, higher highs, lower lows) to provide insight into market conditions, then calculates price averages for bars that make a new high or low price.
This moving average serves as a baseline for volatility adjustments, aligning the tool with well-established technical indicators.
🔸 Customizable Sensitivity
Through the input, users can fine‑tune how responsive the moving average is to price fluctuations.
A higher sensitivity setting makes the moving average less responsive to rapid market changes, enabling the indicator to adapt to different market environments and trading styles.
🔸Integrated Multi-Timeframe Table
A distinctive feature of this indicator is its integrated table display, which provides a summary signal across multiple time frames.
This table serves as a quick reference guide for traders to compare market trends across different time periods.
This at‑a‑glance view empowers traders to confirm trend direction from intraday to higher‑timeframe perspectives without switching charts.
🔹 How It Works
1. Initial Setup
The indicator defines two baseline values: the current high and the current low.
These serve as reference points for all subsequent price comparisons and moving‑average calculations.
2. Volatility Smoothing
The indicator calculates the smoothed volatility range using an exponential moving average (EMA) of the absolute differences between successive prices.
This helps smooth out the erratic price movements of the simple moving average and improves the measurement of volatility.
3. Trend Probability Calculation
A Simple Moving Average (SMA) of the combined high‑low series is calculated.
That SMA is then compared against the smoothed volatility range from step 2 to estimate how likely it is that a genuine trend is forming.
4. Directional Counters
Two counters: bullish and bearish, track consecutive moves up or down.
Whichever counter increases more rapidly signals the prevailing market bias.
5. Drawing the Trend Line
Finally, the code generates a trend line that dynamically adapts to real‑time volatility.
The result is a clear, responsive visual that mirrors actual market behavior.
🔹 Visual & Table Customization
Color Coding
Upward and downward trends are easily distinguished by customizable color settings, enhancing visual clarity for decision-making.
Upward Movements
A lighter blue hue indicates an upward trend.
Downward Movements
An orange hue indicates a downward trend.
Candlestick Highlighting
The indicator plots candlesticks with the same trendline color so that the chart maintains a consistent visual theme, thus reinforcing the signal's clarity.
Table Configuration and Customization
This additional layer of information helps traders compare signals between different time horizons, which is essential for a comprehensive multi-timeframe strategy.
The code supports multiple user-defined timeframes (e.g., 15, 60, 240, and 480 minutes).
For each timeframe, the indicator queries the market data to determine if the signal is Bullish, Bearish, or No signal.
Visibility and Positioning
The table can be toggled on or off via a user input. Its position on the chart is also customizable, ranging from top-right to bottom-left, allowing flexibility based on personal chart layouts.
Color Settings
The table cells are populated with both the timeframe labels and the corresponding market signal text (e.g., "Bullish", "Bearish", "No signal"). Background colors for each signal cell change dynamically depending on the current state, making it easy for traders to assess market sentiment at a glance.
Users can adjust colors for the background, borders, and text of the table itself.
Moreover, specific colors are set to denote bullish signals (blue), bearish signals (orange), or no signal (default dark theme).
🔹 How to use
Before entering long trades, ensure that prices are above the Advanced Volatility Activator Line and the line indicates an upward movement.
🔹 Practical Benefits
Enhanced Market Awareness
By highlighting periods of low volatility, the indicator can serve as an early warning system for potential market reversals or breakouts.
The supplementary table offers a high-level overview of these signals across multiple timeframes, which aids in confirming trends or reversals.
Customizable and Versatile
Both the indicator and the table are highly customizable. Traders can fine-tune the sensitivity, adjust periods for the moving average, select color schemes, and choose their preferred timeframes, all allowing for a tool that adapts to various trading styles and market conditions.
Intuitive Visualization
The clearly defined color-coded trendline provides an immediate visual cue, making it easier for traders to interpret market trends at a glance.
Whether you are a short-term trader needing precise entry and exit points or a multi-timeframe analyst looking for broader trend confirmation, this indicator provides valuable insights on both a micro- and macro-level.
🔹 Disclosure
While this indicator is useful and ideally suited for active traders who require precise, customizable signals to navigate rapidly changing markets, it's critical to understand that past performance is not necessarily indicative of future results, and there are many more factors that go into being a profitable trader.

Moving Average Trend ToolsI. How M.A.T.T. Adds Value to the TradingView Community:
The "Moving Average Trend Tools" (M.A.T.T.) is a versatile Pine Script v6 indicator that empowers traders with clear trend analysis, reliable trade signals, and real-time insights. Its intuitive design and robust features make it a valuable addition to the TradingView Community Scripts by catering to traders of all levels. Here’s why it stands out:
Clear Trend Visualization: M.A.T.T. plots a moving average (MA) with dynamic coloring—green for rising, red for falling, and gray for flat—based on a user-defined lookback period. This simplifies trend interpretation, helping traders quickly assess market momentum.
Reliable Trade Signals : The script identifies price crossovers above or below the MA, plotting green circles for bullish crosses and red for bearish, confirmed on closed bars to prevent repainting. These signals guide entry and exit points for trend-following or reversal strategies.
Real-Time Extension Detection : M.A.T.T. calculates percentage price deviations from the MA, displaying real-time labels when thresholds (e.g., 6%) are exceeded. This highlights overextended moves, ideal for spotting reversals or pullbacks, with alerts to keep traders informed.
Extensive Customization : Traders can tailor the MA type (SMA, EMA, WMA, HMA), length, colors, line width, and label sizes. This flexibility supports diverse strategies across markets like stocks, forex, and crypto, from scalping to swing trading.
Automated Alerts : Alert conditions for crossovers and extensions integrate seamlessly with TradingView’s system, enabling traders to stay updated without constant chart monitoring.
M.A.T.T. combines trend analysis, signal generation, and overextension detection into a single, user-friendly tool. Its accessibility, reliability, and educational value for Pine Script learners make it a compelling contribution to the community.
II. What M.A.T.T. Does, How It Works, and Its Originality:
What It Does :
M.A.T.T. enhances trend analysis and trade decision-making through three core features:
Dynamic MA Visualization: Plots a customizable MA (SMA, EMA, WMA, or HMA) with trend-based coloring to reflect rising, falling, or flat market conditions.
Price Crossover Signals : Marks bullish (green circles) and bearish (red circles) crossovers, confirmed on closed bars, with alerts for trade opportunities.
Price Extension Labels : Displays real-time percentage deviations of price from the MA, with alerts when user-defined thresholds are breached, signaling potential reversals.
How It Works :
M.A.T.T. leverages Pine Script v6 for precise calculations and user-friendly outputs:
Inputs: Users select MA type, length, lookback period, colors, and thresholds for extensions, plus label styles and sizes for customization.
MA Calculation : A switch function computes the chosen MA (e.g., ta.ema(close, 21) for EMA). Trend direction is determined using ta.rising or ta.falling over the lookback period, coloring the MA accordingly.
Crossover Logic : Bullish crossovers (close > ma and close < ma ) and bearish crossovers (close < ma and close > ma ) are plotted as circles on confirmed bars (barstate.isconfirmed) to ensure reliability. Alerts trigger only on the first bar of a crossover.
Extension Logic : Percentage deviations are calculated as ((price - ma) / ma) * 100, using the high for above-MA extensions and low for below. Labels appear in real-time when thresholds are exceeded, with alerts on transitions to avoid noise.
Why It’s Original
M.A.T.T. distinguishes itself through a unique blend of features and thoughtful design:
All-in-One Design : It integrates dynamic MA coloring, non-repainting crossover signals, and real-time extension detection, addressing trend identification, trade signals, and overextension warnings in one tool—unlike most MA indicators that focus on a single aspect.
Real-Time Extension Labels : Displaying percentage deviations with customizable thresholds is a rare feature, ideal for volatile markets and not commonly found in standard scripts.
Non-Repainting Signals : Confirmed crossover signals enhance reliability for live trading, setting M.A.T.T. apart from less rigorous indicators.
Optimized Alert Condtions : Alerts trigger only on transitions (e.g., first bar of a crossover or extension), reducing noise and improving usability.
Visual and Functional Flexibility : Support for four MA types, extensive customization, and a clean interface (dynamic colors, tiny circles, clear labels) make it adaptable and user-friendly.
While MA plotting or crossovers exist elsewhere, M.A.T.T.’s seamless integration, real-time extension detection, alert conditions, and focus on reliability and customization create a distinctive, practical tool. Its balance of simplicity and sophistication makes it a unique asset for the TradingView community.

HMA Breakdown [NLR]Hull Moving Average (HMA) is a great trend-following tool — it's smooth, fast, and more responsive than traditional MAs like EMA or SMA. But the problem?
Sometimes it gives signals that look sharp but are misleading — especially in noisy markets or when the price is chopping around.
This script breaks down the inner mechanics of the HMA to give you more context:
Are the inputs to HMA actually diverging?
Is there momentum behind the move?
Is this trend about to reverse or just a pullback?
By plotting the components of HMA — and layering signal bands, color logic, and optional trend overlays — it gives you a visual breakdown of what's really going on under the hood.
What this indicator shows
HMA Trend (Main Line)
The Hull Moving Average (HMA) is plotted in bold, colored red or green based on internal conditions (not just price slope).
WMA Components (Fast & Slow)
Shows the two WMAs used inside the HMA calculation:
WMA Half (faster) — reacts quickly to price
WMA Full (slower) — smoother, less reactive
Their difference and crossover gives you clues on whether momentum is building or fading.
Signal & Band Structure
A calculated upper band and lower band are used to track when HMA is leading or lagging momentum.
When the HMA is below the band, trend may be weakening - this helps you filter false signals.
TMA Candle (Optional Visual)
A synthetic candle shows whether the smoothed average is rising or falling compared to a few candles back.
This is a simple visual cue to spot inflection points in the trend.
EMA Trend Overlay (Optional)
A pair of short-term EMAs built on a smoothed source helps you catch micro-trends or align your entries with the bigger trend.
Can act as an early heads-up or a trend confirmation layer.
What problem it solves
Noisy Signals: Helps filter out weak or fake trend signals often seen in HMA-only systems.
Visual Breakdown: Lets you see how each component of the HMA is behaving — so you’re not flying blind.
Momentum Confirmation: Adds layered confirmation using fast-vs-slow WMA cross, signal bands, and mini trend overlays.
Best Used For:
Trend-following traders who use HMA or WMA strategies
Filtering entries/exits in momentum-based systems
Visually confirming when a trend is real vs fake

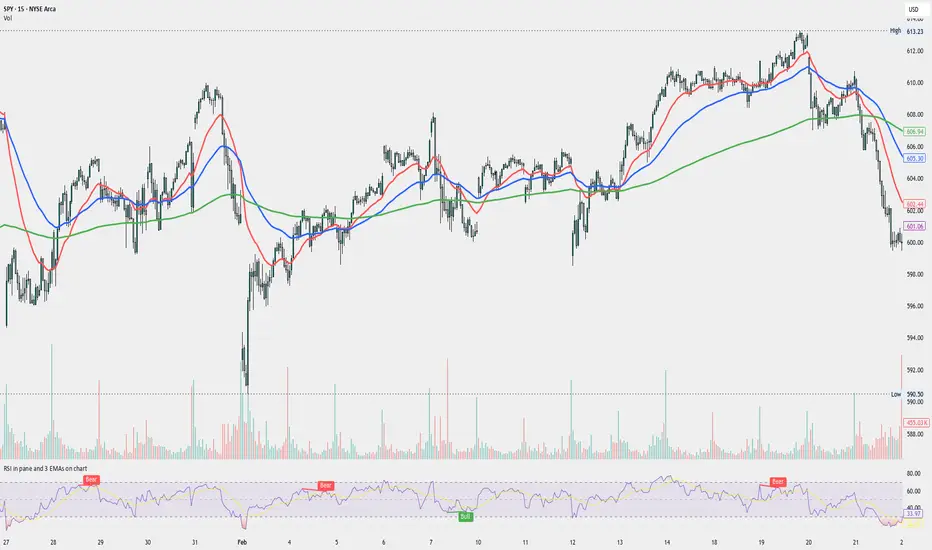
MACD Liquidity Tracker SystemMACD Liquidity Tracker System
🔹 Enhanced MACD with candle coloring, entry markers, and customizable signal logic.
🧠 Features:
This tool combines a color-coded MACD histogram with signal-based candle colors and small shape markers (🔼🔽) for clear market momentum and entry visualization.
📊 Visuals:
MACD Histogram (Sub-panel):
4 dynamic colors to show momentum direction:
🔹 Bright Blue = MACD > 0 & rising (strong bullish)
🔹 Dark Blue = MACD > 0 & falling (weakening bullish)
🔹 Bright Magenta = MACD < 0 & falling (strong bearish)
🔹 Dark Magenta = MACD < 0 & rising (weakening bearish)
Price Candles (Main Chart):
🔹 Bright Blue = Active Long signal
🔹 Bright Magenta = Active Short signal
Entry Markers:
🔼 Blue triangle (below candle) = Start of Long
🔽 Magenta triangle (above candle) = Start of Short
⚙️ System Types (select in settings):
Normal:
🔹 Long = MACD > 0
🔹 Short = MACD < 0
Fast: (Based on histogram color)
🔹 Long = Bright Blue OR Dark Magenta
🔹 Short = Dark Blue OR Bright Magenta
Safe:
🔹 Long = Only Bright Blue
🔹 Short = All other colors
🔔 Alerts:
Alerts trigger only on the first bar of a new Long/Short signal.
Easy to set up using TradingView’s alert system.
📌 How to Use:
Add the indicator to your chart
Open settings and select a System Type
Adjust MACD parameters if needed
Use histogram color + candle color for momentum and signal confirmation
Set alerts for clean entries if desired
💡 Ideal for traders seeking visual clarity and flexible MACD-based strategies.

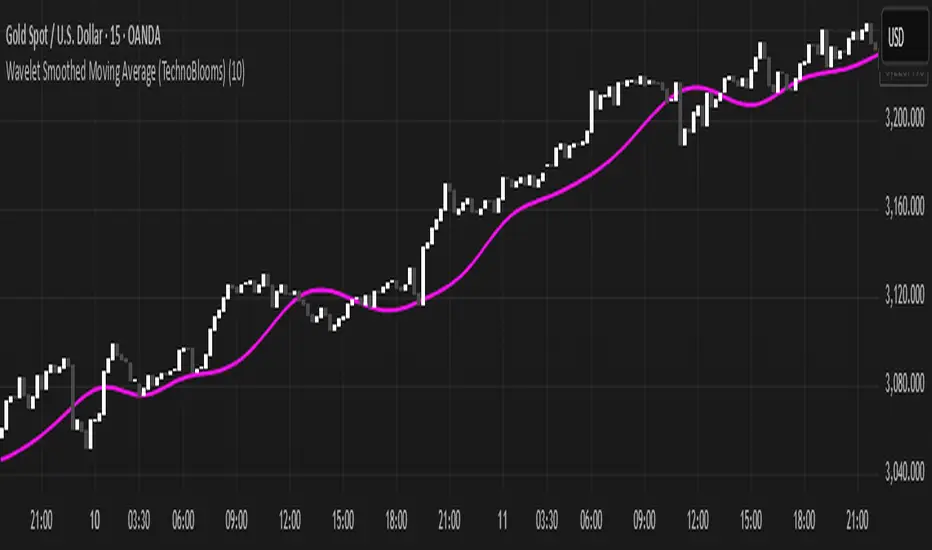
Wavelet Smoothed Moving Average (TechnoBlooms)Wavelet Smoothed Moving Average (WSMA) is a part of the Quantum Price Theory (QPT) Series of indicators.
Overview:
The Wavelet Smoothed Moving Average (WSMA) is a trend-following indicator inspired by multi-level Haar Wavelet decomposition. Rather than using traditional wavelet basis functions, it emulates the core wavelet concept of multi-resolution analysis using nested simple moving averages (SMA).
How It Works:
WSMA applies three levels of smoothing:
• Level 1: SMA on price (base smoothing)
• Level 2: SMA on Level 1 output (further denoising)
• Level 3: SMA on Level 2 output (final approximation)
Why Use WSMA:
• Multi-Level Smoothing: Captures price structure across multiple time scales, unlike single-length MAs.
• Noise Reduction: Filters out short-term volatility and focuses on the underlying trend.
• Low Lag, High Clarity: Unlike traditional moving averages that react slowly or miss subtle shifts, WSMA’s layered smoothing delivers cleaner and more adaptive trend detection.
Unique Value:
• Wavelet-Inspired Design: Mimics core wavelet decomposition logic without the complexity of downsampling or basis functions.
• Perfect for Trend Confirmation: The final line (a3) can act as a trend filter, while the detail levels can help identify momentum shifts and volatility bursts.
• Fits Into Quantum Price Theory: As part of the QPT framework, WSMA bridges scientific theory with trading application, giving traders a deeper understanding of market structure and signal compression.
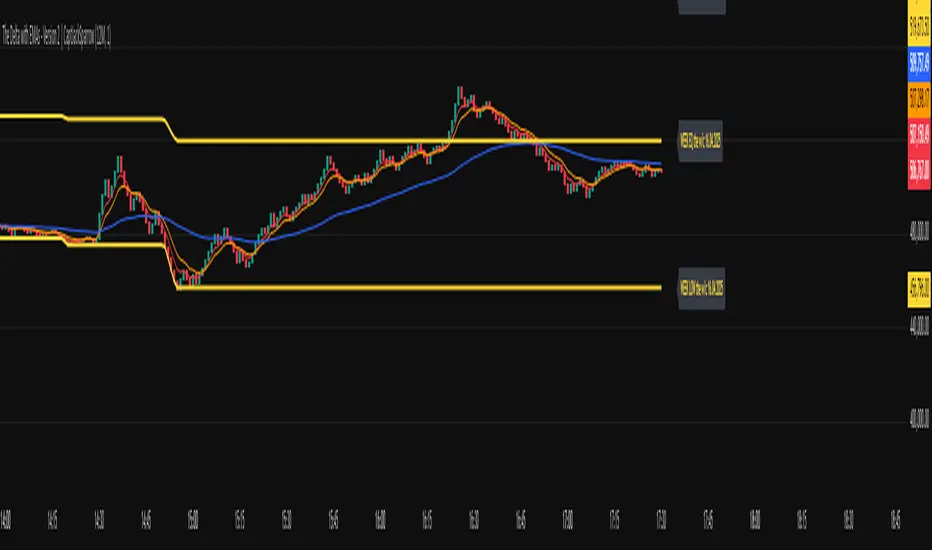
The Delta with EMAs - Version 2 | CaptJackSparrow📊 The Delta with EMAs - Version 2 16th April 25 working copy it is not finished yet!!!!!!!| CaptJackSparrow
This updated script takes your trading to the next level by merging dynamic volume delta with customizable EMAs and Fibonacci levels, all enhanced with session-based background highlights.
🧩 Cumulative Volume Delta (CVD):
Visualize market sentiment and volume flow with step-line candles, showing the tug-of-war between buyers and sellers.
Real-time tracking of volume dynamics with customizable timeframes and session-specific calculations.
📈 Exponential Moving Averages (EMAs):
EMAs (3, 5, 8, 9, 15, 24, 30, 60, 90) plotted on CVD to reveal trend direction and momentum shifts.
Customizable visibility settings for each EMA, with background coloring when the EMAs align to highlight momentum zones.
📊 Fibonacci Levels:
Overnight and New York sessions: Track the high, low, and midpoint (equilibrium) for each session to gauge market sentiment.
Weekly Fibonacci: See the high, low, and midpoint for the week, with dynamic labels updating as the week progresses.
🌍 Session Highlights:
Display colored backgrounds for New York, Overnight, Europe, Asia, and After Hours sessions, helping you identify active market periods.
Customizable start/end times for each session with visual color options.
🔔 Alerts & Visuals:
EMA crossovers and background colors help spot key momentum shifts.
Tailored alerts based on the crossover of the EMAs, helping you track potential entries or exits.
🧠 Ideal for traders who love:
Understanding market structure through volume analysis.
Using multiple session contexts for more precise trading decisions.
Anticipating breakouts or divergences with dynamic Fibonacci and EMA support.
🏴☠️ Disclaimer: This script is for educational purposes only and is not financial advice. Always trade responsibly and consider market risks.
VWAP + EMA Retracement Indicator SwiftEdgeVWAP + EMA Retracement Indicator
Overview
The VWAP + EMA Retracement Indicator is a powerful and visually engaging tool designed to help traders identify high-probability buy and sell opportunities in trending markets. By combining the Volume Weighted Average Price (VWAP) with two Exponential Moving Averages (EMAs) and a unique retracement-based signal logic, this indicator pinpoints moments when the price pulls back to a key zone before resuming its trend. Its modern, AI-inspired visuals and customizable features make it both intuitive and adaptable for traders of all levels.
What It Does
This indicator generates buy and sell signals based on a sophisticated yet straightforward strategy:
Buy Signals: Triggered when the price is above VWAP, has recently retraced to the zone between two EMAs (default 12 and 21 periods), and a strong bullish candle closes above both EMAs.
Sell Signals: Triggered when the price is below VWAP, has retraced to the EMA zone, and a strong bearish candle closes below both EMAs.
Signal Filtering: A customizable cooldown period ensures that only the first signal in a sequence is shown, reducing noise while preserving opportunities for new trends.
Confidence Scores: Each signal includes an AI-inspired confidence score (0-100%), calculated from candle strength and price distance to VWAP, helping traders gauge signal reliability.
The indicator’s visuals enhance decision-making with dynamic gradient lines, a highlighted retracement zone, and clear signal labels, all customizable to suit your preferences.
How It Works
The indicator integrates several components that work together to create a cohesive trading tool:
VWAP: Acts as a dynamic support/resistance level, reflecting the average price weighted by volume. It filters signals to ensure buys occur in uptrends (price above VWAP) and sells in downtrends (price below VWAP).
Dual EMAs: Two EMAs (default 12 and 21 periods) define a retracement zone where the price is likely to consolidate before continuing its trend. Signals are generated only after the price exits this zone with conviction.
Retracement Logic: The indicator looks for price pullbacks to the EMA zone within a user-defined lookback window (default 5 candles), ensuring signals align with trend continuation patterns.
Candle Strength: Signals require strong candles (bullish for buys, bearish for sells) with a minimum body size based on the Average True Range (ATR), filtering out weak or indecisive moves.
Cooldown Mechanism: A unique feature that prevents signal clutter by allowing only the first signal within a user-defined period (default 3 candles), balancing responsiveness with clarity.
Confidence Score: Combines candle body size and price distance to VWAP to assign a score, giving traders an at-a-glance measure of signal strength without needing external analysis.
These components are carefully combined to capture high-probability setups while minimizing false signals, making the indicator suitable for both short-term and swing trading.
How to Use It
Add to Chart: Apply the indicator to a 15-minute chart (recommended) or your preferred timeframe.
Customize Settings:
VWAP Source: Choose the price source (default: hlc3).
EMA Periods: Adjust the fast and slow EMA periods (default: 12 and 21).
Retracement Window: Set how many candles to look back for retracement (default: 5).
ATR Period & Body Size: Define candle strength requirements (default: 14 ATR period, 0.3 multiplier).
Cooldown Period: Control the minimum candles between signals (default: 3; set to 0 to disable).
Candle Requirements: Toggle whether signals require bullish/bearish candles or entire candle above/below EMAs.
Visuals: Enable/disable gradient colors, retracement zone, confidence scores, and choose a color scheme (Neon, Light, or Dark).
Interpret Signals:
Buy: A green "Buy" label with a confidence score appears below the candle when conditions are met.
Sell: A red "Sell" label with a confidence score appears above the candle.
Use the confidence score to prioritize higher-probability signals (e.g., above 80%).
Trade Management: Combine signals with your risk management strategy, such as setting stop-loss below the retracement zone and targeting a 1:2 risk-reward ratio.
Why It’s Unique
The VWAP + EMA Retracement Indicator stands out due to its thoughtful integration of classic indicators with modern enhancements:
Balanced Signal Filtering: The cooldown mechanism ensures clarity without missing key opportunities, unlike many indicators that overwhelm with frequent signals.
AI-Inspired Confidence: The confidence score simplifies decision-making by quantifying signal strength, mimicking advanced analytical tools in an accessible way.
Elegant Visuals: Dynamic gradients, a highlighted retracement zone, and customizable color schemes (Neon, Light, Dark) create a sleek, futuristic interface that’s both functional and visually appealing.
Flexibility: Extensive customization options let traders tailor the indicator to their style, from conservative swing trading to aggressive scalping.

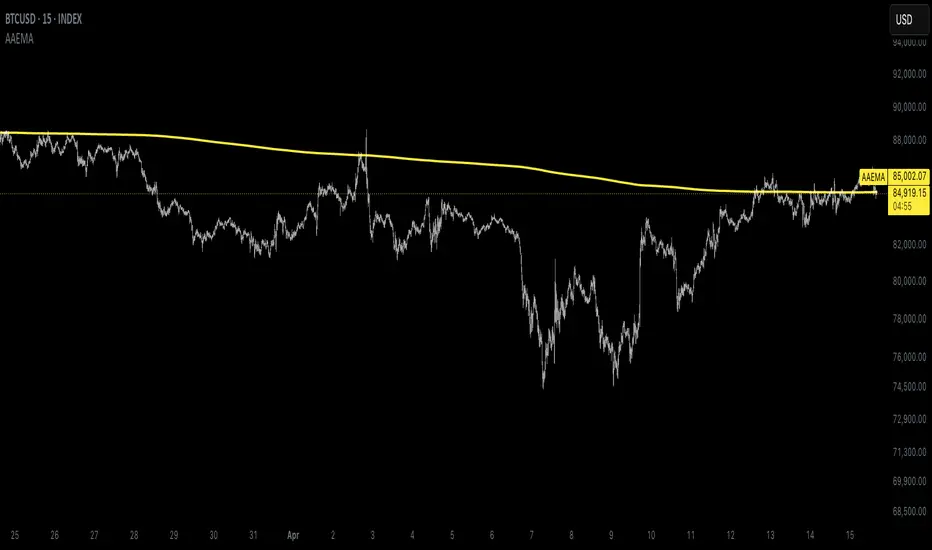
Autocorrelation Adaptive EMAThe Autocorrelation Adaptive EMA (AAEMA) is a dynamic, overlay indicator designed to adapt its smoothing period based on market conditions. It analyzes the autocorrelation of price returns to adjust the lookback window, ensuring responsiveness to changing trends while maintaining stability during consolidation. The indicator also incorporates rate-of-change (ROC) and volatility metrics to fine-tune its sensitivity, making it suitable for various timeframes and market environments. The AAEMA plots a single, smooth line over the price chart, providing a clear visual guide for trend direction without revealing proprietary calculations. Ideal for traders seeking an adaptive moving average that balances speed and reliability.
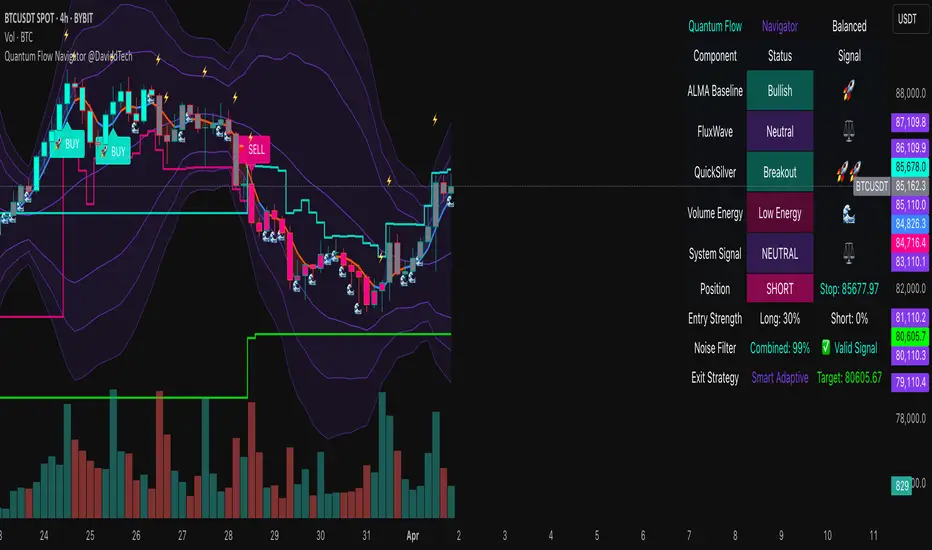
Quantum Flow Navigator @DaviddTechQuantum Flow Navigator – DaviddTech
Precision Strategy Builder Powered by Adaptive Filters, Statistical Noise Reduction & Multi-Modal Confirmation
🚀 Bullish Signal : Enter when ALMA, FluxWave, and QuickSilver all confirm bullish trend, with high volume and valid noise filter state.
🔻 Bearish Signal : Enter short when all components align bearishly and filters validate the signal.
🚪 Exit : Automatically managed by dynamic SL/TP or indicator-based reversal logic.
✅ Overview & DaviddTech Methodology
Quantum Flow Navigator is an advanced, multi-component trading system engineered around the strict modular logic of the DaviddTech methodology .
It integrates every core component required for a fully rule-based and signal-driven strategy—baseline, confirmations, volume filter, exit system, and noise filter.
Designed for traders who demand structure, clarity, and data-backed decision-making on 15M, 1H, and 4H charts.
🔍 Indicator Components
Baseline: Adaptive ALMA Filter
Smooth and responsive dynamic trend detection, with momentum validation and optional filled zones for enhanced visual feedback.
Confirmation #1: FluxWave Oscillator
Developed from an enhanced Trendlio concept by @dudeowns , FluxWave uses ALMA-smoothed rate-of-change logic with configurable signal behavior.
Confirmation #2: QuickSilver Band System
Custom breakout engine that maps volatility envelopes using multi-layered deviation bands for clear confirmation of structure breaks and trend direction.
Volume Filter: Normalized Volume Energy
Innovative volume filter inspired by @ceyhun 's work. Filters trades by classifying energy into High, Normal, or Low based on normalized volume context.
Exit System: Dynamic Momentum Stop Loss
Choose from Smart Adaptive, Trailing, Stepped, Percentage, ATR, or Volatility-adjusted logic. Supports TP via risk/reward, ATR multiples, or percentage targets.
Noise Filtration: Quantum Statistical Noise Reduction
Fuses Kalman smoothing with wavelet decomposition to eliminate non-signal noise and improve trade quality and confidence.
🎨 Visual System & Dashboard
🚀/🔻/🚪 Emoji Labels : Buy, sell, and exit trades clearly marked for instant recognition.
Color-Shifting Bars : Reflect FluxWave’s trend bias in real-time.
ALMA Fill Zone : Visual trend envelope between price and ALMA baseline.
QuickSilver Bands : Volatility envelopes with graduated depth for support/resistance awareness.
SL & TP Visuals : Dynamic stop-loss and take-profit zones plotted directly on chart.
Navigator Panel : In-chart dashboard displays real-time trend status, volume energy, noise filter state, signal strength, and active position tracking.
📈 How to Trade with It
Entry Mode Selection : Choose between Combined, ALMA, FluxWave, QuickSilver, or Custom scoring logic.
Final Signals : Trigger only when confirmations align, volume energy is valid, and noise is low.
Dashboard Summary : Use real-time signal display to validate entry strength.
Timeframes : 15M–1H recommended for swing/intraday setups; 5M–15M for automation.
💡 Advanced Features
Entry Strength Scoring: Composite weight of all active components + filters.
Cooldown System: Limits excessive signals in volatile periods.
Multiple Exit Strategies: SL & TP modes with optional indicator-based exits.
Statistical Filtering: Wavelet + Kalman combination optimizes entry confidence.
Full Alert Suite: Covers entries, exits, filter triggers, volume states, and more.
🧠 Suggested Strategy Usage
Wait for full confirmation from ALMA, FluxWave, and QuickSilver.
Ensure volume energy is High and noise filter confirms trend clarity.
Use adaptive SL/TP or indicator-based exits.
Monitor dashboard for live signal strength ≥ threshold.
Use “Balanced” mode for general use; switch to “Aggressive” for tighter signals.
📝 Credits & Originality
Concept based on DaviddTech’s component-driven methodology .
FluxWave Oscillator built as an evolved version of Trendlio with full signal customization — credit @dudeowns .
Volume Energy Filter adapted from the work of @ceyhun .
Noise filtration and system architecture developed independently using Pine Script v6.
All code and logic is original, non-rehashed, and completely refactored to ensure uniqueness.
Quantum Flow Navigator fuses adaptive baselines, confirmation logic, energy-based filters, and statistical refinement into a precision signal engine—optimized for traders who value structure, clarity, and control.
AllMA Trend Radar [trade_lexx]📈 AllMA Trend Radar is your universal trend analysis tool!
📊 What is AllMA Trend Radar?
AllMA Trend Radar is a powerful indicator that uses various types of Moving Averages (MA) to analyze trends and generate trading signals. The indicator allows you to choose from more than 30 different types of moving averages and adjust their parameters to suit your trading style.
💡 The main components of the indicator
📈 Fast and slow moving averages
The indicator uses two main lines:
- Fast MA (blue line): reacts faster to price changes
- Slow MA (red line): smoother, reflects a long-term trend
The combined use of fast and slow MA allows you to get trend confirmation and entry/exit points from the market.
🔄 Wide range of moving averages
There are more than 30 types of moving averages at your disposal:
- SMA: Simple moving average
- EMA: Exponential moving average
- WMA: Weighted moving average
- DEMA: double exponential MA
- TEMA: triple exponential MA
- HMA: Hull Moving Average
- LSMA: Moving average of least squares
- JMA: Eureka Moving Average
- ALMA: Arnaud Legoux Moving Average
- ZLEMA: moving average with zero delay
- And many others!
🔍 Indicator signals
1️⃣ Fast 🆚 Slow MA signals (intersection and ratio of fast and slow MA)
Up/Down signals (intersection)
- Buy (Up) signal:
- What happens: the fast MA crosses the slow MA from bottom to top
- What does the green triangle with the "Buy" label under the candle look
like - What does it mean: a likely upward trend reversal or an uptrend strengthening
- Sell signal (Down):
- What happens: the fast MA crosses the slow MA from top to bottom
- What does it look like: a red triangle with a "Sell" mark above the candle
- What does it mean: a likely downtrend reversal or an increase in the downtrend
Greater/Less signals (ratio)
- Buy signal (Greater):
- What happens: the fast MA becomes higher than the slow MA
- What does it look like: a green triangle with a "Buy" label under the candle
- What does it mean: the formation or confirmation of an uptrend
- Sell signal (Less):
- What happens: the fast MA becomes lower than the slow MA
- What does it look like: a red triangle with a "Sell" mark above the candle
- What does it mean: the formation or confirmation of a downtrend
2️⃣ Signals ⚡️ Fast MA (fast MA and price)
Up/Down signals (intersection)
- Buy signal (Up Fast):
- What happens: the price crosses the fast MA from bottom to top
- What does it look like: a green triangle with a "Buy" label under the candle
- What does it mean: a short-term price growth signal
- Sell signal (Down Fast):
- What happens: the price crosses the fast MA from top to bottom
- What does it look like: a red triangle with a "Sell" label above the candle
- What does it mean: a short-term price drop signal
Greater/Less signals (ratio)
- Buy signal (Greater Fast):
- What happens: the price is getting higher than the fast MA
- What does it look like: a green triangle with a "Buy" label under the candle
- What does it mean: the price is above the fast MA, which indicates an upward movement
- Sell signal (Less Fast):
- What happens: the price is getting lower than the fast MA
- What does it look like: a red triangle with a "Sell" mark above the candle
- What does it mean: the price is under the fast MA, which indicates a downward movement
3️⃣ Signals 🐢 Slow MA (slow MA and price)
Up/Down signals (intersection)
- Buy signal (Up Slow):
- What happens: the price crosses the slow MA from bottom to top
- What does it look like: a green triangle with a "Buy" label under the candle
- What does it mean: a potential medium-term upward trend reversal
- Sell signal (Down Slow):
- What happens: the price crosses the slow MA from top to bottom
- What does it look like: a red triangle with a "Sell" label above the candle
- What does it mean: a potential medium-term downward trend reversal
Greater/Less signals (ratio)
- Buy signal (Greater Slow):
- What happens: the price is getting above the slow MA
- What does it look like: a green triangle with a "Buy" label under the candle
- What does it mean: the price is above the slow MA, which indicates a strong upward movement
- Sell signal (Less Slow):
- What is happening: the price is getting below the slow MA
- What does it look like: a red triangle with a "Sell" mark above the candle
- What does it mean: the price is under the slow MA, which indicates a strong downward movement
🛠 Filters to filter out false signals
1️⃣ Minimum distance between the signals
- What it does: sets the minimum number of candles between signals of the same type
- Why it is needed: it prevents the appearance of too frequent signals, especially during periods of high volatility
- How to set it up: Set a different value for each signal type (default: 3-5 bars)
- Example: if the value is 3 for Up/Down signals, after the buy signal appears, the next buy signal may appear no earlier than 3 bars later
2️⃣ Advanced indicator filters
🔍 RSI Filter
- What it does: Checks the Relative Strength Index (RSI) value before generating a signal
- Why it is needed: it helps to avoid countertrend entries and catch reversal points
- How to set up:
- For buy signals (🔋 Buy): set the RSI range, usually in the oversold zone (for example, 1-30)
- For sell signals (🪫 Sell): set the RSI range, usually in the overbought zone (for example, 70-100)
- Example: if the RSI = 25 (in the range 1-30), the buy signal will be confirmed
📊 MFI Filter (Cash Flow Index)
- What it does: analyzes volumes and the direction of price movement
- Why it is needed: confirms signals with data on the activity of cash flows
- How to set up:
- For buy signals (🔋 Buy): set the MFI range in the oversold zone (for example, 1-25)
- For sell signals (🪫 Sell): set the MFI range in the overbought zone (for example, 75-100)
- Example: if MFI = 80 (in the range of 75-100), the sell signal will be confirmed
📈 Stochastic Filter
- What it does: analyzes the position of the current price relative to the price range
- Why it is needed: confirms signals based on overbought/oversold conditions
- How to configure:
- You can configure the K Length, D Length and Smoothing parameters
- For buy signals (🔋 Buy): set the stochastic range in the oversold zone (for example, 1-20)
- For sell signals (🪫 Sell): set the stochastic range in the overbought zone (for example, 80-100)
- Example: if stochastic = 15 (is in the range of 1-20), the buy signal will be confirmed
🔌 Connecting to trading strategies
The indicator provides various connectors to connect to your trading strategies.:
1️⃣ Individual connectors for each type of signal
- 🔌Fast vs Slow Up/Down MA Signal🔌: signals for the intersection of fast and slow MA
- 🔌Fast vs Slow Greater/Less MA Signal🔌: signals of the ratio of fast and slow MA
- 🔌Fast Up/Down MA Signal🔌: signals of the intersection of price and fast MA
- 🔌Fast Greater/Less MA Signal🔌: signals of the ratio of price and fast MA
- 🔌Slow Up/Down MA Signal🔌: signals of the intersection of price and slow MA
- 🔌Slow Greater/Less MA Signal🔌: Price versus slow MA signals
2️⃣ Combined connectors
- 🔌Combined Up/Down MA Signal🔌: combines all the crossing signals (Up/Down)
- 🔌Combined Greater/Less MA Signal🔌: combines all the signals of the ratio (Greater/Less)
- 🔌Combined All MA Signals🔌: combines all signals (Up/Down and Greater/Less)
❗️ All connectors return values:
- 1: buy signal
- -1: sell signal
- 0: no signal
📚 How to start using AllMA Trend Radar
1️⃣ Selection of types of moving averages
- Add an indicator to the chart
- Select the type and period for the fast MA (default: DEMA with a period of 14)
- Select the type and period for the slow MA (default: SMA with a period of 14)
- Experiment with different types of MA to find the best combination for your trading style
2️⃣ Signal settings
- Turn on the desired signal types (Up/Down, Greater/Less)
- Set the minimum distance between the signals
- Activate and configure the necessary filters (RSI, MFI, Stochastic)
3️⃣ Checking on historical data
- Analyze how the indicator works based on historical data
- Pay attention to the accuracy of the signals and the presence of false alarms
- Adjust the settings if necessary
4️⃣ Introduction to the trading strategy
- Decide which signals will be used to enter the position.
- Determine which signals will be used to exit the position.
- Connect the indicator to your trading strategy through the appropriate connectors
🌟 Practical application examples
Scalping strategy
- Fast MA: TEMA with a period of 8
- Slow MA: EMA with a period of 21
- Active signals: Fast MA Up/Down
- Filters: RSI (range 1-40 for purchases, 60-100 for sales)
- Signal spacing: 3 bars
Strategy for day trading
- Fast MA: TEMA with a period of 10
- Slow MA: SMA with a period of 20
- Active signals: Fast MA Up/Down and Fast vs Slow Greater/Less
- Filters: MFI (range 1-25 for purchases, 75-100 for sales)
- Signal spacing: 5 bars
Swing Trading Strategy
- Fast MA: DEMA with a period of 14
- Slow MA: VWMA with a period of 30
- Active signals: Fast vs Slow Up/Down and Slow MA Greater/Less
- Filters: Stochastic (range 1-20 for purchases, 80-100 for sales)
- Signal spacing: 8 bars
A strategy for positional trading
- Fast MA: HMA with a period of 21
- Slow MA: SMA with a period of 50
- Active signals: Slow MA Up/Down and Fast vs Slow Greater/Less
- Filters: RSI and MFI at the same time
- The distance between the signals: 10 bars
💡 Tips for using AllMA Trend Radar
1. Select the types of MA for market conditions:
- For trending markets: DEMA, TEMA, HMA (fast MA)
- For sideways markets: SMA, WMA, VWMA (smoothed MA)
- For volatile markets: KAMA, AMA, VAMA (adaptive MA)
2. Combine different types of signals:
- Up/Down signals work better when moving from a sideways trend to a directional
one - Greater/Less signals are optimal for fixing a stable trend
3. Use filters effectively:
- The RSI filter works great in trending markets
- MFI filter helps to confirm the strength of volume movement
- Stochastic filter works well in lateral ranges
4. Adjust the minimum distance between the signals:
- Small values (2-3 bars) for short-term trading
- Average values (5-8 bars) for medium-term trading
- Large values (10+ bars) for long-term trading
5. Use combination connectors:
- For more reliable signals, connect the indicator through the combined connectors
💰 With the AllMA Trend Radar indicator, you get a universal trend analysis tool that can be customized for any trading style and timeframe. The combination of different types of moving averages and advanced filters allows you to significantly improve the accuracy of signals and the effectiveness of your trading strategy!

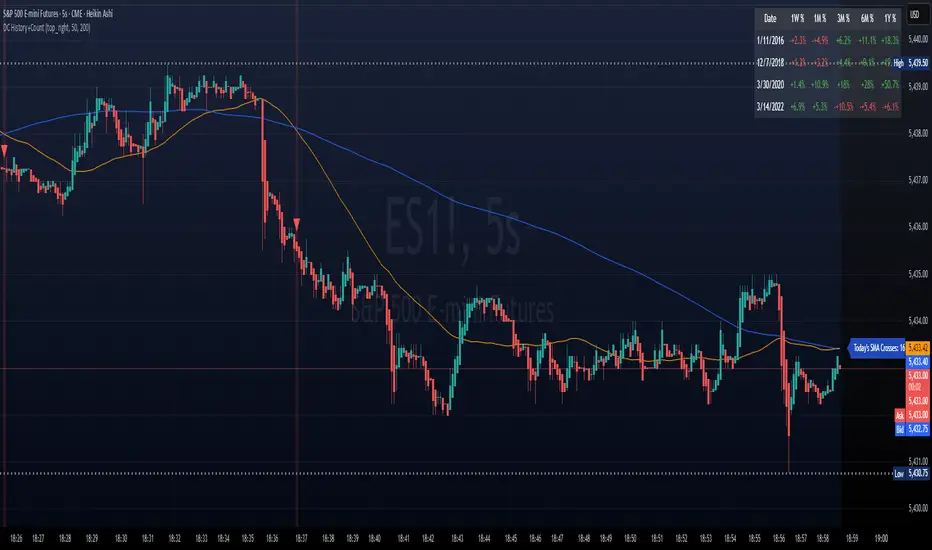
DC History & Daily Cross CountOkay, here is a technical document for the Pine Script indicator we developed. This can be used as a guide or description when publishing the script on TradingView or elsewhere.
Technical Document: SMA Cross Signals & Static DC History (Death Cross)
Version: 1.0
Date: April 14, 2025
Indicator Name: Specific Static DC History + Live Signals
Pine Script Version: 5
1. Overview
This TradingView indicator is designed to provide traders with visual signals for Simple Moving Average (SMA) crossovers, specifically focusing on the "Death Cross", while also presenting relevant historical context via a static data table and a real-time daily cross counter.
It combines several features:
Plotting of a fast and a slow Simple Moving Average (SMA).
Visual identification and marking of "Death Cross" events (Fast SMA crossing below Slow SMA) directly on the price chart.
A customizable table displaying static, pre-defined historical performance data of the S&P 500 following specific Death Crosses that occurred between 2016 and 2022.
An optional label that counts the total number of SMA crosses (both Golden Crosses and Death Crosses) occurring during the current trading day/session, including extended hours if enabled by the user on their chart.
2. Features
Customizable SMA Lengths: User-defined periods for both the Fast (default 50) and Slow (default 200) SMAs.
Death Cross Signals: Clear visual markers (red triangles above the bar and optional background shading) when the Fast SMA closes below the Slow SMA.
Optional SMA Plotting: Ability to show or hide the SMA lines themselves.
Static Historical Performance Table: Displays fixed historical return data (1 Week, 1 Month, 3 Months, 6 Months, 1 Year) following specific S&P 500 Death Crosses that occurred on 1/11/2016, 12/7/2018, 3/30/2020, and 3/14/2022. Note: This data is static and does not change based on the current chart.
Customizable Table Position: User can select the on-screen corner for the data table.
Daily SMA Cross Counter: Optionally displays a label showing the cumulative number of times the Fast SMA has crossed above (Golden Cross) or below (Death Cross) the Slow SMA during the current trading day/session.
Extended Hours Compatibility: The Daily Cross Counter includes crosses from pre-market and after-hours sessions if the user has "Extended Trading Hours" enabled on their TradingView chart settings.
3. Technical Explanation
SMA Calculation: The script uses the built-in ta.sma(source, length) function, calculating the Simple Moving Average based on the close price of each bar for the user-defined fastLen and slowLen.
Death Cross Detection: A Death Cross is detected using ta.crossunder(fastMA, slowMA). This function returns true on the first bar where the value of fastMA is less than the value of slowMA, after previously being greater than or equal to it. The comparison is based on the calculated SMA values at the close of each bar.
Golden Cross Detection: Similarly, ta.crossover(fastMA, slowMA) is used to detect Golden Crosses for the daily counter.
Visual Signals: The plotshape() function draws a red triangle above the bar where deathCross is true. The bgcolor() function applies a transparent red background to the bar where deathCross is true.
Static Table Data: The historical performance data for the 4 specified dates (Jan 2016 - Mar 2022) is hardcoded into array variables within the script. This data was derived from a prior analysis (based on the initially provided image, source likely Dow Jones Market Data or similar) and is not calculated dynamically from the chart. The script iterates through these arrays and populates a table object on the last bar.
Daily Cross Counter:
A var int dailyCrossCount variable holds the count, ensuring persistence across bars within a day.
ta.change(time("D")) detects the start of a new daily session based on the chart's symbol and session settings. When true, the dailyCrossCount is reset to 0.
On each bar, if either deathCross or goldenCross is true, the dailyCrossCount is incremented.
A label object displays the dailyCrossCount and is updated on the last bar (barstate.islast).
Extended Hours Inclusion: The script inherently uses the data series provided by the chart. If the chart is configured to include Extended Trading Hours (ETH), the close prices used for SMA calculations will reflect ETH data, and crosses occurring during ETH will be detected and counted.
4. Settings (Inputs)
Show Static Data Table (2016-2022) (Checkbox): Toggles the visibility of the table containing the fixed historical performance data. (Default: On)
Table Position (Dropdown): Selects the corner or side of the chart where the static data table will be displayed. (Default: top_right)
Plot 50/200 SMAs (Checkbox): Toggles the visibility of the Fast and Slow SMA lines on the chart. (Default: On)
Fast MA Length (Integer Input): Sets the lookback period for the Fast Simple Moving Average. (Default: 50)
Slow MA Length (Integer Input): Sets the lookback period for the Slow Simple Moving Average. (Default: 200)
Show Daily Cross Count (Checkbox): Toggles the visibility of the label displaying the number of SMA crosses detected during the current day's session. (Default: On)
5. How to Use / Interpretation
Apply the indicator to your desired chart (e.g., SPY, QQQ, /ES).
Use the plotted SMA lines (if enabled) and the red triangle/background signals to identify potential trend changes indicated by Death Crosses based on your chosen MA lengths. Remember that these are lagging indicators.
Refer to the static data table for historical context only. It shows how the S&P 500 performed following specific Death Crosses between 2016 and 2022. This data is fixed and does not predict future performance.
Use the "Today's SMA Crosses" label (if enabled) to gauge the frequency of interaction between the chosen SMAs during the current session. A higher number might indicate choppier conditions or potential shifts on the chart's timeframe.
Important: For the Daily Cross Counter to reflect pre-market/after-hours activity, ensure "Extended Trading Hours" (ETH) is enabled in your TradingView chart settings.
Be aware that the number of crosses detected by the script (based on bar closes) may differ from visual interpretations of lines touching intraday, especially on lower timeframes.
6. Limitations
Static Table Data: The performance data in the table is fixed to the 4 provided historical instances (2016-2022) and is not calculated dynamically or updated. It serves only as a historical reference point.
Lagging Indicators: Moving Averages and their crosses are lagging indicators and may not signal trend changes precisely at tops or bottoms.
Cross Calculation: Crosses are based on the closing price of each bar. Intraday price movements briefly piercing an SMA may not register as a confirmed cross.
Daily Counter Definition: The definition of "Today" depends on the chart's session timing, which might not align perfectly with a calendar day.
Whipsaws: On lower timeframes or during volatile periods, MA crosses can generate frequent signals (whipsaws) which may be less reliable.
7. Disclaimer
This indicator is provided for informational and educational purposes only. It does not constitute financial advice or a recommendation to buy or sell any security. Trading involves significant risk, and past performance (including the historical data presented in the table) is not indicative of future results. Always conduct your own thorough research and consult with a qualified financial advisor before making any trading decisions.
Combined EMA/Smiley & DEM System## 🔷 General Overview
This script creates an advanced technical analysis system for TradingView, combining multiple Exponential Moving Averages (EMAs), Simple Moving Averages (SMAs), dynamic Fibonacci levels, and ATR (Average True Range) analysis. It presents the results clearly through interactive, real-time tables directly on the chart.
---
## 🔹 Indicator Structure
The script consists of two main parts:
### **1. EMA & SMA Combined System with Fibonacci**
- **Purpose:**
Provides visual insights by comparing multiple EMA/SMA periods and identifying significant dynamic price levels using Fibonacci ratios around a calculated "Golden" line.
- **Components:**
- **Moving Averages (MAs)**:
- 20 EMAs (periods from 20 to 400)
- 20 SMAs (also from 20 to 400)
- **Golden Line:**
Calculated as the average of all EMAs and SMAs.
- **Dynamic Fibonacci Levels:**
Key ratios around the Golden line (0.5, 0.618, 0.786, 1.0, 1.272, 1.414, 1.618, 2.0) dynamically adjust based on market conditions.
- **Fibonacci Labels:**
Labels are shown next to Fibonacci lines, indicating their numeric value clearly on the chart.
- **Table (Top Right Corner):**
- Displays:
- **Input:** EMA/SMA periods sorted by their current average price levels.
- **AVG:** The average of corresponding EMA & SMA pairs.
- **EMA & SMA Values:** Individual EMA/SMA values clearly marked.
- **Dynamic Highlighting:** Highlights the row whose average (EMA+SMA)/2 is closest to the current price, helping identify immediate price action significance.
- **Sorting Logic:**
Each EMA/SMA pair is dynamically sorted based on their average values. Color coding (red/green) is used:
- **Green:** EMA/SMA pairs with shorter periods when their average is lower.
- **Red:** EMA/SMA pairs with longer periods when their average is lower.
- **Star (⭐):** Represents the "Golden" average clearly.
---
### **2. DEM System (Dynamic EMA/ATR Metrics)**
- **Purpose:**
Provides detailed ATR statistics to assess market volatility clearly and quickly.
- **Components:**
- **Moving Averages:**
- SMA lines: 25, 50, 100, 200.
- **Bollinger Bands:**
- Based on 20-period SMA of highs and standard deviation of lows.
- **ATR Analysis:**
- ATR calculations for multiple periods (1-day, 10, 20, 30, 40, 50).
- **ATR Premium:** Average ATR of all calculated periods, providing an overarching volatility indicator.
- **ATR Table (Bottom Right Corner):**
- Displays clearly structured ATR values and percentages relative to the current close price:
- Columns: **ATR Period**, **Value**, and **% of Close**.
- Rows: Each specific ATR (1D, 10, 20, 30, 40, 50), plus ATR premium.
- The ATR premium is highlighted in yellow to signify its importance clearly.
---
## 🔹 Key Features and Logic Explained
- **Dynamic EMA/SMA Sorting:**
The script computes the average of each EMA/SMA pair and sorts them dynamically on each bar, highlighting their relative importance visually. This allows traders to easily interpret the strength of current support/resistance levels based on moving averages.
- **Closest EMA/SMA Pair to Current Price:**
Calculates the absolute difference between the current price and all EMA/SMA averages, highlighting the closest one for quick reference.
- **Fibonacci Ratios:**
- Dynamically calculated Fibonacci levels based on the "Golden" EMA/SMA average give clear visual guidance for potential targets, supports, and resistances.
- Labels are continuously updated and placed next to levels for clarity.
- **ATR Volatility Analysis:**
- Provides immediate insight into market volatility with absolute and relative (percentage-based) ATR values.
- ATR premium summarizes volatility across multiple timeframes clearly.
---
## 🔹 Practical Use Case:
- Traders can quickly identify support/resistance and critical price zones through EMA/SMA and Fibonacci combinations.
- Useful in assessing immediate volatility, guiding stop-loss and take-profit levels through detailed ATR metrics.
- The dynamic highlighting in tables provides intuitive, real-time decision support for active traders.
---
## 🔹 How to Use this Script:
1. **Adjust EMA & SMA Lengths** from indicator settings if different periods are preferred.
2. **Monitor dynamic Fibonacci levels** around the "Golden" average to identify possible reversal or continuation points.
3. **Check EMA/SMA table:** Rows highlighted indicate immediate significance concerning current market price.
4. **ATR table:** Use volatility metrics for better risk management.
---
## 🔷 Conclusion
This advanced Pine Script indicator efficiently combines multiple EMAs, SMAs, dynamic Fibonacci retracement levels, and volatility analysis using ATR into a comprehensive real-time analytical tool, enhancing traders' decision-making capabilities by providing clear and actionable insights directly on the TradingView chart.

Rogue ORB PRORogue ORB Pro is a precision-engineered Opening Range Breakout (ORB) indicator built for active intraday traders who need real signals, not noise.
This tool identifies high-probability breakout entries from the opening range, enhanced with optional ATR-based stop loss levels, deviation targets, cooldown filters, and a relative volume gate to filter weak setups.
🔍 Key Features:
Opening Range High/Low: Drawn from a user-defined time window and locked for the day
Deviations: Automatically plots target zones above and below the OR range (e.g. 1, 2 deviations)
Pre-Market Levels: Automatically draws pre market high and low lines at the end of pre market session
Buy/Sell Signals: Triggered on breakout of the OR High/Low with configurable breakout logic (touch or close)
ATR Stop Loss Line: Dynamically drawn at a fixed ATR distance from breakout candle, with optional SL label
Cooldown Period: Prevents back-to-back signals by enforcing a user-defined bar delay between entries, can help with overtrading
Volume Filter: Optional relative volume filter that requires breakout candles to exceed a custom volume threshold
VWAP Overlay: Visual VWAP for directional bias and confluence

Oil/gas ratio MAOil/Gas Ratio-Based Equivalent Price
This indicator calculates the gas-equivalent price based on the current oil price and a defined oil/gas ratio. It helps identify relative overvaluation or undervaluation of natural gas compared to oil.
Features:
- Choose between a static or dynamic (SMA-based) oil/gas ratio
- Displays the fair value of gas derived from oil prices
- Works with any oil ticker symbol (e.g. BRENT, USOIL, etc.)
Useful for traders analyzing intermarket relationships and looking for relative value signals between energy commodities.

Liquidity Sweep with EMAThis Pine Script indicator helps traders identify potential market reversals based on liquidity sweeps, where the price moves through the previous candle's low or high and then closes above or below the previous candle's wick. These are often seen as significant market moves or liquidity grabs before a potential reversal or continuation.
The indicator is also equipped with an EMA (Exponential Moving Average) as an optional visual aid to give traders a sense of the prevailing trend, though it is not used as part of the signal generation logic.
Key Features:
Liquidity Sweep Detection:
Bullish Sweep: Triggered when the current candle sweeps below the low of the previous candle and then closes above the high of the previous candle. This indicates a potential market reversal to the upside after the liquidity sweep.
Bearish Sweep: Triggered when the current candle sweeps above the high of the previous candle and then closes below the low of the previous candle. This indicates a potential market reversal to the downside after the liquidity sweep.
EMA:
The EMA (50) is plotted on the chart for visual trend guidance. While it is not used to confirm the signals, it can help traders see if the market is in a general uptrend or downtrend.
Signal Presentation:
Buy Signal: The indicator will plot a green upward arrow below the candle when a bullish liquidity sweep is detected.
Sell Signal: The indicator will plot a red downward arrow above the candle when a bearish liquidity sweep is detected.
Timeframe Filter:
The indicator only generates signals on the following timeframes: 30-minute, 1-hour, 4-hour, and Daily. This helps to ensure the sweeps are significant and likely to result in meaningful price moves.
Alerts:
Alerts can be set up for both bullish and bearish sweep signals, so traders can be notified when these events occur.
Customizable:
EMA Length: The length of the Exponential Moving Average (EMA) can be adjusted. By default, it is set to 50, but you can modify this to fit your trading strategy.
Show EMA Option: You can toggle whether or not to display the EMA line on the chart.
How It Works:
The indicator looks for price action patterns where the current candle sweeps through the high or low of the previous candle and closes beyond the previous wick.
These patterns are often seen as potential traps, where the price initially moves in one direction (sweeping the liquidity) and then quickly reverses, making them important for traders who want to catch reversals or breakouts after a liquidity sweep.
The EMA (50) gives a general trend direction but doesn't directly affect the trade signals. It serves as a visual reference for trend analysis.
Potential Use Cases:
Reversal Trading: Traders can use this indicator to catch reversals after a liquidity sweep. The green upward arrows may indicate a bullish reversal, while the red downward arrows may indicate a bearish reversal.
Trend Trading: The EMA can help traders gauge the overall market trend. If the price is above the EMA, the market may be in an uptrend, and traders may focus on bullish sweeps. Conversely, if the price is below the EMA, the market may be in a downtrend, and traders may focus on bearish sweeps.
Confirmation with Other Indicators: Although the EMA is not used to confirm signals in this script, it can be combined with other indicators (like RSI, Volume, or MACD) to enhance the accuracy of your trades.
Final Thoughts:
This script is designed to identify liquidity sweeps and price reversals based on price action alone, without relying on complex indicators. The optional EMA serves as a helpful tool for understanding the overall market trend. It’s ideal for traders looking to spot potential reversal points after significant price sweeps and is suitable for multiple timeframes (30m, 1h, 4h, Daily).
You can use this description to help potential users understand the functionality of your indicator when publishing it on TradingView or selling it as an invite-only script. Let me know if you need any adjustments or further details!
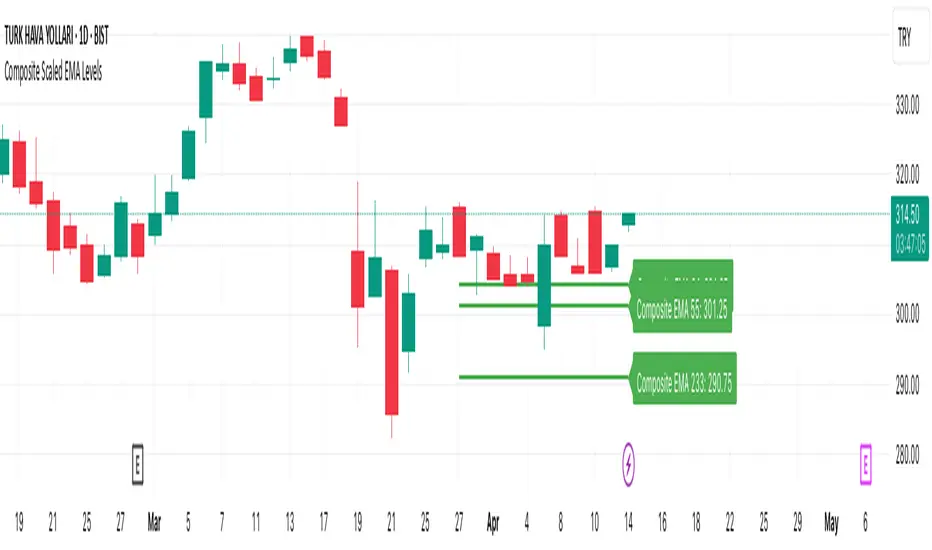
Composite Scaled EMA LevelsComposite Scaled EMA Levels Indicator
This TradingView Pine Script indicator calculates a “composite EMA” that compares the closing price of the current asset with that of the XU100 index and scales the EMA values to the XU100 level. It then visualizes these computed levels as horizontal lines on the chart with corresponding labels.
Key Components:
Inputs and Data Retrieval:
Length Input: The user defines a parameter length (default is 10) which determines over how many bars the horizontal line is drawn.
Data Collection:
The daily closing price of the current symbol (current_close) is retrieved using request.security().
The daily closing price of the XU100 index (xu100) is also retrieved.
A ratio is computed as current_close / xu100. This ratio serves as the basis for calculating the composite EMAs.
EMA Calculations:
The indicator computes Exponential Moving Averages (EMAs) on the ratio for specific periods.
In the provided version, the script calculates EMAs for three periods (34, 55, and 233), though you can easily expand this to other periods if needed.
Each computed EMA (for instance, EMA34, EMA55, EMA233) is then scaled by multiplying it with the XU100 index’s close, converting it to a price level that is meaningful on the chart.
Drawing Horizontal Lines:
Instead of using the standard plot() function, the script uses line.new() to draw horizontal lines representing the scaled EMA values over the last “length” bars.
Before drawing new lines, any existing lines and labels are deleted to ensure that only the most current values are shown.
Adding Labels to Lines:
The script creates a label for each EMA using label.new(), placing the label at the current bar (i.e., the rightmost position on the chart) using label.style_label_left so that the text appears to the right of the line.
The label displays the name of the composite EMA (e.g., "Composite EMA 34") along with its current scaled value.
Visualization:
The horizontal lines and labels provide a visual reference for the composite EMA levels. These lines help traders see critical support/resistance levels derived from the relationship between the current asset and the XU100 index.
Colors are assigned for clarity (for example, the EMA lines in this version use green).
Summary:
The Composite Scaled EMA Levels indicator is designed to help traders analyze the relationship between an asset’s price and the broader market index (XU100) by calculating a ratio and then applying EMAs on that ratio. By scaling these EMAs back to price levels and displaying them as horizontal lines with clear labels on the chart, the indicator offers a visual tool to assess trend direction and potential support or resistance levels. This can assist in making informed trading decisions based on composite trend analysis.
MTF RSI & SMA Crossover [OB/OS Filtered Signals]MTF RSI & SMA Crossover
This custom indicator combines the power of Multi-Timeframe (MTF) RSI, Simple Moving Average (SMA), and overbought/oversold (OB/OS) conditions to provide precise buy and sell signals based on the crossovers of the RSI and its SMA. The indicator includes the following features:
MTF RSI: The Relative Strength Index (RSI) is calculated on a customizable timeframe, giving traders the ability to analyze price momentum across different timeframes.
SMA of RSI: The RSI is smoothed using a Simple Moving Average (SMA), helping to filter out market noise and identify clearer trend reversals.
Overbought/Oversold Filter: Signals are only triggered when the RSI has been in an overbought (above 70) or oversold (below 30) condition, improving the reliability of potential trend reversals.
Buy/Sell Signals:
Buy signals occur when the RSI crosses above its SMA after being oversold, indicating potential upward momentum.
Sell signals occur when the RSI crosses below its SMA after being overbought, indicating potential downward momentum.
Customizable Label Colors: Choose your own colors for the "BUY" and "SELL" labels to match your chart's design and preferences.
Alerts: Set alerts for buy and sell signals, ensuring you don't miss a potential trade.
This indicator is ideal for traders who want to capture trend reversals and momentum shifts while filtering out false signals by using overbought and oversold conditions. Customize the settings to suit your trading style and strategy.

Trap Zone 2 minTrap Zone 2 Min — Visual Detection of Trap and Expansion Zones
This indicator is designed to clearly identify key price zones on lower timeframes, particularly the 2-minute chart. It's ideal for scalpers and intraday traders looking for structured, high-probability setups.
Trap Zone (No Trade Zone)
A central shaded area where trading is discouraged.
Marks potential liquidity traps or manipulation zones.
Calculated using recent highs, lows, and moving averages (MA20 and MA200).
Zones + and -
Positioned two times the size of an EB (Elephant Bar) above and below the trap zone.
Represent the first expansion level.
Useful for identifying potential long or short entries based on price breakout direction.
Zones ++ and --
Extend from the first + or - level to the next line outward.
Represent a second expansion layer, often aligning with price continuation or reaction zones.
Helpful for profit-taking or adjusting risk.
Zones +++ and ---
The most extreme levels plotted.
Serve as final take-profit areas or potential reversal zones.
Additional Features
Optional display of MA20 and MA200.
Configurable ADR (Average Daily Range) labels.
Full visual customization for better chart integration.
Best For
Scalpers and intraday traders.
Identifying and reacting to structured market zones.
Mapping price expansions and potential reversal points.

ScalpSwing Pro SetupScript Overview
This script is a multi-tool setup designed for both scalping (1m–5m) and swing trading (1H–4H–Daily). It combines the power of trend-following , momentum , and mean-reversion tools:
What’s Included in the Script
1. EMA Indicators (20, 50, 200)
- EMA 20 (blue) : Short-term trend
- EMA 50 (orange) : Medium-term trend
- EMA 200 (red) : Long-term trend
- Use:
- EMA 20 crossing above 50 → bullish trend
- EMA 20 crossing below 50 → bearish trend
- Price above 200 EMA = uptrend bias
2. VWAP (Volume Weighted Average Price)
- Shows the average price weighted by volume
- Best used in intraday (1m to 15m timeframes)
- Use:
- Price bouncing from VWAP = reversion trade
- Price far from VWAP = likely pullback incoming
3. RSI (14) + Key Levels
- Shows momentum and overbought/oversold zones
- Levels:
- 70 = Overbought (potential sell)
- 30 = Oversold (potential buy)
- 50 = Trend confirmation
- Use:
- RSI 30–50 in uptrend = dip buying zone
- RSI 70–50 in downtrend = pullback selling zone
4. MACD Crossovers
- Standard MACD with histogram & cross alerts
- Shows trend momentum shifts
- Green triangle = Bullish MACD crossover
- Red triangle = Bearish MACD crossover
- Use:
- Confirm swing trades with MACD crossover
- Combine with RSI divergence
5. Buy & Sell Signal Logic
BUY SIGNAL triggers when:
- EMA 20 crosses above EMA 50
- RSI is between 50 and 70 (momentum bullish, not overbought)
SELL SIGNAL triggers when:
- EMA 20 crosses below EMA 50
- RSI is between 30 and 50 (bearish momentum, not oversold)
These signals appear as:
- BUY : Green label below the candle
- SELL : Red label above the candle
How to Trade with It
For Scalping (1m–5m) :
- Focus on EMA crosses near VWAP
- Confirm with RSI between 50–70 (buy) or 50–30 (sell)
- Use MACD triangle as added confluence
For Swing (1H–4H–Daily) :
- Look for EMA 20–50 cross + price above EMA 200
- Confirm trend with MACD and RSI
- Trade breakout or pullback depending on structure

Uptrick: Stellar NexusOverview
Uptrick: Stellar Nexus is a multi-layered chart tool designed to help traders visualize market behavior with enhanced clarity and depth. It presents various overlays, signal triggers, and an asset-level behavioral table in one cohesive interface. Its core focus is to illustrate how different market states shift over time. By displaying directional structures, dynamic zones, momentum shifts, and a real-time probability assessment of multiple assets, it aims to deliver a comprehensive perspective for those looking to navigate complex market environments more confidently.
Purpose
The primary purpose of Stellar Nexus is to unify several market assessment methods into a single framework, sparing users the need to rely on multiple disjointed indicators. It is especially useful for traders who value having layered signals, interactive overlays, and a quick reference to asset-specific metrics within one tool. By consolidating multiple market insights, the script aspires to reduce guesswork, limit information overload, and present clear triggers for potential trade opportunities or risk management decisions.
Originality
Stellar Nexus stands out because it relies on a proprietary set of logic layers, each carefully designed to detect nuanced shifts in price movement. The script brings forward a streamlined depiction of underlying market changes through color-coded zones, shape markers, and short textual tags. Its architecture also accommodates multiple “modes” of viewing the market—be it through layered cloud structures, trend ribbons, or step-based overlays—so traders can adapt its outputs to match changing conditions. The presence of a specialized probability table and a real-time market state meter (HUD Meter) further underscores its uniqueness, providing at-a-glance scoring for various instruments and a gauge that visually displays ongoing transitions from trending to ranging phases.
Inputs
Stellar Nexus includes several user-configurable settings, organized into themed groups. Each input subtly modifies how information is derived or rendered on the chart:
General
Silken Veil (integer input) : Governs how smooth or responsive various underlying signals will appear.
Canvas (dropdown) : Chooses the primary visual overlay style among Nebula Trail, Velora, or Stellar Stepfilter.
Signals (dropdown) : Selects which built-in signal engine (Fluxor or Flowgen) is responsible for painting buy and sell markers.
Nova Tension (integer input) : Influences the internal motion sensitivity used by certain triggers.
Astral Ribbon (integer input) : Imparts a broader directional bias layer that can highlight whether the current environment is bullish or bearish.
Bands
Phase Delay (integer input) : Impacts baseline offsets for certain dynamic band calculations.
Band Softener (float input) : Creates a blended baseline, balancing two distinct smoothing techniques.
Spread Factor (float input) : Scales how wide or narrow the generated envelope bands become.
Layer Offset (float input) : Adjusts spacing between multiple layered boundaries in the band structure.
Smooth Mode (dropdown boolean) : Toggles an extra layer of smoothing on or off for the plotted envelopes.
Feed Matrix
Burst (integer input) : Adjusts how the Flowgen engine interprets momentum buildup. Higher values generally lead to more conservative signals.
Delta Curve Sync (integer input) : Alters the sensitivity of directional alignment within the Flowgen system, refining how quickly the script adapts to market slope changes.
Lambda Pulse Shift (integer input) : Controls timing offsets within the Flowgen structure, subtly influencing the trigger timing of transitions.
Sync Drift Limit (integer input) : Provides a stabilizing effect on the internal motion detection engine, helping reduce erratic behavior during choppy conditions.
WMA Open Filter Tunnel (integer input) : Filters signal validity by applying a dynamic range check on opening price structures, reducing false positives in unstable markets.
Probability Table
Show Predictability Table (boolean) : Enables or disables a table of asset metrics.
Show Numeric Values (boolean) : Switches between displaying numeric values and using simple directional markers in the table cells.
Stepfilter
Sensitivity (dropdown) : Offers a range of speed profiles (Very Fast to Very Slow and TURTLE option) that define how quickly or slowly the step-based overlay reacts to price changes.
HUD Meter
Show Stellar HUD Meter (boolean) : Turns on or off a specialized gauge for quick insight into trending vs. ranging conditions.
Take Profit Signals
Show TP Signals (boolean) : Determines whether exit or take-profit markers are displayed after certain conditions have been met.
Phase Length (integer input) : Influences the internal baseline used for the exit signal logic.
Sync Channel (integer input) : Sets a period within which different data points are compared or synced.
Filter (integer input) : Imposes an additional smoothing on exit-related cues.
Features
Signals (Fluxor and Flowgen)
Fluxor
Logic: Fluxor focuses on detecting specific price transitions, validating them against an internal directional and momentum layer, and then confirming the move based on the script’s overarching market bias.
Visual Representation: When Fluxor is activated, up and down label markers (“▲+” or “▼+”) appear at points the system regards as noteworthy transitions. These do not guarantee trades but are designed to guide users on when buying or selling pressure may have intensified or reversed.
How It Helps: Fluxor is streamlined for those who want simpler, clearer triggers that factor in both trend alignment and short-term motion shifts. This option is more for mean reversion traders.
Flowgen
Logic: Flowgen employs a slightly more sophisticated approach that evaluates multiple “environmental layers,” including structural alignment, directional slope checks, and distinct open-state filters.
Visual Representation: When Flowgen senses a valid transition, it prints discrete up and down markers, much like Fluxor, but triggered by different, multi-layer considerations.
How It Helps: Flowgen caters to traders who desire more emphasis on layered agreement—where multiple aspects of the market must line up before a signal is shown. This option is more for trend following traders.
Overlays (Nebula Trail, Velora, Stellar Stepfilter)
Nebula Trail
Purpose: This indicator employs dynamic, color-coded bands around price action to illustrate prevailing market bias and track which side—bulls or bears—wields greater influence, aligning with a trend-following approach.
Usage: This indicator creates outer and inner “band” regions that can function as potential support or resistance in alignment with market momentum. In bullish phases, the cloud below price acts as a supportive barrier, whereas during bearish conditions, the cloud above price provides a point of resistance. When a bearish signal is detected, traders may enter short positions on a price bounce off this band and then exit when subsequent take-profit cues appear, effectively leveraging the band for both entry and exit strategies.
Velora
Purpose: Extends the concept of band visualization into layered “tiers,” giving a more fine-grained view of how price transitions from one band to another.
Representation: Zones are subdivided into multiple steps, each with distinct shading. As the script’s internal logic detects shifts between bullish or bearish conditions, these layered bands expand or contract to reflect changing momentum.
Usage: Velora subdivides zones into multiple steps, each featuring distinct shading. As the script's internal logic detects shifts between bullish or bearish conditions, these layered bands expand or contract, signaling changes in momentum. When price enters the upper band, especially if the HUD meter shows less definitive momentum, it may hint at a non-trending environment; conversely, in a bearish scenario, the lower band can act as potential support. Narrower bands often point to an impending breakout, while wider bands can suggest a possible reversion in price. Velora is well-suited for traders wanting to see more intermediate zones where the market may hesitate or show partial confirmation—ideal for refined entries or exits.
Smooth:
Choppy:
Stellar Stepfilter
Purpose: Focuses on a persistent directional line that only updates when the script’s logic deems a genuine shift is taking place.
Representation: A single line plots on the chart to represent the “locked” direction. During periods of noise or indecision, this line may remain static, reducing false signals. Optionally, bars can be recolored to reflect bullish or bearish states.
Usage: Traders who prefer a minimalistic, stand-back approach often select Stellar Stepfilter for its ability to filter out choppy conditions and highlight clearer momentum strides. When the line remains flat—particularly in the very slow or “turtle” mode—it signals a ranging market, offering valuable insight into periods of reduced volatility. In TURTLE mode, bars are recolored green or orange to reflect locked trend direction more visibly. TURTLE mode offers the most conservative setting within the Stepfilter engine, emphasizing stability and clarity by reacting only to the strongest directional conditions and visually reinforcing its state through bar coloring.
Very Fast
Very Slow
TURTLE Mode
Probability Table
Description: The Probability Table is displayed on the top-right corner (by default). It automatically fetches data for a handful of assets (in this case, five popular cryptocurrencies), then scores each asset on multiple behavioral metrics. By default, the Probability Table monitors SOL, BTC, ETH, BNB, and XRP from Binance.
Metrics Explained:
HV: Suggests how the asset’s price is fluctuating relative to a standard reference.
ATR/Vol: A ratio that provides insight into volatility compared to trading activity.
WBR: Compares candle wicks against their bodies to gauge the frequency of price swings outside an open-close range.
Liq Clust: Indicates if there are pockets of stable or unstable liquidity.
Momentum: Observes shifts in buying or selling pressure.
PRI: Shows a baseline measure of how far price has deviated from a certain average over time.
Final Verdict: Based on each metric’s reading, an overall classification emerges: Predictable, Moderate, or Chaotic.
How It Helps: Traders can quickly scan this table to see if an asset’s environment is “Predictable” (potentially more structured), “Moderate” (balanced or transitional), or “Chaotic” (unstable and riskier). Each cell can optionally show either numeric approximations or simple “up/down” arrows to reduce clutter.
Non Numeric Values
Numeric Values
Stellar HUD Meter
Description: Located at the top center of the chart, this horizontal gauge toggles between “Trending” and “Ranging,” representing how firmly price is locked in directional expansion versus sideways hesitation.
Mechanics (General): The gauge increments or decrements over time, smoothing out abrupt shifts. A pointer slides across the meter, indicating whether conditions are leaning more toward persistent momentum or uncertain, choppy movement.
How It Helps: This immediate visual feedback helps traders decide if momentum strategies or mean-reversion approaches are more suitable at a given moment, avoiding reliance on guesswork alone.
Take Profit Signals
Description: After any buy or sell trigger occurs (either through Fluxor or Flowgen), the script can flag up to three potential exit points.
Trigger Logic (General): These exits appear when certain internal checks sense that short-term upside or downside pressure may be waning.
Representation: Small markers (“X”) appear near the top or bottom of the candle.
How It Helps: Rather than passively holding a position, these optional signals remind traders of possible exhaustion points. If they choose to follow them, it can help secure partial or full profits during a trend.
Why more than one indicator?
Having more than one internal indicator engine allows Stellar Nexus to adapt to different market behaviors and personal trading styles. Sometimes traders require swift, high-frequency triggers (Fluxor). Other times, they prefer more layered agreement before taking a position (Flowgen). Similarly, each overlay—Nebula Trail, Velora, and Stellar Stepfilter—offers a distinct method for visualizing price action. Markets are dynamic, and no single representation is ideal for all conditions. By blending multiple approaches into one script, Stellar Nexus provides flexibility: a user can switch between sets of signals or overlays based on market phase, personal risk preference, or the timeframe being traded.
Additional Features
Alert System: Built-in alerts for every trigger or state change ensure that traders can receive real-time notifications, even when away from the chart. The alert system includes buy/sell triggers, trend shifts, overlay transitions, take-profit points, and predictability status changes across monitored assets.
Selective Visibility: Users can enable or disable various modules—Probability Table, HUD Meter, Take Profit Signals—to keep their chart interface uncluttered.
State Persistence: Certain modules “lock in” their reading until a strong reason emerges to change it, which can help minimize false flips in volatile conditions.
Tailored Aesthetics: Color choices and label styling are curated to be visually distinct, reducing confusion when multiple signals or overlays occur simultaneously.
Conclusion
Uptrick: Stellar Nexus is a comprehensive, multi-layer script that merges aesthetic clarity with functional depth. It combines diverse overlays, signal engines, probability analyses, and a heads-up market meter into one cohesive tool. By handling trending vs. ranging states, evaluating asset predictability, and offering selective take-profit cues, it serves as a versatile companion for traders who want organized, visually intuitive guidance. Its originality is found not only in how it disguises internal computations, but in the ease with which users can cycle through different overlays and signals to suit changing market conditions. As always, personal due diligence, market awareness, and risk management remain essential. Stellar Nexus simply provides a refined canvas on which to read and interpret price action more confidently.
Disclaimer
This indicator is provided solely for informational and educational purposes. It does not constitute investment advice or a recommendation to engage in any trading activities. Trading and investing in financial markets involve significant risk, and past performance is not indicative of future results. Always conduct your own research, utilize proper risk management, and consider consulting a qualified financial professional before making any investment decisions. Neither the creator nor any contributors to this script accept any liability for financial losses or damages arising from its use. Users of this indicator assume full responsibility for their trading activities.

RSI in pane and 3 EMAs on chartCustom RSI in Pane + 3 EMAs on Chart — with Optional RSI Divergence Detection
Combines RSI in a separate pane with 3 EMAs on the chart and optional RSI-based divergence detection. Useful for analyzing both momentum and trend structure.
Features
RSI Pane
Custom RSI calculation (not built-in ta.rsi) with adjustable source and length
Overlay optional moving average (SMA, EMA, SMMA/RMA, WMA, VWMA, or Bollinger Bands) Overbought/oversold gradient fill for visual clarity (70 / 30 zones)
Midline (50) for neutral RSI territory
RSI Divergence Detection
Optional: toggle on/off with one input
Regular Bullish Divergence : Price makes a lower low, RSI makes a higher low
Regular Bearish Divergence : Price makes a higher high, RSI makes a lower high
Customizable lookback for pivot detection
Visual markers and labels plotted on RSI
Built-in alert conditions for both divergence types
3 EMA Trend Indicators on Price Chart
Three customizable EMAs (default: 20, 50, 200)
Color-coded and clearly plotted on main chart
Use to determine short/mid/long-term trend bias
No repainting or smoothing artifacts
Why use this script?
Gives a full view of trend + momentum without cluttering the main price chart, and it helps confirm entries and exits by observing RSI behavior alongside EMAs. The optional divergence detection can act as a signal for potential exhaustion or reversal (not entry signals on their own). It is a Good fit for traders who use RSI zones, divergences, and EMA structure in their decision-making, both for intra-day and swing trades (where it performs best).
How to use
Add this script to your chart. EMAs will appear on the main price chart; RSI and divergence will appear in a separate pane.
Adjust RSI and MA settings to fit your trading style (e.g., fast RSI for scalping, slower for swing)
Enable "Show Divergence" if you want visual alerts and markers
Use alerts to get notified when a divergence occurs without watching the chart
Always check the divergences on different time frames to validate the setup, and do not consider them valid on small time frames (<15 minutes).
Built for traders who want both momentum and trend context in a single tool — without clutter, repainting, or noise. I created this script to streamline my own analysis and avoid switching between multiple indicators. It's not meant to be a "signal generator" but a visual assistant for making better decisions. If you find it useful or have feedback, feel free to reach out.