ALMA 20, 50, 200The ALMA (Arnaud Legoux Moving Average) crossover strategy uses two ALMA lines (fast and slow) to generate buy/sell signals, aiming to reduce lag and noise compared to traditional moving averages, and is often combined with volume filters for improved accuracy.
Here's a more detailed explanation:
What it is:
The ALMA indicator is a moving average (MA) variant designed to reduce lag and improve responsiveness while maintaining a smooth curve, using a Gaussian filter.
How it works:
ALMA calculates two moving averages, one from left to right and one from right to left, and then processes the output through a customizable formula for increased smoothness or responsiveness.
Crossover Strategy:
A common ALMA strategy involves using two ALMA lines with different lengths (fast and slow). A buy signal is generated when the fast ALMA crosses above the slow ALMA, and a sell signal when the fast ALMA crosses below the slow ALMA.
Benefits:
ALMA offers advantages like reduced lag, smoothness, and filtering capabilities, making it useful for identifying trends and potential reversals.
Potential Risks:
Like any indicator, ALMA can produce false signals, so it's crucial to combine it with other indicators and analyze price action.
Parameters:
ALMA has parameters like "Length" (number of periods), "Sigma" (filter's range, affecting responsiveness), and "Offset" (for accessing data of different candles).
Other uses:
ALMA can also be used for trend identification, dynamic support and resistance, and combined with other indicators to enhance trading strategies.
Moving Averages

Multi-Faceted Analysis ToolHere’s a detailed description for the **Multi-Faceted Analysis Tool** TradingView indicator:
---
## Multi-Faceted Analysis Tool
### Overview
The **Multi-Faceted Analysis Tool** is a powerful TradingView indicator designed to enhance your technical analysis by combining several popular indicators: Simple Moving Average (SMA), Relative Strength Index (RSI), and Moving Average Convergence Divergence (MACD). This indicator provides traders with insightful market signals that can be tailored to fit various trading strategies and timeframes.
### Key Features
1. **Simple Moving Average (SMA)**:
- Plots a customizable SMA on the price chart. The length of the SMA can be adjusted to suit your analysis needs (default is set to 50). The SMA helps identify the overall trend direction.
2. **Relative Strength Index (RSI)**:
- Calculates and plots RSI values, providing insights into potential overbought or oversold market conditions. The user can customize the length of the RSI calculation (default is 14).
- Overbought (70) and oversold (30) levels are visually marked, helping traders identify potential reversal points.
3. **MACD**:
- Computes MACD values with customizable parameters for fast length, slow length, and signal length (defaults are 12, 26, and 9 respectively).
- The MACD histogram is displayed, highlighting the difference between the MACD line and the signal line, which can help traders visualize momentum shifts.
4. **Buy and Sell Signals**:
- Generates clear buy and sell signals based on RSI crossover with established thresholds (buy when RSI crosses above 30, sell when RSI crosses below 70). These signals are visually represented on the chart for easy decision-making.
5. **User-Friendly Customization**:
- All parameters are adjustable, allowing traders to set their preferred values based on individual strategies or market conditions. This flexibility ensures that the tool can cater to a wide range of trading styles.

Smart Investor - Quarterly Earnings by tarunlalwani007OVERVIEW
Smart Investor - Quarterly Earnings displays comprehensive financial data and moving averages directly on your charts. It shows quarterly/yearly earnings alongside customizable moving averages across multiple timeframes, providing both fundamental and technical analysis in one tool.
This tool is designed purely for analysis purposes. No buy or sell recommendations should be made based solely on the information it provides. Always perform your own due diligence and combine multiple sources of information for trading decisions.
FEATURES
Financial Data Analysis
Displays quarterly (FQ) and yearly (FY) financial metrics
Works with both stocks and futures contracts
Customizable metrics with comparison capabilities
Flexible table positioning options
Multi-Timeframe Moving Averages
Daily, Weekly, and Monthly moving averages adapt to chart timeframe
Support for both EMA and SMA with customizable parameters
Color-coded for easy identification of different timeframes
Company Information Display
Information tags for quick company insights
Display key financial metrics and market performance indicators
SME status identification for small/medium enterprises (only for NSE and BSE India)
FNO and lot size information for derivatives
CALCULATION METHODS
Data Sources
Financial metrics (EPS, Sales, Total Shares) are sourced directly from TradingView's financial API
Price data is obtained using appropriate request functions for the current symbol
Header and Tag Calculations
Current Values: All header and tag metrics use the latest available close price
Market Cap: Latest Close Price × Total Outstanding Shares
Free Float Market Cap: Latest Close Price × Free Float Shares
Free Float Percentage: Obtained directly from TradingView financial data
P/E Ratio: Market Cap / TTM Net Income
52-Week Performance:
Down from 52W High: ((Current Close - 52W High) / 52W High) × 100
Up from 52W Low: ((Current Close - 52W Low) / 52W Low) × 100
Table Calculations
Historical Values: Table metrics use price data from the corresponding quarter/year
Quarter-over-Quarter (QoQ) Change: ((Current Value - Previous Quarter Value) / Previous Quarter Value) × 100
Year-over-Year (YoY) Change: ((Current Value - Value from Same Quarter Last Year) / Value from Same Quarter Last Year) × 100
Quarter names are determined based on the current month: Jan/Feb → Dec, Mar/Apr/May → Mar, Jun/Jul/Aug → Jun, Sep/Oct/Nov → Sep. Each quarter is labeled with its end month and year (e.g., "Mar-2024", "Jun-2024").
Moving Average Implementation
Moving Averages: Calculated based on chart timeframe (daily, weekly, monthly)
EMA/SMA: Uses standard formulas with configurable periods
Included with financial data to provide a complete analysis tool in a single indicator
CUSTOMIZATION OPTIONS
Financial Metrics
The following metrics can be selected for both quarterly and yearly tables:
Sales (Revenue)
EPS (Earnings Per Share)
OPM (Operating Profit Margin)
P/E Ratio
PEG Ratio
Free Float (percentage and value)
Market Cap
PAT (Profit After Tax)
Display Options
Comparison Visualization: Percentage mode, dots mode, or combined
Layout: Multiple table positions, adjustable text size
Themes: Light and dark theme support
History: Display up to 8 periods of historical data
Header Information
Company description
Market capitalization
Free float information
Listing year
Return on Equity (ROE)
Industry/Sector classification
Performance relative to 52-week high/low
FNO status and lot size
HOW TO USE
Add the indicator to your chart
Configure the metrics you want to display in the settings
Position the tables where you prefer on your chart
Customize colors and display options
Adjust moving averages to match your trading style
LIMITATIONS
Financial data availability depends on what TradingView provides for each instrument
Some calculations may show NA when underlying data is unavailable
Small market cap stocks or recently listed companies may have limited historical data
Futures contracts are detected automatically but may require manual verification
TECHNICAL NOTES
Automatic futures contract detection with calculation adjustments
SME status determined using an internal database of symbols that is manually maintained and updated
Date handling adjustments near quarter boundaries ensure consistency
All financial data is sourced directly from TradingView's financial API
Company description and sector information comes directly from TradingView symbol data

IBD Style Relative Strength RatingWelcome to the IBD Style Relative Strength Rating Indicator!
A powerful tool inspired by Investor's Business Daily (IBD), this indicator helps traders evaluate stock performance relative to a benchmark. It’s perfect for identifying strong or weak stocks compared to the broader market, specifically the S&P 500 (SPY). Whether you're a beginner or an experienced investor, this guide will walk you through its features and key concepts, including the RS Line and RS Rating, and how legendary trader Mark Minervini uses similar tools.
Understanding the RS Line & RS Rating
RS Line (Relative Strength Line)
A visual representation of how a stock’s price performs relative to SPY.
Calculated by dividing the stock’s closing price by SPY’s closing price and multiplying by 100.
Rising RS Line → Stock is outperforming SPY.
Falling RS Line → Stock is underperforming SPY.
Helps identify strength or weakness compared to the market.
RS Rating
A numerical score (1-99) measuring stock performance over 252 trading days (1 year) relative to SPY.
Above 80 → Top 20% of performers.
Above 90 → Top 10% (ideal for growth investors).
Weighted average of stock’s price changes over 63, 126, 189, and 252 days.
Key Features Explained
RS Line Color Mode:
Static (default white) or Dynamic (green when rising, red when falling) for quick trend identification.
Comparative Symbol:
Default: SPY. Can be changed to NASDAQ:NDX, AAPL, or other indices/stocks.
Ensure selected symbols have sufficient historical data.
Plot RS New Highs: Marks new 250-day highs with subtle blue circles
Indicates a stock significantly outperforming SPY (potential buy signal).
Plot RS New Lows: Marks new 250-day lows with red circles
Signals underperformance (possible sell or avoid indicator).
Lookback for Display: Adjustable up to 2000 bars for historical trend analysis.
RS Rating Color Scheme
Green: Upward trend (improving RS Rating).
Orange: Neutral/mixed trend.
Red: Downward trend (declining RS Rating).
Dynamic Color Settings
Rising Line Color: Green (default), customizable.
Falling Line Color: Red (default), adjustable.
Advanced Options
Enable Replay Mode: Uses fixed percentile values for consistent RS Rating calculations in backtesting.
RS Rating Table
Displays current RS Rating and values from previous day, week, and month in the top-right corner (daily charts).
Background color reflects trend: Green (up), Orange (neutral), Red (down).
Past values appear in neutral gray for a quick performance snapshot.
How Mark Minervini Uses This Indicator
Mark Minervini, a legendary trader, emphasizes Relative Strength as a core strategy:
Looks for stocks with:
Rising RS Line.
RS Rating above 80-90 (top performers).
RS New Highs to spot breakout candidates.
Avoids stocks with:
Declining RS Line.
RS Rating below 70.
Important Information for Beginners
RS vs. SPY
The indicator compares stock performance against SPY (S&P 500).
Rising RS Line → Stock is beating SPY.
Falling RS Line → Stock is lagging.
Why Use This Indicator?
Helps find strong relative strength stocks, crucial for bullish trends.
New highs/lows on the RS Line signal significant shifts.
The RS Rating quantifies percentile-based performance.
Customization Options
Adjust colors, lookback periods, and marker sizes to match your trading style.
Default SPY comparison is ideal for U.S. traders but can be customized.
Timeframe Considerations
Optimized for daily charts.
Weekly/monthly charts may have limited data availability.
Tips for Crypto Traders (Measuring Altcoins vs. Bitcoin or Total Market Cap)
If trading cryptocurrencies, this indicator can measure altcoins vs. Bitcoin (BTC) or the total crypto market cap (TOTAL):
Comparative Symbol Setup:
Set Comparative Symbol to BTCUSD to compare an altcoin (e.g., ETHUSD) against Bitcoin.
Rising RS Line → The altcoin is outperforming Bitcoin (bullish signal).
Use TOTAL (crypto market cap index) to assess an altcoin’s strength against the total market.
High RS Rating suggests the altcoin is a market leader.
Adjust Look-back Periods:
Crypto markets are volatile, so reduce Look-back for New Highs/Lows to 50-100 bars (about 2-4 months) for shorter-term trends.
Fine-tune based on your trading strategy.
New Highs and Lows:
Watch for new RS Line highs (blue dots) to identify altcoins breaking out against BTC or TOTAL (momentum trading).
New lows (red dots) may signal weakening altcoins to avoid.
RS Rating Interpretation:
Above 80 against BTC or TOTAL → The altcoin is a strong performer.
This aligns with Minervini’s growth strategy for stocks.
Color Dynamics:
Use Dynamic RS Line Color (green for rising, red for falling) to quickly spot altcoin trends against BTC or TOTAL.
Crypto data may have gaps—test indicator settings on different timeframes (e.g., 1-hour or 4-hour charts).
Tips for Getting Started
Apply the Indicator to a stock chart and set Comparative Symbol to SPY.
Watch the RS Line:
If trending upward with new highs and RS Rating > 80, it's a strong candidate.
Use the RS Rating Table to check for trend consistency.
Adjust Opacity Settings for markers to balance visibility and clarity.
This indicator is now ready for public use as of March 18, 2025. Enjoy trading with enhanced insights, and feel free to share feedback or suggestions for future updates!

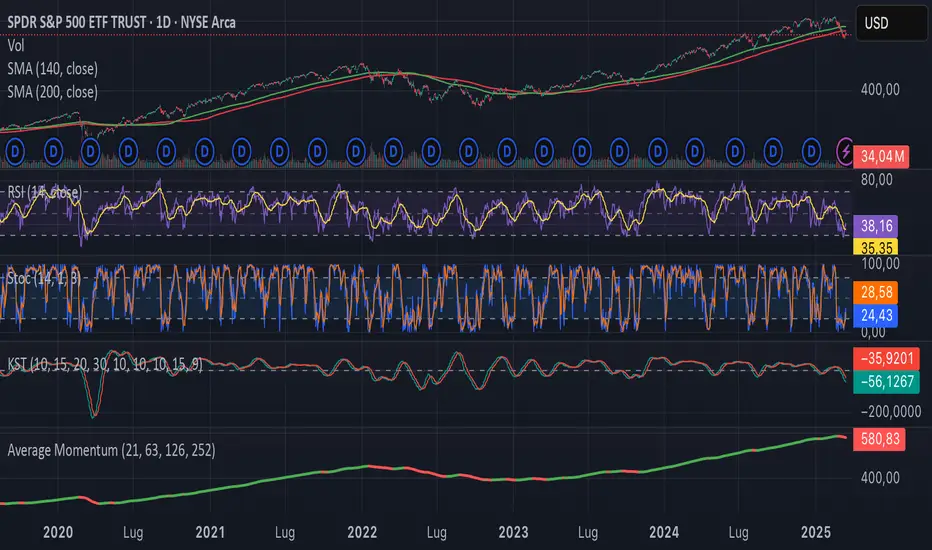
Average MomentumThis indicator will calculate for any given equity four values: the simple average of the indicated equity for a timeframe of one month, three months, six months for twelve months. Then the script will create the average value of those four averages and display it in red if the value decreases and green if it progresses. It is useful as an indicator to go risk off.
Uptrick: Acceleration ShiftsIntroduction
Uptrick: Acceleration Shifts is designed to measure and visualize price momentum shifts by focusing on acceleration —the rate of change in velocity over time. It uses various moving average techniques as a trend filter, providing traders with a clearer perspective on market direction and potential trade entries or exits.
Purpose
The main goal of this indicator is to spot strong momentum changes (accelerations) and confirm them with a chosen trend filter. It attempts to distinguish genuine market moves from noise, helping traders make more informed decisions. The script can also trigger multiple entries (smart pyramiding) within the same trend, if desired.
Overview
By measuring how quickly price velocity changes (acceleration) and comparing it against a smoothed average of itself, this script generates buy or sell signals once the acceleration surpasses a given threshold. A trend filter is added for further validation. Users can choose from multiple smoothing methods and color schemes, and they can optionally enable a small table that displays real-time acceleration values.
Originality and Uniqueness
This script offers an acceleration-based approach, backed by several different moving average choices. The blend of acceleration thresholds, a trend filter, and an optional extra-entry (pyramiding) feature provides a flexible toolkit for various trading styles. The inclusion of multiple color themes and a slope-based coloring of the trend line adds clarity and user customization.
Inputs & Features
1. Acceleration Length (length)
This input determines the number of bars used when calculating velocity. Specifically, the script computes velocity by taking the difference in closing prices over length bars, and then calculates acceleration based on how that velocity changes over an additional length. The default is 14.
2. Trend Filter Length (smoothing)
This sets the lookback period for the chosen trend filter method. The default of 50 results in a moderately smooth trend line. A higher smoothing value will create a slower-moving trend filter.
3. Acceleration Threshold (threshold)
This multiplier determines when acceleration is considered strong enough to trigger a main buy or sell signal. A default value of 2.5 means the current acceleration must exceed 2.5 times the average acceleration before signaling.
4. Smart Pyramiding Strength (pyramidingThreshold)
This lower threshold is used for additional (pyramiding) entries once the main trend has already been identified. For instance, if set to 0.5, the script looks for acceleration crossing ±0.5 times its average acceleration to add extra positions.
5. Max Pyramiding Entries (maxPyramidingEntries)
This sets a limit on how many extra positions can be opened (beyond the first main signal) in a single directional trend. The default of 3 ensures traders do not become overexposed.
6. Show Acceleration Table (showTable)
When enabled, a small table displaying the current acceleration and its average is added to the top-right corner of the chart. This table helps monitor real-time momentum changes.
7. Smart Pyramiding (enablePyramiding)
This toggle decides whether additional entries (buy or sell) will be generated once a main signal is active. If enabled, these extra signals act as filtered entries, only firing when acceleration re-crosses a smaller threshold (pyramidingThreshold). These signals have a '+' next to their signal on the label.
8. Select Color Scheme (selectedColorScheme)
Allows choosing between various pre-coded color themes, such as Default, Emerald, Sapphire, Golden Blaze, Mystic, Monochrome, Pastel, Vibrant, Earth, or Neon. Each theme applies a distinct pair of colors for bullish and bearish conditions.
9. Trend Filter (TrendFilter)
Lets the user pick one of several moving average approaches to determine the prevailing trend. The options include:
Short Term (TEMA)
EWMA
Medium Term (HMA)
Classic (SMA)
Quick Reaction (DEMA)
Each method behaves differently, balancing reactivity and smoothness.
10. Slope Lookback (slopeOffset)
Used to measure the slope of the trend filter over a set number of bars (default is 10). This slope then influences the coloring of the trend filter line, indicating bullish or bearish tilt.
Note: The script refers to this as the "Massive Slope Index," but it effectively serves as a Trend Slope Calculation, measuring how the chosen trend filter changes over a specified period.
11. Alerts for Buy/Sell and Pyramiding Signals
The script includes built-in alert conditions that can be enabled or configured. These alerts trigger whenever the script detects a main Buy or Sell signal, as well as extra (pyramiding) signals if Smart Pyramiding is active. This feature allows traders to receive immediate notifications or automate a trading response.
Calculation Methodology
1. Velocity and Acceleration
Velocity is derived by subtracting the closing price from its value length bars ago. Acceleration is the difference in velocity over an additional length period. This highlights how quickly momentum is shifting.
2. Average Acceleration
The script smooths raw acceleration with a simple moving average (SMA) using the smoothing input. Comparing current acceleration against this average provides a threshold-based signal mechanism.
3. Trend Filter
Users can pick one of five moving average types to form a trend baseline. These range from quick-reacting methods (DEMA, TEMA) to smoother options (SMA, HMA, EWMA). The script checks whether the price is above or below this filter to confirm trend direction.
4. Buy/Sell Logic
A buy occurs when acceleration surpasses avgAcceleration * threshold and price closes above the trend filter. A sell occurs under the opposite conditions. An additional overbought/oversold check (based on a longer SMA) refines these signals further.
When price is considered oversold (i.e., close is below a longer-term SMA), a bullish acceleration signal has a higher likelihood of success because it indicates that the market is attempting to reverse from a lower price region. Conversely, when price is considered overbought (close is above this longer-term SMA), a bearish acceleration signal is more likely to be valid. This helps reduce false signals by waiting until the market is extended enough that a reversal or continuation has a stronger chance of following through.
5. Smart Pyramiding
Once a main buy or sell signal is triggered, additional (filtered) entries can be taken if acceleration crosses a smaller multiplier (pyramidingThreshold). This helps traders scale into strong moves. The script enforces a cap (maxPyramidingEntries) to limit risk.
6. Visual Elements
Candles can be recolored based on the active signal. Labels appear on the chart whenever a main or pyramiding entry signal is triggered. An optional table can show real-time acceleration values.
Color Schemes
The script includes a variety of predefined color themes. For bullish conditions, it might use turquoise or green, and for bearish conditions, magenta or red—depending on which color scheme the user selects. Each scheme aims to provide clear visual differentiation between bullish and bearish market states.
Why Each Indicator Was Part of This Component
Acceleration is employed to detect swift changes in momentum, capturing shifts that may not yet appear in more traditional measures. To further adapt to different trading styles and market conditions, several moving average methods are incorporated:
• TEMA (Triple Exponential Moving Average) is chosen for its ability to reduce lag more effectively than a standard EMA while still reacting swiftly to price changes. Its construction layers exponential smoothing in a way that can highlight sudden momentum shifts without sacrificing too much smoothness.
• DEMA (Double Exponential Moving Average) provides a faster response than a single EMA by using two layers of exponential smoothing. It is slightly less smoothed than TEMA but can alert traders to momentum changes earlier, though with a higher risk of noise in choppier markets.
• HMA (Hull Moving Average) is known for its balance of smoothness and reduced lag. Its weighted calculations help track trend direction clearly, making it useful for traders who want a smoother line that still reacts fairly quickly.
• SMA (Simple Moving Average) is the classic baseline for smoothing price data. It offers a clear, stable perspective on long-term trends, though it reacts more slowly than other methods. Its simplicity can be beneficial in lower-volatility or more stable market environments.
• EWMA (Exponentially Weighted Moving Average) provides a middle ground by emphasizing recent price data while still retaining some degree of smoothing. It typically responds faster than an SMA but is less aggressive than DEMA or TEMA.
Alongside these moving average techniques, the script employs a slope calculation (referred to as the “Massive Slope Index”) to visually indicate whether the chosen filter is sloping upward or downward. This adds an extra layer of clarity to directional analysis. The indicator also uses overbought/oversold checks, based on a longer-term SMA, to help filter out signals in overstretched markets—reducing the likelihood of false entries in conditions where the price is already extensively extended.
Additional Features
Alerts can be set up for both main signals and additional pyramiding signals, which is helpful for automated or semi-automated trading. The optional acceleration table offers quick reference values, making momentum monitoring more intuitive. Including explicit alert conditions for Buy/Sell and Pyramiding ensures traders can respond promptly to market movements or integrate these triggers into automated strategies.
Summary
This script serves as a comprehensive momentum-based trading framework, leveraging acceleration metrics and multiple moving average filters to identify potential shifts in market direction. By combining overbought/oversold checks with threshold-based triggers, it aims to reduce the noise that commonly plagues purely reactive indicators. The flexibility of Smart Pyramiding, customizable color schemes, and built-in alerts allows users to tailor their experience and respond swiftly to valid signals, potentially enhancing trading decisions across various market conditions.
Disclaimer
All trading involves significant risk, and users should apply their own judgment, risk management, and broader analysis before making investment decisions.

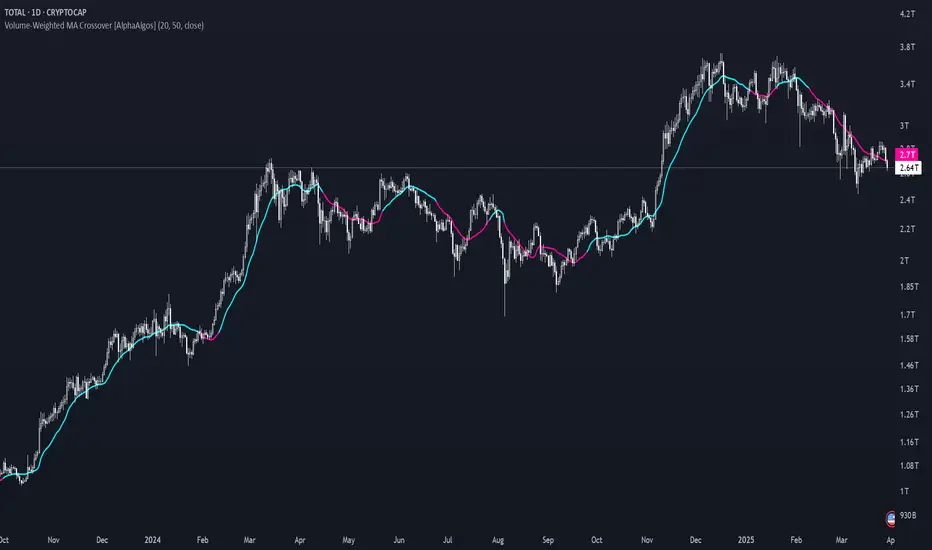
Volume-Weighted MA Crossover [AlphaAlgos]Volume-Weighted MA Crossover
Overview:
The Volume-Weighted MA Crossover is a sophisticated trend-following indicator designed to capture reliable trend reversals and trend continuation signals using volume and price action. By combining the power of Volume-Weighted Moving Averages (VWMA) and the simplicity of Simple Moving Averages (SMA) , this indicator provides a more robust and reliable trend filter. It ensures that trend signals are supported by strong market volume, offering a deeper insight into market strength and potential price movements.
How It Works:
The Volume-Weighted MA Crossover indicator calculates a Volume-Weighted Moving Average (VWMA) of the chosen price source (typically close ), which takes into account both the price and volume of each bar. This ensures that price movements with higher volume are weighted more heavily, providing a better reflection of actual market sentiment.
In conjunction with the VWMA, a traditional Simple Moving Average (SMA) is used to filter out noise and smooth price data, providing a more stable trend direction. The crossover between the VWMA and SMA serves as the primary trading signal:
Long Signal (Bullish Crossover) : The VWMA crosses above the SMA, indicating that a strong bullish trend is likely underway, supported by increased volume and price action.
Short Signal (Bearish Crossover) : The VWMA crosses below the SMA, signaling that a bearish trend is emerging, backed by decreasing volume and price reversal.
The Volume-Weighted MA Crossover can be used as a standalone indicator or in conjunction with other tools to enhance your trading strategy, offering both trend-following and volume confirmation.
Key Features:
Volume Sensitivity : The VWMA adjusts the moving average based on volume, providing a more accurate representation of price action during high-volume periods. This makes the indicator more sensitive to market dynamics, ensuring that price movements during significant volume spikes are prioritized.
Trend Confirmation : The crossover of the VWMA and SMA offers clear and actionable signals, helping traders identify trend reversals early and with more confidence.
Clean Signal Presentation : With color-coded signal markers , this indicator makes it easy to spot actionable entry points.
Customizable Settings : Tailor the VWMA and SMA periods, volume multiplier, and source price according to your preferred market conditions and timeframes, allowing the indicator to fit your trading style.
How to Use It:
Trend Direction : Look for crossovers between the VWMA and SMA to identify potential trend changes:
Volume Confirmation : The volume-weighted aspect of this indicator ensures that trends are confirmed by volume. A bullish trend with a VWMA crossing above the SMA suggests that the upward movement is supported by strong market sentiment (high volume). Conversely, a bearish trend with a VWMA crossing below the SMA indicates a reversal is supported by volume reduction.
Trend Continuation & Reversal : This indicator works particularly well during strong trending markets. However, it can also identify potential reversals, particularly during periods of high volume and rapid price changes.
Best Timeframe to Use:
This indicator is adaptable to multiple timeframes and can be used across various market types. However, it tends to work most effectively on medium to long-term charts (such as 1-hour, 4-hour, and daily charts) where trends have the potential to develop more clearly and with more volume participation.
Ideal for:
Trend-following traders looking for reliable signals that are confirmed by both price action and volume.
Swing traders who want to enter trades at the beginning of a new trend or after a confirmed trend reversal.
Day traders seeking clear and easy-to-read signals on intra-day charts, helping to pinpoint optimal entry and exit points during volatile market conditions.
Conclusion:
The Volume-Weighted MA Crossover is an essential tool for any trader looking to improve their trend-following strategy. By incorporating both volume and price action into a VWMA and SMA crossover , it offers a more refined approach to identifying and confirming trends. Whether you're a trend follower , swing trader , or day trader , this indicator provides clear, actionable signals backed by volume confirmation, giving you the confidence to execute your trades with precision.
Alpha Wave System @DaviddTechAlpha Wave DaviddTech System by DaviddTech is an advanced, meticulously engineered trading indicator adhering strictly to the DaviddTech methodology. Rather than simply combining popular indicators, Alpha Wave strategically integrates specially-selected technical components—each optimized to enhance their combined strengths while neutralizing individual weaknesses, providing traders with clear, consistent, and high-probability trading signals.
Valid Setup:
🎯 Why This Combination Matters:
Quantum Adaptive Moving Average (Baseline):
This advanced adaptive MA provides superior responsiveness to market shifts by dynamically adjusting its sensitivity, clearly indicating the primary market direction and reducing lag compared to standard moving averages.
WavePulse Indicator (CoralChannel-based Confirmation #1):
Precisely detects shifts in momentum and price acceleration, allowing traders to anticipate trend continuation or reversals effectively, significantly enhancing trade accuracy.
Quantum Channel (G-Channel-based Confirmation #2):
Dynamically captures price volatility ranges, offering reliable trend structure validation and clear support/resistance channels, further increasing signal reliability.
Momentum Density (Volatility Filter):
Ensures traders enter only during optimal volatility conditions by quantifying momentum intensity, effectively filtering out low-quality, low-momentum scenarios.
Dynamic ATR-based Trailing Stop (Exit System):
Automatically manages trade exits with optimized ATR-based stop levels, systematically securing profits while effectively managing risk.
These meticulously integrated components reinforce each other's strengths, providing traders with a robust, disciplined, and clearly structured approach aligned with the DaviddTech methodology.
🔥 Latest Update – Enhanced BUY & SELL Signals:
Alpha Wave now clearly displays automated BUY and SELL signals directly on your chart, coupled with a comprehensive dashboard table for immediate signal validation. Signals appear only when all components—including baseline, confirmations, and volatility—are in alignment, significantly improving trade accuracy and confidence.
📌 How Traders Benefit from the New Signals:
BUY Signal: Execute long trades when Quantum Adaptive MA signals bullish, confirmed by bullish WavePulse momentum, bullish Quantum Channel structure, and strong Momentum Density readings.
SELL Signal: Clearly marked for entering short positions under bearish market conditions verified through Quantum Adaptive MA, WavePulse bearish momentum, Quantum Channel confirmation, and sufficient Momentum Density.
Signal Validation: A dedicated dashboard provides immediate visual strength metrics, allowing traders to quickly validate signals before execution, significantly enhancing trading discipline and consistency.
📊 Recommended DaviddTech Trading Plan:
Baseline: Determine overall market direction using Quantum Adaptive MA. Only trade in the indicated baseline direction.
Confirmations: Validate potential entries with WavePulse and Quantum Channel alignment.
Volatility Filter: Confirm sufficient market volatility with Momentum Density before entry.
Trailing Stop Loss: Manage risk and secure profits using the dynamic ATR-based trailing stop system.
Entries & Exits: Only execute trades when signals and dashboard components unanimously align.
🖼️ Visual Examples:
Alpha Wave by DaviddTech clearly demonstrates how an intelligently integrated system provides significantly superior trading insights compared to standalone indicators, ensuring precise, disciplined, and profitable market entries and exits across all trading environments.

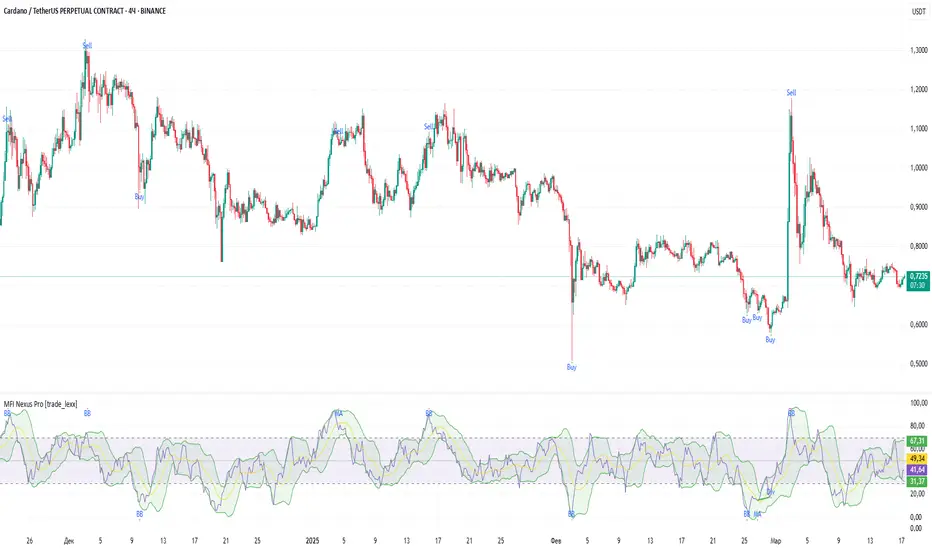
MFI Nexus Pro [trade_lexx]📈 MFI Nexus Pro is your reliable trading assistant!
📊 What is MFI Nexus Pro ?
MFI Nexus Pro is a trading indicator that analyzes cash flows in the market. It shows where money is moving — into or out of an asset, and based on this, generates buy or sell signals.
💡 The main components of the indicator
📊 The MFI Cash Flow Index (MFI)
shows the strength of cash flow into an asset. Values above 70 indicate overbought (an early sale is possible), and values below 30 indicate oversold (an early purchase is possible).
📈 Moving Averages (MA)
The indicator uses 10 different types of moving averages to smooth the MFI line.:
- SMA: Simple moving average
- EMA: Exponential moving average
- WMA: Weighted moving average
And other more complex types (HMA, KAMA, VWMA, ALMA, TEMA, ZLEMA, DEMA)
The choice of the type of moving average affects the speed of the indicator's response to market changes.
🎯 Bollinger Bands (BB)
Bands around the moving average that widen and narrow depending on volatility. They help determine when the MFI is out of the normal range.
🔄 Divergences
Divergences show discrepancies between price and MFI:
- Bullish divergence: the price is falling and the MFI is rising — an upward reversal is possible
- Bearish divergence: the price is rising and the MFI is falling — a downward reversal is possible
🔍 Indicator signals
1️⃣ Moving average signals (MA)
Buy signal
- What happens: MFI crosses its moving average from bottom to top
- What does it look like: the green triangle labeled "MA" under the chart
- What does it mean: money begins to actively flow into the asset, price growth is possible
Sell signal
- What happens: the MFI crosses the moving average from top to bottom
- What does it look like: a red triangle with the label "MA" above the chart
- What does it mean: money starts to leave the asset, the price may fall
2️⃣ Bollinger Band Signals (BB)
Buy signal
- What's happening: The MFI crosses the lower Bollinger band from bottom to top
- What it looks like: the green triangle marked "BB"
- What it means: The MFI was too low and is now starting to recover
Sell Signal
- What's going on: MFI crosses the upper Bollinger band from top to bottom
- What it looks like: a red triangle marked "BB"
- What it means: The MFI was too high and is now starting to decline
3️⃣ Divergence Signals (Div)
Buy Signal (Bullish Divergence)
- What's going on: the price is falling more than the MFI
- What it looks like: a green triangle marked "Div"
- What it means: despite the fall in price, money is already starting to return to the asset
Sell signal (bearish divergence)
- What is happening: the price is rising more strongly than the MFI
- What does it look like: the red triangle with the label "Div"
- What does it mean: despite the price increase, money is already starting to leave the asset
🛠️ Filters to filter out false signals
1️⃣ Minimum distance between the signals
- What it does: sets the minimum number of candles between signals
- Why it is needed: prevents signals from being too frequent during strong market fluctuations
- How to set it up: Set the number from 0 and above (default: 5)
2️⃣ "Waiting for the opposite signal" mode
- What it does: waits for a signal in the opposite direction before generating a new signal
- Why you need it: it helps you not to miss important trend reversals
- How to set up: just turn the function on or off
3️⃣ Filter by MFI levels
- What it does: generates signals only when the MFI is in the specified ranges
- Why it is needed: it helps to catch the moments when the market is oversold or overbought
- How to set up:
- For buy signals: set a range for oversold (e.g. 1-30)
- For sell signals: set a range for overbought (e.g. 70-100)
4️⃣ The RSI filter
- What it does: additionally checks the RSI values to confirm the signals
- Why it is needed: adds additional confirmation from another popular indicator
- How to set up: Similar to the MFI filter, set ranges for buying and selling
🔄 Signal combination modes
1️⃣ Normal mode ("None")
- How it works: all signals (MA, BB, Div) work independently of each other
- When to use it: for general market analysis or when learning how to work with the indicator
2️⃣ "And" mode ("MA and BB and Div")
- How it works: the alarm appears only when several conditions are triggered simultaneously
- Combination options:
- MA+BB: signals from the moving average and Bollinger bands
- MA+Div: signals from the moving average and divergence
- BB+Div: signals from the Bollinger bands and divergence
- MA+BB+Div: all three signals simultaneously
- When to use: for more reliable but rare signals
3️⃣ "OR" mode ("MA or BB or Div")
- How it works: the alarm appears when any of the conditions are triggered
- When to use: for frequent signals when you don't want to miss any opportunity.
🔌 Connecting to trading strategies
The indicator can be connected to your trading strategies using 5 different channels.:
1. Channel for MA signals: connects only signals from moving averages
2. BB signal channel: connects only the signals from the Bollinger bands
3. Channel for divergence signals: connects only divergence signals
4. Channel for "And" mode: connects only combined signals
5. Channel for "OR" mode: connects signals from any source
🔔 Setting up alerts
The indicator can send alerts when alarms appear.:
- Alerts for MA: when the MFI crosses the moving average
- Alerts for BB: when the MFI crosses the Bollinger bands
- Divergence alerts: when a divergence is detected
- Combined alerts: for "AND" and "OR" modes
🎭 What does the indicator look like on the chart ?
- MFI main line: purple line
- Overbought/oversold levels: horizontal lines at levels 30 and 70
- Middle line: dotted line at level 50
- MFI Moving Average: yellow line
- Bollinger bands: green lines around the moving average
- Signals: green and red triangles with corresponding labels
📚 How to start using MFI Nexus Pro
1️⃣ Initial setup
- Add an indicator to your chart
- Select the type of moving average and the period (you can leave it as the default)
- Activate the desired signal types (MA, BB, Div)
2️⃣ Filter settings
- Set the distance between the signals to get rid of unnecessary noise
- Adjust the MFI and RSI levels depending on how volatile your asset is
- If you need more reliable signals, turn on the "Waiting for the opposite signal" mode.
3️⃣ Operation mode selection
- First, use the standard mode to see all possible signals.
- When you get comfortable, try the "And" mode for more reliable signals.
- For active trading, you can use the "OR" mode
4️⃣ Setting up Alerts
- Select the types of signals you want to be notified about
- Set up alerts for "AND" or "OR" modes if you use them
5️⃣ Verification and adaptation
- Check the operation of the indicator on historical data
- Adjust the parameters for a specific asset
- Adapt the settings to your trading style
🌟 Usage examples
For trend trading
- Use MA signals in the direction of the main trend
- Turn on the "Waiting for the opposite signal" mode
- Set stricter levels for filters
For trading in a sideways range
- Use BB signals to detect bounces from the range boundaries
- Use the MFI level filter to confirm overbought/oversold conditions
- Adjust the Bollinger bands according to the width of the range
To determine the pivot points
- Pay attention to the divergence signals
- Use the "And" mode by combining divergences with other signals
- Check the RSI filter for additional confirmation
Logarithmic Regression Channel-Trend [BigBeluga]
This indicator utilizes logarithmic regression to track price trends and identify overbought and oversold conditions within a trend. It provides traders with a dynamic channel based on logarithmic regression, offering insights into trend strength and potential reversal zones.
🔵Key Features:
Logarithmic Regression Trend Tracking: Uses log regression to model price trends and determine trend direction dynamically.
f_log_regression(src, length) =>
float sumX = 0.0
float sumY = 0.0
float sumXSqr = 0.0
float sumXY = 0.0
for i = 0 to length - 1
val = math.log(src )
per = i + 1.0
sumX += per
sumY += val
sumXSqr += per * per
sumXY += val * per
slope = (length * sumXY - sumX * sumY) / (length * sumXSqr - sumX * sumX)
average = sumY / length
intercept = average - slope * sumX / length + slope
Regression-Based Channel: Plots a log regression channel around the price to highlight overbought and oversold conditions.
Adaptive Trend Colors: The color of the regression trend adjusts dynamically based on price movement.
Trend Shift Signals: Marks trend reversals when the log regression line cross the log regression line 3 bars back.
Dashboard for Key Insights: Displays:
- The regression slope (multiplied by 100 for better scale).
- The direction of the regression channel.
- The trend status of the logarithmic regression band.
🔵Usage:
Trend Identification: Observe the regression slope and channel direction to determine bullish or bearish trends.
Overbought/Oversold Conditions: Use the channel boundaries to spot potential reversal zones when price deviates significantly.
Breakout & Continuation Signals: Price breaking outside the channel may indicate strong trend continuation or exhaustion.
Confirmation with Other Indicators: Combine with volume or momentum indicators to strengthen trend confirmation.
Customizable Display: Users can modify the lookback period, channel width, midline visibility, and color preferences.
Logarithmic Regression Channel-Trend is an essential tool for traders who want a dynamic, regression-based approach to market trends while monitoring potential price extremes.

Renz-GPT IndicatorThe Renz-GPT Indicator is a powerful, all-in-one trading tool designed to simplify decision-making and improve trade accuracy using a combination of trend, momentum, and volume analysis.
🔍 How It Works
Trend Detection:
Uses two EMAs (Exponential Moving Averages) to identify the current market trend.
A higher timeframe EMA acts as a trend filter to align trades with the larger market trend.
Momentum Confirmation:
RSI (Relative Strength Index) confirms the momentum strength.
Only takes trades when the momentum aligns with the trend.
Volume Confirmation:
Uses On-Balance Volume (OBV) to verify if volume supports the trend direction.
Signal Calculation:
Combines trend, momentum, and volume signals to create a high-probability trade setup.
Filters out weak signals to avoid false trades.
Entry, Stop Loss & Take Profit:
Displays clear LONG and SHORT markers on the chart.
Automatically calculates and displays Stop Loss and Take Profit levels based on ATR (Average True Range).
Alerts:
Sends real-time alerts when a valid buy or sell signal occurs.
Alerts include entry price, stop loss, and take profit levels.

Moving Averages By MoneyTribe21This custom indicator displays three Smoothed Moving Averages (SMAs) designed to help traders identify market trends, potential reversals, and key support/resistance levels. It is ideal for trend-following strategies, momentum trading, and confirming price direction in various timeframes.
Three Smoothed Moving Averages to track short-term, mid-term, and long-term trends:
21-Day SMA: Captures short-term price momentum and trend direction.
50-Day SMA: Represents the mid-term trend, often used as dynamic support/resistance.
200-Day SMA: The long-term trend filter, commonly watched by institutional traders.
Fully Customizable Settings
Adjust period length for each SMA to fit your strategy.
Modify line colors, thickness, and styles for better visibility.
Enable/disable specific SMAs based on preference.
Works Across All Markets
Compatible with Forex, Stocks, Commodities, Crypto, and Indices.
Supports multiple timeframes (1M, 5M, 1H, Daily, Weekly, etc.)

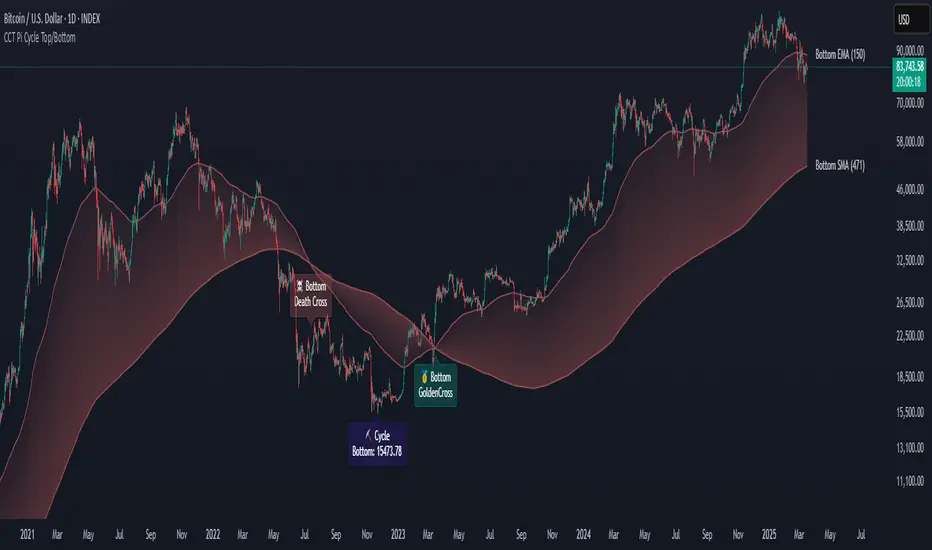
CCT Pi Cycle Top/BottomPi Cycle Top/bottom: The Ultimate Market Cycle Indicator
Introduction
The Pi Cycle Top/bottom Indicator is one of the most reliable tools for identifying Bitcoin market cycle peaks and bottoms. Its effectiveness lies in the strategic combination of moving averages that historically align with major market cycle reversals. Unlike traditional moving average crossovers, this indicator applies an advanced iterative approach to pinpoint price extremes with higher accuracy.
This version, built entirely with Pine Script™ v6, introduces unprecedented precision in detecting both the Pi Cycle Top and Pi Cycle Bottom, eliminating redundant labels, optimizing visual clarity, and ensuring the indicator adapts dynamically to evolving market conditions.
What is the Pi Cycle Theory?
The Pi Cycle Top and Pi Cycle Bottom were originally introduced based on a simple yet profound discovery: key moving average crossovers consistently align with macro market tops and bottoms.
Pi Cycle Top: The crossover of the 111-day Simple Moving Average (SMA) and the 350-day SMA multiplied by 2 has historically signaled market tops with astonishing accuracy.
Pi Cycle Bottom: The intersection of the 150-day Exponential Moving Average (EMA) and the 471-day SMA has repeatedly marked significant market bottoms.
While traditional moving average strategies often suffer from lag and false signals, the Pi Cycle Indicator enhances accuracy by applying a range-based scanning methodology, ensuring that only the most critical reversals are detected.
How This Indicator Works
Unlike basic moving average crossovers, this script introduces a unique iteration process to refine the detection of Pi Cycle points. Here’s how it works:
Detecting Crossovers:
Identifies the Golden Cross (bullish crossover) and Death Cross (bearish crossover) for both the Pi Cycle Top and Pi Cycle Bottom.
Iterating Through the Cycle:
Instead of plotting a simple crossover point, this script scans the range between each Golden and Death Cross to identify the absolute lowest price (Pi Cycle Bottom) and highest price (Pi Cycle Top) within that cycle.
Precision Labeling:
The indicator dynamically adjusts label positioning:
If the price at the crossover is below the fast moving average → the label is placed on the moving average with a downward pointer.
If the price is above the fast moving average → the label is placed below the candle with an upward pointer.
This ensures optimal visibility and prevents misleading signal placement.
Advanced Pine Script v6 Features:
Labels and moving average names are only shown on the last candle, reducing chart noise while maintaining clarity.
Offers full user customization, allowing traders to toggle:
Pi Cycle Top & Bottom visibility
Moving average labels
Crossover labels
Why This Indicator is Superior
This script is not just another moving average crossover tool—it is a market cycle tracker designed for long-term investors and analysts who seek:
✔ High-accuracy macro cycle identification
✔ Elimination of false signals using an iterative range-based scan
✔ Automatic detection of market extremes without manual adjustments
✔ Optimized visuals with smart label positioning
✔ First-of-its-kind implementation using Pine Script™ v6 capabilities
How to Use It?
Bull Market Tops:
When the Pi Cycle Top indicator flashes, consider the potential for a market cycle peak.
Historically, Bitcoin has corrected significantly after these signals.
Bear Market Bottoms:
When the Pi Cycle Bottom appears, it suggests a macro accumulation phase.
These signals have aligned perfectly with historical cycle bottoms.
Final Thoughts
The Pi Cycle Top/bottom Indicator is a must-have tool for traders, investors, and analysts looking to anticipate long-term trend reversals with precision. With its refined methodology, superior label positioning, and cutting-edge Pine Script™ v6 optimizations, this is the most reliable version ever created.
Smart MA CrossoverThe Smart MA Crossover indicator is a trend-following tool designed to help traders identify high-probability buy and sell signals based on a dynamic moving average and volume confirmation.
This indicator allows traders to customize the moving average type (SMA, EMA, HMA, WMA, VWMA, SMMA, or VWAP) while incorporating an ATR-based filter for better signal clarity.
How It Works
The script analyzes price movements in relation to a selected moving average and volume conditions to generate trend-based trade signals:
🟢 Buy Signal:
- Price is trading above the moving average for at least two bars.
- A sudden upward momentum is detected (price > open * 1.005).
- Volume is higher than the 50-period SMA of volume.
- The price was trading below the moving average three bars ago.
🔴 Sell Signal:
- Price is trading below the moving average for at least two bars.
- A sudden downward movement is detected (price < open * 0.995).
- Volume is higher than the 50-period SMA of volume.
- The price was trading above the moving average three bars ago.
- When these conditions are met, a label appears on the chart, marking the potential trade signal.
Key Features
- Customizable Moving Averages – Choose between SMA, EMA, HMA, WMA, VWMA, SMMA, or VWAP.
- Dynamic Trend Detection – Moving average color changes based on trend direction.
- Volume Confirmation – Avoid false signals by filtering trades using SMA-based volume analysis.
- ATR-Based Signal Placement – Labels are positioned dynamically based on ATR values to improve visibility.
- Background Trend Highlighting – The background changes color depending on whether price is above (green) or below (red) the moving average.
- Alerts for Buy & Sell Signals – Get real-time notifications when a trade signal is generated.
How to Use
- This indicator is best suited for trend-following strategies and works across different markets, including stocks, forex, and crypto.
- It can be used on multiple timeframes, but traders should combine it with additional analysis to refine trade decisions.
- ATR-based signal placement ensures that buy/sell labels do not clutter the chart.
Important Notes
- This indicator does not predict future price movements—it is a trend-based tool meant to assist with trade decisions.
- No financial advice – Always use risk management when trading.
- TradingView users who do not read Pine Script can still fully utilize this script thanks to clear labels and alerts.
Best MA Pair Finder (Crossover Strategy)This indicator automatically identifies the optimal pair of moving averages (MAs) for a crossover strategy using all available historical data. It offers several MA options—including SMA, EMA, and TEMA—allowing users to select the desired type in the settings. The indicator supports two strategy modes: “Long Only” and “Buy & Sell”, which can be chosen via the options.
For each MA pair combination, the indicator performs a backtest and calculates the profit factor, considering only those pairs where the total number of trades meets or exceeds the user-defined "Minimum Trades" threshold. This parameter ensures that the selected optimal pair is based on a statistically meaningful sample rather than on a limited number of trades.
The results provided by this indicator are based on historical data and backtests, which may not guarantee future performance. Users should conduct their own analysis and use proper risk management before making trading decisions.

20 Day Moving Average with Profit TargetsThis Pine Script indicator plots a 20-day simple moving average (SMA) on the chart and displays profit target labels relative to an initial buy price.
The script allows the user to input a custom buy price and calculates profit levels at 10%, 20%, 30%, and 50% above the buy price. Labels are shown on the last bar of the chart for each profit level and the buy price, with the labels offset to the right to avoid overlapping with the price action.
The labels are color-coded based on the profit levels, and the buy price label is blue.

ROC + SMI Auto Adjust
This indicator combines the Rate of Change (ROC) and the Stochastic Momentum Index (SMI) with automatically adjusted parameters for different time frames (short, medium, long). It normalizes the ROC to match the SMI levels, displays the ROC as a histogram and the SMI as lines, highlights overbought/oversold zones and includes a settings table. Ideal for analyzing momentum on different time frames.
Key Features:
Automatic Parameter Adjustment:
The script detects the current chart time frame (e.g. 1-minute, 1-hour, daily) and adjusts the parameters for the ROC and SMI accordingly.
Parameters such as ROC length, SMI length and smoothing periods are optimized for short, medium and long term time frames.
Rate of Change (ROC):
ROC measures the percentage change in price over a specified period.
The script normalizes the ROC values to match the SMI range, making it easier to compare the two indicators on the same scale.
The ROC is displayed as a histogram, where positive values are colored green and negative values are colored red.
Stochastic Momentum Index (SMI):
SMI is a momentum oscillator that identifies overbought and oversold conditions.
The script calculates the SMI and its signal line, plotting them on the chart.
Overbought and oversold levels are displayed as dotted lines for convenience.
SMI and SMI Signal Crossover:
When the main SMI crosses the signal line from below upwards, it may be a buy signal (bullish signal).
When the SMI crosses the signal line from above downwards, it may be a sell signal (bearish signal).
Configurable Inputs:
Users can use the automatically adjusted settings or manually override the parameters (e.g. ROC length, SMI length, smoothing periods).
Overbought and oversold levels for SMI are also configurable.
Parameter Table:
A table is displayed on the chart showing the current parameters (e.g. timeframe, ROC length, SMI length) for transparency and debugging.
The position of the table is configurable (e.g. top left, bottom right).
How it works:
The script first detects the chart timeframe and classifies it as short-term (e.g. 1M, 5M), medium-term (e.g. 1H, 4H) or long-term (e.g. D1, W1).
Based on the timeframe, it sets default values for the ROC and SMI parameters.
ROC and SMI are calculated and normalized so that they can be compared on the same scale.
ROC is displayed as a histogram, while SMI and its signal line are displayed as lines.
Overbought and oversold levels are displayed as horizontal lines.
Use cases:
Trend identification: ROC helps to identify the strength of the trend, while SMI indicates overbought/oversold conditions.
Momentum analysis: The combination of ROC and SMI provides insight into both price momentum and potential reversals.
Time frame flexibility: The auto-adjustment feature makes the script suitable for scalping (short-term), swing trading (medium-term) and long-term investing.

Bayesian AverageThis indicator calculates a statistically informed average of the price data using the Bayesian update rule. It overlays directly on the price chart of the trading instrument.
Inputs:
* Length: An integer input (default is 20) that determines the period over which the rolling mean and variance of the closing prices are calculated. This essentially sets the lookback window for recent price action.
* Prior Mean: A floating-point number input (default is 0.0) representing the initial guess or prior belief about the average price of the asset before observing any price data within the specified Length.
* Prior Variance: A floating-point number input (default is 1.0) that quantifies the uncertainty associated with the Prior Mean. A higher value indicates less confidence in the initial guess.
Calculations:
* Rolling Mean and Variance: The script first computes the simple moving average (rollingMean) and the sample variance (rollingVariance) of the closing price using the ta.sma and ta.variance functions over the length period.
* Bayesian Update: The indicator then applies the Bayesian update formulas to combine the prior beliefs with the information extracted from the recent price data:
* Posterior Variance: This value represents the updated uncertainty about the average price after considering the recent price fluctuations. It is calculated by combining the inverse of the Prior Variance with the precision of the data (number of observations divided by the Rolling Variance).
* Posterior Mean (Bayesian Average): This is the main output of the indicator. It represents the refined estimate of the average price, taking into account both the initial Prior Mean and the information from the Rolling Mean and Rolling Variance. The formula weights the Prior Mean and the Rolling Mean based on their respective precisions (inverse of their variances).
Plotting:
* Bayesian Average (Blue Line): The indicator plots the calculated posteriorMean, which is the Bayesian average of the price, as a blue line on the chart.
* Rolling Mean (Gray Line - Optional): For comparison, the script optionally plots the traditional simple moving average (rollingMean) as a gray line.
* Prior Mean (Dotted Red Line - Optional): A horizontal line representing the initial priorMean is optionally drawn on the chart as a red dotted line, serving as a reference.
* Posterior Variance (Orange Line - Optional): The posteriorVariance, representing the uncertainty, is also optionally plotted as an orange line.
In essence, this indicator attempts to provide a more statistically sound and potentially smoother representation of the average price by blending an initial belief with observed market data. The Prior Mean and Prior Variance allow users to incorporate their existing knowledge or assumptions into the calculation, while the Bayesian update mechanism adjusts these beliefs based on the recent price action.

Support & Resistance + EMA + Swing SL (3 Min)### **📌 Brief Description of the Script**
This **Pine Script indicator** for TradingView displays **Support & Resistance levels, EMAs (21 & 26), and Swing High/Low-based Stop-Loss (SL) points** on a **3-minute timeframe**.
---
### **🔹 Key Features & Functionality**
1️⃣ **🟥 Support & Resistance Calculation:**
- Finds the **highest & lowest price over the last 50 candles**
- Plots **Resistance (Red) & Support (Green) levels**
2️⃣ **📈 EMA (Exponential Moving Averages):**
- **21 EMA (Blue)** and **26 EMA (Orange)** for trend direction
- Helps in identifying bullish or bearish momentum
3️⃣ **📊 Swing High & Swing Low Detection:**
- Identifies **Swing Highs (Higher than last 5 candles) as SL for Short trades**
- Identifies **Swing Lows (Lower than last 5 candles) as SL for Long trades**
- Plots these levels as **Purple (Swing High SL) & Yellow (Swing Low SL) dotted lines**
4️⃣ **📌 Labels on Swing Points:**
- **"HH SL"** is placed on Swing Highs
- **"LL SL"** is placed on Swing Lows
5️⃣ **⚡ Breakout Detection:**
- Detects if **price crosses above Resistance** (Bullish Breakout)
- Detects if **price crosses below Support** (Bearish Breakout)
- Background color changes to **Green (Bullish)** or **Red (Bearish)**
6️⃣ **🚨 Alerts for Breakouts:**
- Sends alerts when **price breaks above Resistance or below Support**
---
### **🎯 How to Use This Indicator?**
- **Trade with Trend:** Follow **EMA crossovers** and Support/Resistance levels
- **Set Stop-Loss:** Use **Swing High as SL for Shorts** & **Swing Low as SL for Longs**
- **Look for Breakouts:** Enter trades when price **crosses Resistance or Support**
This script is **ideal for scalping & intraday trading** in a **3-minute timeframe** 🚀🔥
Let me know if you need **any modifications or improvements!** 📊💹

EZ_Algo Copyright label
This script overlays a fully adjustable watermark on your chart, featuring:
A bold Main Title (e.g., your brand or name) and Subtitle (e.g., a tagline or ID).
Optional extras like a copyright notice, logo symbol, warning message, and chart info (symbol, timeframe, timestamp, or close price).
A subtle repeating overlay pattern to deter theft.
Flexible positioning, sizing, and color options to match your vib
e
It’s built for traders who want to protect their charts and make them stand out, all in a few clicks.
How to Use It
Add to Chart: Click "Add to Chart" and watch the default watermark appear (e.g., "EZ ALGO" at the top).
Customize It:
Main Title: Set your brand (e.g., "EZ ALGO") under "Main Title". Tweak color, size, and alignment.
Subtitle: Add a tagline (e.g., "Algo Trading") and trader ID (e.g., "@EZ_Algo
") with matching style options.
Text Opacity: Adjust "Text Opacity" in "Appearance" to control title and subtitle transparency (0 = solid, 100 = invisible).
Chart Info: Toggle "Show Chart Info" to display symbol and timestamp, or add "Show Close Price" for extra data.
Extras: Enable "Show Copyright" for a © notice, "Show Logo" for a symbol (e.g., ★), or "Show Warning" to shout "DO NOT COPY".
Overlay Pattern: Turn on "Show Overlay Pattern" to repeat a phrase (e.g., "EZ Algo") across the chart.
Positioning: Pick vertical/horizontal spots (top, middle, bottom; left, center, right) or try "Randomize Main Position" for a surprise placement.
Appearance: Set a "Background Color" and "Background Opacity" for the watermark’s backdrop.
Cell Size: Adjust "Cell Width (%)" and "Cell Height (%)" to resize the watermark (0 = auto-fit).
Apply & Share: Hit "OK" to save settings, then screenshot or share your branded chart with confidence!
Tips
Use a semi-transparent background (e.g., 50 opacity) to keep the chart readable.
Experiment with "Randomize Main Position" for a dynamic look.
Pair a bold logo with a faint overlay pattern for max branding power.
Credits
Inspired by @KristaKT
thanks for the great ideas!
Enjoy marking your charts with flair and protection! Questions? Drop a comment below.

[F.B]_ZLEMA MACD ZLEMA MACD – A Zero-Lag Variant of the Classic MACD
Introduction & Motivation
The Moving Average Convergence Divergence (MACD) is a standard indicator for measuring trend strength and momentum. However, it suffers from the latency of traditional Exponential Moving Averages (EMAs).
This variant replaces EMAs with Zero Lag Exponential Moving Averages (ZLEMA), reducing delay and increasing the indicator’s responsiveness. This can potentially lead to earlier trend change detection, especially in highly volatile markets.
Calculation Methodology
2.1 Zero-Lag Exponential Moving Average (ZLEMA)
The classic EMA formula is extended with a correction factor:
ZLEMA_t = EMA(2 * P_t - EMA(P_t, L), L)
where:
P_t is the closing price,
L is the smoothing period length.
2.2 MACD Calculation Using ZLEMA
MACD_t = ZLEMA_short,t - ZLEMA_long,t
with standard parameters of 12 and 26 periods.
2.3 Signal Line with Adaptive Methodology
The signal line can be calculated using ZLEMA, EMA, or SMA:
Signal_t = f(MACD, S)
where f is the chosen smoothing function and S is the period length.
2.4 Histogram as a Measure of Momentum Changes
Histogram_t = MACD_t - Signal_t
An increasing histogram indicates a relative acceleration in trend strength.
Potential Applications in Data Analysis
Since the indicator is based solely on price time series, its effectiveness as a standalone trading signal is limited. However, in quantitative models, it can be used as a feature for trend quantification or for filtering market phases with strong trend dynamics.
Potential use cases include:
Trend Classification: Segmenting market phases into "trend" vs. "mean reversion."
Momentum Regime Identification: Analyzing histogram dynamics to detect increasing or decreasing trend strength.
Signal Smoothing: An alternative to classic EMA smoothing in more complex multi-factor models.
Important: Using this as a standalone trading indicator without additional confirmation mechanisms is not recommended, as it does not demonstrate statistical superiority over other momentum indicators.
Evaluation & Limitations
✅ Advantages:
Reduced lag compared to the classic MACD.
Customizable signal line smoothing for different applications.
Easy integration into existing analytical pipelines.
⚠️ Limitations:
Not a standalone trading system: Like any moving average, this indicator is susceptible to noise and false signals in sideways markets.
Parameter sensitivity: Small changes in period lengths can lead to significant signal deviations, requiring robust optimization.
Conclusion
The ZLEMA MACD is a variant of the classic MACD with reduced latency, making it particularly useful for analytical purposes where faster adaptation to price movements is required.
Its application in trading strategies should be limited to multi-factor models with rigorous evaluation. Backtests and out-of-sample analyses are essential to avoid overfitting to past market data.
Disclaimer: This indicator is provided for informational and educational purposes only and does not constitute financial advice. The author assumes no responsibility for any trading decisions made based on this indicator. Trading involves significant risk, and past performance is not indicative of future results.

Uptrick: Universal Market ValuationIntroduction
Uptrick: Universal Market Valuation is created for traders who seek an analytical tool that brings together multiple signals in one place. Whether you focus on intraday scalping or long-term portfolio management, the indicator merges various well-known technical indicators to help gauge potential overvaluation, undervaluation, and trend direction. It is engineered to highlight different market dimensions, from immediate price momentum to extended cyclical trends.
Overview
The indicator categorizes market conditions into short-term, long-term, or a classic Z-Score style reading. Additionally, it draws on a unified trend line for directional bias. By fusing elements from traditionally separate indicators, the indicator aims to reduce “false positives” while giving a multidimensional view of price behavior. The indicator works best on cryptocurrency markets while remaining a universal valuation indicator that performs well across all timeframes. However, on lower timeframes, the Long-Term Combo input may be too long-term, so it's recommended to select the Short-Term Combo in the inputs for better adaptability.
Originality and Value
The Uptrick: Universal Market Valuation indicator is not just a simple combination of existing technical indicators—it introduces a multi-layered, adaptive valuation model that enhances signal clarity, reduces false positives, and provides traders with a more refined assessment of market conditions.
Rather than treating each included indicator as an independent signal, this script normalizes and synthesizes multiple indicators into a unified composite score, ensuring that short-term and long-term momentum, mean reversion, and trend strength are all dynamically weighted based on market behavior. It employs a proprietary weighting system that adjusts how each component contributes to the final valuation output. Instead of static threshold-based signals, the indicator integrates adaptive filtering mechanisms that account for volatility fluctuations, drawdowns, and momentum shifts, ensuring more reliable overbought/oversold readings.
Additionally, the script applies Z-Score-based deviation modeling, which refines price valuation by filtering out extreme readings that are statistically insignificant. This enhances the detection of true overvaluation and undervaluation points by comparing price behavior against a dynamically calculated standard deviation threshold rather than relying solely on traditional fixed oscillator bands. The MVRV-inspired ratio provides a unique valuation layer by incorporating historical fair-value estimations, offering deeper insight into market overextension.
The Universal Trend Line within the indicator is designed to smooth trend direction while maintaining responsiveness to market shifts. Unlike conventional trend indicators that may lag significantly or produce excessive false signals, this trend-following mechanism dynamically adjusts to changing price structures, helping traders confirm directional bias with reduced noise. This approach enables clearer trend recognition and assists in distinguishing between short-lived pullbacks and sustained market movements.
By merging momentum oscillators, trend strength indicators, volume-driven metrics, statistical deviation models, and long-term valuation principles into a single framework, this indicator eliminates the need for juggling multiple individual indicators, helping traders achieve a holistic market perspective while maintaining customization flexibility. The combination of real-time alerts, dynamic color-based valuation visualization, and customizable trend-following modes further enhances usability, making it a comprehensive tool for traders across different timeframes and asset classes.
Inputs and Features
• Calculation Window (Short-Term and Long-Term)
Defines how much historical data the indicator uses to evaluate the market. A smaller window makes the indicator more reactive, benefiting high-frequency traders. A larger window provides a steadier perspective for longer-term holders.
• Smoothing Period (Short-Term and Long-Term)
Controls how much the raw indicator outputs are “smoothed out.” Lower values reveal subtle intraday fluctuations, while higher values aim to present more robust, stable signals.
• Valuation Mechanism (Short Term Combo, Long Term Combo, Classic Z-Score)
Allows you to pick how the indicator evaluates overvaluation or undervaluation. Short Term Combo focuses on rapid oscillations, Long Term Combo assesses market health over more extended periods, and the Classic Z-Score approach highlights statistically unusual price levels.
Short-Term
• Determination Mechanism (Strict or Loose)
Governs the tolerance for labeling a market as overvalued or undervalued. Strict requires stronger confirmation; Loose begins labeling sooner, potentially catching moves earlier but risking more false signals.
Strict
Loose
• Select Color Scheme
Lets you choose the aesthetic style for your charts. Visual clarity can significantly improve reaction time, especially when multiple indicators are combined.
• Z-Score Coloring Mode (Heat or Slope)
Determines how the Classic Z-Score line and bars are colored. In Heat mode, the indicator intensifies color as readings move further from a baseline average. Slope mode changes color based on the direction of movement, making turning points more evident.
Classic Z-Score - Heat
Classic Z-Score - Slope
• Trend Following Mode (Short, Long, Extra Long, Filtered Long)
Offers various ways to compute and smooth the universal trend line. Short is more sensitive, Long and Extra Long are meant for extended time horizons, and Filtered Long applies an extra smoothing layer to help you see overarching trends rather than smaller fluctuations.
Short Term
Long Term
Extra Long Term
Filtered Long Term
• Table Display
An optional feature that places a concise summary table on the chart. It shows valuation states, trend direction, volatility condition, and other metrics, letting you observe multi-angle readings at a glance.
• Alerts
Multiple alert triggers can be set up—for crossing into overvaluation zones, for abrupt changes in trend, or for high volatility detection. Traders can stay informed without needing to watch charts continuously.
Why These Indicators Were Merged
• RSI (Relative Strength Index)
RSI is a cornerstone momentum oscillator that interprets speed and change of price movements. It has widespread recognition among traders for detecting potential overbought or oversold conditions. Including RSI provides a tried-and-tested layer of momentum insight.
• Stochastic Oscillator
This oscillator evaluates the closing price relative to its recent price range. Its responsiveness makes it valuable for pinpointing near-term price fluctuations. Where RSI offers a broader momentum picture, Stochastic adds fine-tuned detection of short-lived rallies or pullbacks.
• MFI (Money Flow Index)
MFI assesses buying and selling pressure by incorporating volume data. Many technical tools are purely price-based, but MFI’s volume component helps address questions of liquidity and actual money flow, offering a glimpse of how robust or weak a current move might be.
• CCI (Commodity Channel Index)
CCI shows how far price lies from its statistically “typical” trend. It can spot emerging trends or warn of overextension. Using CCI alongside RSI and Stochastic further refines the valuation layer by capturing price deviation from its underlying trajectory.
• ADX (Average Directional Index)
ADX reveals the strength of a trend but does not specify its direction. This is especially useful in combination with other oscillators that focus on bullish or bearish momentum. ADX can clarify whether a market is truly trending or just moving sideways, lending deeper context to the indicator's broader signals.
• MACD (Moving Average Convergence Divergence)
MACD is known for detecting momentum shifts via the interaction of two moving averages. Its inclusion ensures the indicator can capture transitional phases in market momentum. Where RSI and Stochastic concentrate on shorter-term changes, MACD has a slightly longer horizon for identifying robust directional changes.
• Momentum and ROC (Rate of Change)
Momentum and ROC specifically measure the velocity of price moves. By indicating how quickly (or slowly) price is changing compared to previous bars, they help confirm whether a trend is gathering steam, losing it, or is in a transitional stage.
• MVRV-Inspired Ratio
Drawn loosely from the concept of comparing market value to some underlying historical or fair-value metric, an MVRV-style ratio can help identify if an asset is trading above or below a considered norm. This additional viewpoint on valuation goes beyond simple price-based oscillations.
• Z-Score
Z-Score interprets how many standard deviations current prices deviate from a central mean. This statistical measure is often used to identify extreme conditions—either overly high or abnormally low. Z-Score helps highlight potential mean reversion setups by showing when price strays far from typical levels.
By merging these distinct viewpoints—momentum oscillators, trend strength gauges, volume flow, standard deviation extremes, and fundamental-style valuation measures—the indicator aims to create a well-rounded, carefully balanced final readout. Each component serves a specialized function, and together they can mitigate the weaknesses of a single metric acting alone.
Summary
This indicator simplifies multi-indicator analysis by fusing numerous popular technical signals into one tool. You can switch between short-term and long-term valuation perspectives or adopt a classic Z-Score approach for spotting price extremes. The universal trend line clarifies direction, while user-friendly color schemes, optional tabular summaries, and customizable alerts empower traders to maintain awareness without constantly monitoring every market tick.
Disclaimer
The indicator is made for educational and informational use only, with no claims of guaranteed profitability. Past data patterns, regardless of the indicators used, never ensure future results. Always maintain diligent risk management and consider the broader market context when making trading decisions. This indicator is not personal financial advice, and Uptrick disclaims responsibility for any trading outcomes arising from its use.

Enhanced HHLL Time Confirmation with EMAStrong recommendation , remove the green and red circle , or leave it how it is ;)
To be used on 1 minute chart MSTR , Stock
other time frames are good , ;)
How to Use
HHLL Signals: Look for green triangles (buy) below bars or red triangles (sell) above bars to identify confirmed HH/LL setups with trend alignment.
EMA Signals: Watch for lime circles (buy) below bars or maroon circles (sell) above bars when price crosses the EMA 400 in a trending market.
Trend Context: Use the EMA 400 as a dynamic support/resistance level and the SMA trend filter to gauge market direction.
Enable alerts to get notified of signals in real-time.
Best Practices
Adjust the Lookback Period and Confirmation Minutes to suit your timeframe (e.g., shorter for scalping, longer for swing trading).
Combine with other indicators (e.g., volume, RSI) for additional confirmation.
Test on your preferred market and timeframe to optimize settings.
Indicator Description: Enhanced HHLL Time Confirmation with EMA
Overview
The "Enhanced HHLL Time Confirmation with EMA" is a versatile trading indicator designed to identify key reversal and continuation signals based on Higher Highs (HH), Lower Lows (LL), and a 400-period Exponential Moving Average (EMA). It incorporates time-based confirmation and trend filters to reduce noise and improve signal reliability. This indicator is ideal for traders looking to spot trend shifts or confirm momentum with a combination of price structure and moving average crossovers.
Key Features
Higher High / Lower Low Detection:
Identifies HH and LL based on a customizable lookback period (default: 30 bars).
Signals are confirmed only after a user-defined time period (in minutes, default: 60) has passed since the last HH or LL, ensuring stability.
Trend Filter:
Uses a fast (10-period) and slow (30-period) Simple Moving Average (SMA) crossover to confirm bullish or bearish trends.
Buy signals require a bullish trend (Fast SMA > Slow SMA), and sell signals require a bearish trend (Fast SMA < Slow SMA).
EMA 400 Integration:
Plots a 400-period EMA (customizable) as a long-term trend reference.
Generates additional buy/sell signals when price crosses above (buy) or below (sell) the EMA 400, filtered by trend direction.
Visualizations:
Optional dashed lines for HH and LL levels (toggleable).
Debug markers (diamonds) to visualize HH/LL detection points.
Distinct signal shapes: triangles for HHLL signals (green/red) and circles for EMA signals (lime/maroon).
Alerts:
Built-in alert conditions for HHLL Buy/Sell and EMA Buy/Sell signals, making it easy to stay informed of key events.
Input Parameters
Lookback Period (default: 30): Number of bars to look back for HH/LL detection.
Confirmation Minutes (default: 60): Time (in minutes) required to confirm HH/LL signals.
High/Low Source: Select the price source for HH (default: high) and LL (default: low).
Show HH/LL Lines (default: true): Toggle visibility of HH/LL dashed lines.
Show Debug Markers (default: true): Toggle HH/LL detection markers.
EMA Period (default: 400): Adjust the EMA length.
