MA Crossover Detector
The Moving Average Crossover Detector is a custom indicator that visually shows buy and sell signals clearly on the chart. based on the crossing of two moving averages — a popular and beginner-friendly tool in technical analysis.
It plots two moving averages — One fast (short period) and one slow (long period) — and highlights crossover points:
✅ Buy Signal (Golden Cross) – When the fast MA crosses above the slow MA.
❌ Sell Signal (Death Cross) – When the fast MA crosses below the slow MA.
✅ Features
Visual: Clearly shows crossovers on the chart.
Customizable: Choose periods, types, styles, etc.
Alert-ready: You can set alerts for crossovers.
The Moving Average (MA) Crossover Strategy is one of the simplest and most widely used strategies in technical analysis for trading stocks, forex, crypto, and other markets. It relies on the interaction between two moving averages to generate buy and sell signals.
Core Components
Short-Term Moving Average (Fast MA) : Reacts quickly to price changes (e.g., 9-period or 20-period).
Long-Term Moving Average (Slow MA) : Reacts more slowly to price changes (e.g., 21-period or 200-period).
How the Strategy Works
Bullish Crossover (Golden Cross):
Occurs when the fast MA crosses above the slow MA. Interpreted as a buy signal, indicating a potential uptrend.
Bearish Crossover (Death Cross):
Occurs when the fast MA crosses below the slow MA. Interpreted as a sell signal, indicating a potential downtrend.
Common Variants
Short-term trading
9 EMA
21 EMA
Swing trading
20 SMA
50 SMA
Long-term investing
50 SMA
200 SMA
Pros
Easy to understand and implement
Works well in trending markets
Can be automated for backtesting and execution
Cons
Lagging indicator: MAs are based on past prices, so signals come after the move has started.
Choppy markets = whipsaws: Generates false signals in sideways/range-bound conditions.
May underperform in volatile or mean-reverting environments
Tips for Improvement
Use confirmation tools : e.g., RSI, MACD, volume analysis, price action
Add filters : Trend filter (ADX), volatility filter (ATR), or time filter (session-based)
Combine with price structure : Support/resistance, breakouts, pullbacks
Moving Averages

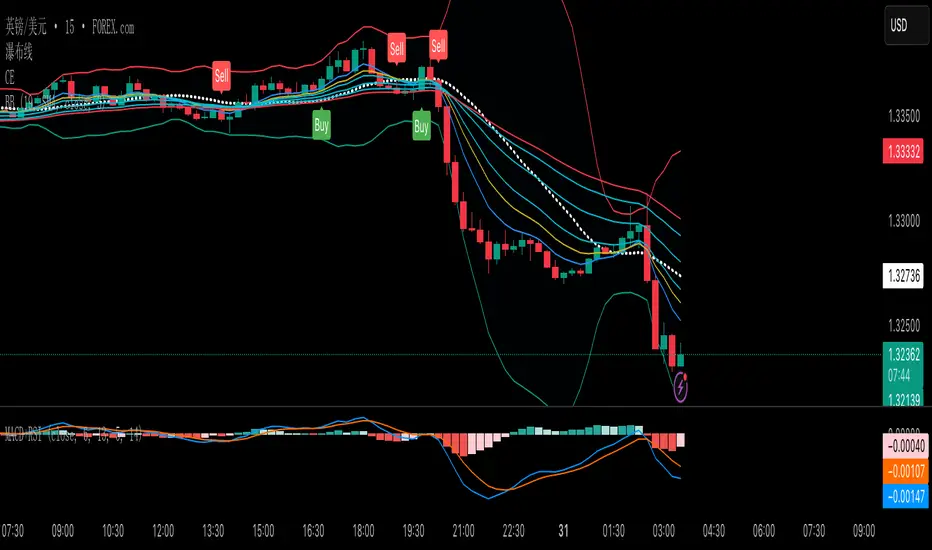
MACD + EMA Zone Filter (with EMAs)How it works:
It plots 4 EMAs (Exponential Moving Averages):
EMA 20 (orange)
EMA 50 (yellow)
EMA 100 (blue)
EMA 200 (red)
A Buy signal is triggered when:
All three EMAs (20, 50, 100) are above EMA 200 (indicating an uptrend)
The MACD line crosses above the Signal line (bullish momentum)
A Sell signal is triggered when:
All three EMAs (20, 50, 100) are below EMA 200 (indicating a downtrend)
The MACD line crosses below the Signal line (bearish momentum)
📊 Visual Features:
Buy/Sell arrows directly on the chart
Background turns green in strong uptrends and red in strong downtrends
Built-in alerts for automation or notifications
🕒 Works on any timeframe, using the current chart's data.
use with fractals indicator for SL, aim for 1:2 RR

MultiMa FxGMulti Moving Average v1
SMA 8 + EMA 21 + EMA 50
Cet indicateur permet de condenser 3 indicateurs en 1 seul.
C'est un test permettant de voir comment cela se comporte dans la réalité de TradingView
================================================================================
Multi Moving Average v1
This indicator is designed for draw 3 moving average with this custom indicator.
This is my first try on TradingView Pine Script.
Color Change EMA 200 (3 Min)- EMA 200 locked on 3 minute time frame
- Color changes red when bearish, and green when bullish.

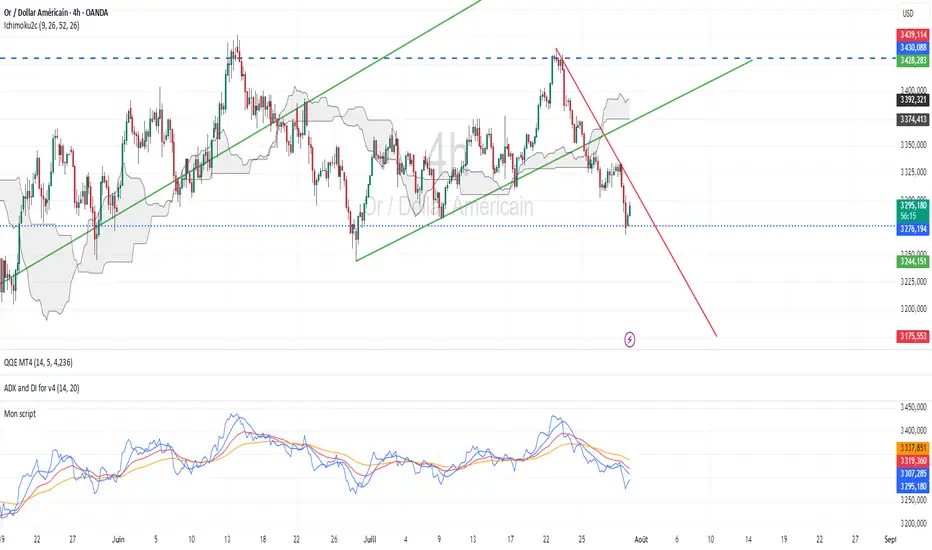
GCM Volatility-Adaptive Trend ChannelScript Description
Name: GCM Volatility-Adaptive Trend Channel (GCM VATC)
Overview
The GCM Volatility-Adaptive Trend Channel (VATC) is a comprehensive trading tool that merges the low-lag, smooth-trending capabilities of the Jurik Moving Average (JMA) with the classic volatility analysis of Bollinger Bands (BB).
By displaying both trend and volatility in a single, intuitive interface, this indicator aims to help traders see when a trend is stable versus when it's becoming volatile and might be poised for a change.
Core Components:
JMA Trend System: At its core are three dynamically colored JMA lines (Baseline, Fast, and Slow) that provide a clear view of trend direction. The lines change color based on their slope, offering immediate visual feedback on momentum. A colored ribbon between the Baseline and Fast JMA visualizes shorter-term momentum shifts.
Standard Bollinger Bands: Layered on top are standard Bollinger Bands. Calculated from the price, these bands serve as a classic measure of market volatility. They help identify periods where the market is expanding (high volatility) or contracting (low volatility).
How to Use It
By combining these two powerful concepts, this indicator provides a unified view of both trend and volatility. It can help traders to:
Identify the primary trend direction using the smooth JMA lines.
Gauge the strength and stability of that trend.
See when the market is becoming volatile (bands widening) or consolidating (bands contracting), which can often precede a significant price move or a change in trend.
A Note on Originality & House Rules Compliance
This indicator does not introduce a new mathematical formula. Instead, its strength lies in the thoughtful combination of two well-respected, publicly available concepts: the Jurik Moving Average and Bollinger Bands. The JMA implementation is a standard public version. The goal was to create a practical, all-in-one tool for trend and volatility analysis.
This script is published as fully open-source in compliance with TradingView's House Rules. It utilizes standard, publicly available algorithms and does not contain any protected or hidden code.
Settings
All lengths, sources, and colors for the JMA lines and Bollinger Bands are fully customizable in the settings menu, allowing you to tailor the indicator to your specific trading style and asset.
I hope with this indicator Traders even Beginner can can control their emotions which increase the probabilities of the winning rates and cutting the losing strength
Purposely I Didn't plant the High low or Buy Sell signals in the chart. Because everything is in the chart where volatility Signal with the Bollinger Band and Buy Sell Signal in the JMA Dynamic colors. and that's enough to decide when to take trade and when not to.
Thank You and Happy Trading
Dubic EMA StrategyThe Dubic EMA Strategy is a trend-following and volatility-aware strategy that combines dual EMA filters with intelligent range and noise detection to provide clean, actionable entries. It's designed to avoid choppy markets, enhance trade precision, and adapt to different market conditions.
✅ Key Features:
Dual EMA Filter: Enters long when price is above both EMA High & EMA Low, and short when below both.
Range Filter: Avoids entries during tight consolidations or sideways markets.
Volatility Filter: Prevents trading in low-ATR conditions.
Dynamic Risk Management:
ATR-based or fixed % Stop Loss and Take Profit.
Optional Parabolic SAR trailing stop.
One Trade per Trend: Prevents re-entry until trend direction changes.
Unbroken Range Visualization: Detects and displays consolidation zones that can lead to breakouts.
Alerts & Labels: Clean BUY/SELL signals with alerts and chart labels.
🧩 Customization Options:
Adjustable EMA length
Toggle between ATR or % based SL/TP
Volatility threshold
Range detection sensitivity
Enable/disable SAR trailing stop
This strategy works best on trending assets and timeframes with volatility (e.g., crypto, forex, indices). Suitable for both manual trading and automation.
🛠️ Built for clarity, control, and precision.
📈 Backtest, optimize, and deploy with confidence.


3x Multi EMA/SMA ColoredThis is a Multi-Colored EMA/SMA Script with 3 ema's that can be toggled on/off and 3 sma's that can be toggled on/off.
Giving you more visibility where price is actually going using 3 ema's at the same time or 3 sma's at the same time allowing you to change the colors when Bearish or Bullish.

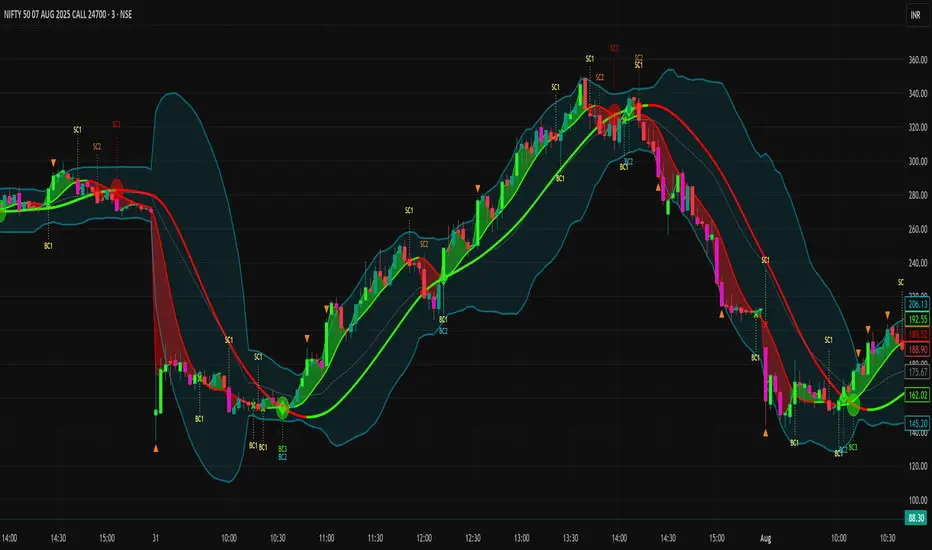
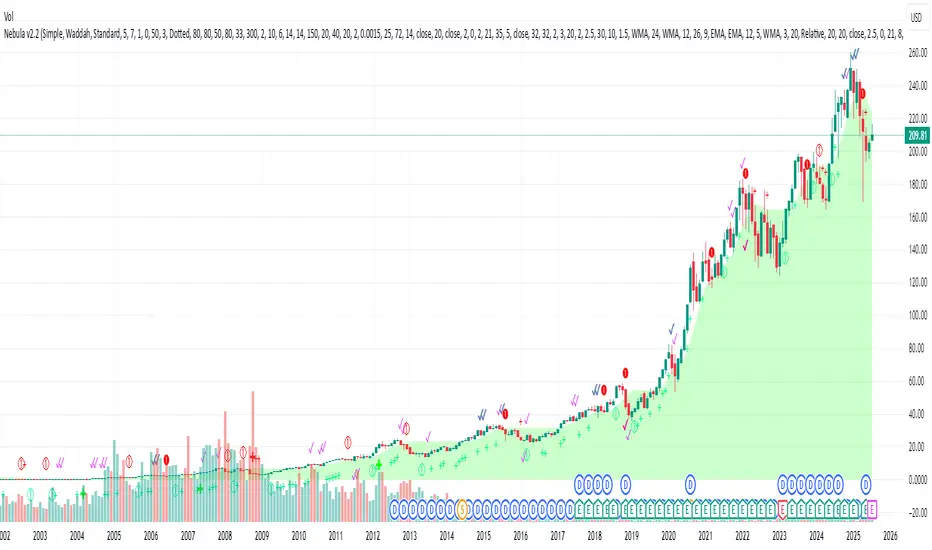
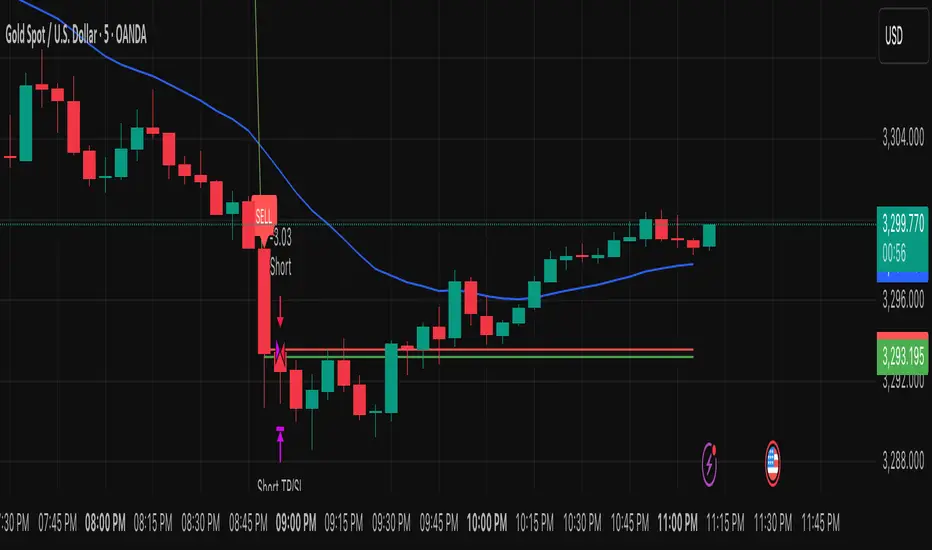
Nebula by CatboyCatboy buy and sell. This indicator will show buy and sell signals on market direction
TPC Strategy XAUUSD - M5 with Fixed SL/TPThis script implements a trend-following strategy for XAUUSD on the 5-minute chart, using 200 EMA and 21 EMA to filter direction. Entries are triggered based on RSI, MACD crossovers, and price action alignment. It includes fixed Stop Loss (15 pips) and Take Profit (22.5 pips) with visual SL/TP lines, BUY/SELL labels, and alert conditions for automated notifications. Designed for intraday scalping and low-risk entries during trending conditions.
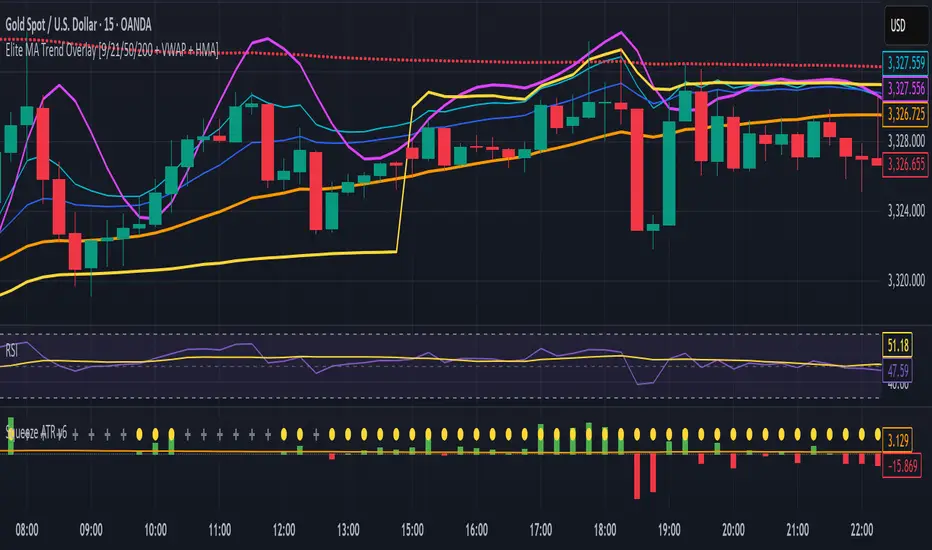
Elite MA Trend Overlay [9/21/50/200 + VWAP + HMA]🔍 What It Is:
The Elite MA Trend Overlay is a professional-grade moving average system built for day traders, scalpers, and swing traders who need clear, visual trend confirmation and precise entry zones across all timeframes.
This overlay combines 5 industry-proven tools into one compact indicator for sniper-level decision making:
EMA 9 – Entry momentum
EMA 21 – Microstructure guide
EMA 50 – Trend bias filter
EMA 200 – Institutional macro direction
VWAP – Intraday fair value (used by pros)
Hull MA (HMA) – Early shift detector
It also features auto-detected trend zones using color-coded background shading to help you instantly know if the market is in a bullish or bearish regime.
🧠 How It Works:
The script dynamically plots the short-term to long-term moving averages to reflect real-time market structure. When all EMAs are aligned in one direction, a colored background highlights the dominant trend:
✅ Green background = Bullish trend (9 > 21 > 50 > 200)
🔻 Red background = Bearish trend (9 < 21 < 50 < 200)
The VWAP line acts as a magnet and decision zone—traders use it for intraday entries or exits. The Hull Moving Average adapts quickly to price shifts, making it perfect for spotting early reversals before the EMAs cross.
🎯 Why It Helps Traders Succeed:
This indicator:
Removes guesswork: Know instantly if you’re in a strong trend or chop zone.
Filters bad trades: Avoid entering against structure or into volatility traps.
Improves timing: Use pullbacks to EMAs or Hull MA flips for sniper entries.
Works across timeframes: From scalping 1-minute to swing trading daily charts.
Whether you're trading gold, forex, stocks, or crypto — this overlay gives you clean, professional structure that keeps you disciplined and sharp.
⚙️ Features:
On/off toggles for VWAP & Hull MA
Minimalist, clutter-free plotting
Auto background color zones
Supports Pine Script v6 (latest version)
👑 Recommended Use:
Confirm trend with background + EMA alignment
Enter on pullbacks to EMA 21 or 50
Use Hull MA or RSI for early reversal detection
Exit at VWAP reversion or trend exhaustion
💬 “Structure is everything. Trade with the flow, not against it.”
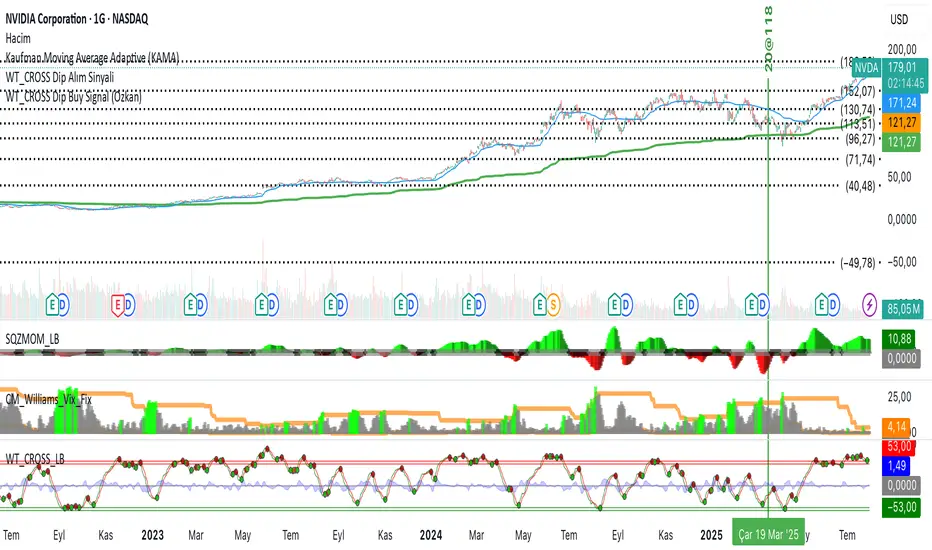
WT_CROSS Dip Buy Signal(ozkan)This script identifies potential buy opportunities based on WaveTrend (WT_CROSS) momentum crossing below the -60 level — often indicating oversold conditions.
Additional filters include price being above the Kaufman Adaptive Moving Average (KAMA) and volume below the 5-period average, which helps isolate pullbacks within an uptrend.
Buy Signal Conditions:
WT1 < -60
Price > KAMA
Volume < 5-period SMA of volume
Purpose:
To capture early entries at possible local bottoms during bullish trends while avoiding high-volume breakdown traps.
🔔 You can also set an alert based on this condition.
VIX Filter/RSI/EMA Bias/Cum-TICK w/ Exhaustion Zone DashboardThis all-in-one dashboard gives intraday traders a real-time visual read of market conditions, combining volatility regime, trend bias, momentum exhaustion, and internal strength — all in a fully customizable overlay that won’t clutter your chart.
📉 VIX Market Regime Detector
Identifies "Weak", "Normal", "Volatile", or "Danger" market states based on customizable VIX ranges and symbol (e.g., VXN or VIX).
📊 RSI Momentum Readout
Displays real-time RSI from any selected timeframe or symbol, with adjustable length, OB/OS thresholds, and color-coded exhaustion alerts.
📈 EMA Trend Bias Scanner
Compares fast and slow EMAs to define bullish or bearish bias, using your preferred timeframe, symbol, and EMA lengths — ideal for multi-timeframe setups.
🧠 Cumulative TICK Pressure & Exhaustion Engine
Analyzes internal market strength using cumulative TICK data to classify conditions as:
-Strong / Mild Bullish or Bearish Pressure
-Choppy / No Edge
-⚠️ Exhaustion Zones — when raw TICK values hit extreme highs/lows, a separate highlight box appears in the dashboard, warning of potential turning points
All logic is customizable, including TICK symbol, timeframes, thresholds, and lookback periods.
Scalpers and day traders who want fast, visual insight into market internals, exhaustion, and trend bias.

Combo 2/20 EMA & Bandpass Filter by TamarokDescription:
This strategy combines a 2/20 exponential moving average (EMA) crossover with a custom bandpass filter to generate buy and sell signals.
Use the Fast EMA and Slow EMA inputs to adjust trend sensitivity, and the Bandpass Filter Length, Delta, and Zones to fine-tune momentum turns.
Signals occur when both EMA and BPF agree in direction, with optional reversal and time filters.
How to use:
1. Add the script to your chart in TradingView.
2. Adjust the EMA and BP Filter parameters to match your asset’s volatility.
3. Enable ‘Reverse Signals’ to trade counter-trend, or use the time filter to limit sessions.
4. Set alerts on Long Alert and Short Alert for automated notifications.
Inspiration:
Based on HPotter’s original combo strategy (Stocks & Commodities Mar 2010).
Updated to Pine Script v6 with streamlined code and alerts.
WARNING:
For purpose educate only

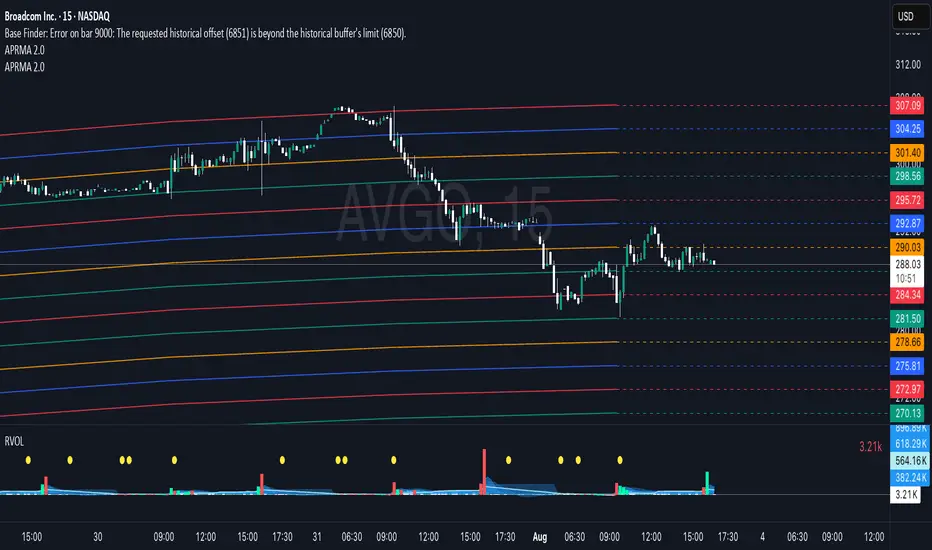
Adjustable Percentage Range Moving Average - Add'l LinesThe Adjustable Percentage Range Moving Average (APRMA), originally developed by @ReallyWendy, is a versatile PineScript indicator designed for traders and market analysts to analyze market volatility and identify trends dynamically. Building on the original concept, this updated version plots a central moving average (MA) with four customizable percentage-based range bands around it. Users can select the MA type (SMA, EMA, HMA, RMA, SWMA, TMA, WMA, VWMA), timeframe, and length, tailoring the indicator to their trading style. Each range band (upper and lower) is calculated as a percentage offset from the MA, with adjustable colors and transparency settings for enhanced visual clarity. Extension lines project the latest values forward, with customizable styles (solid, dashed, dotted). The indicator includes toggleable display options for the MA and each range pair, making it an effective tool for identifying price ranges, support/resistance levels, and trend dynamics.
Credit to @ReallyWendy for the foundational concept.
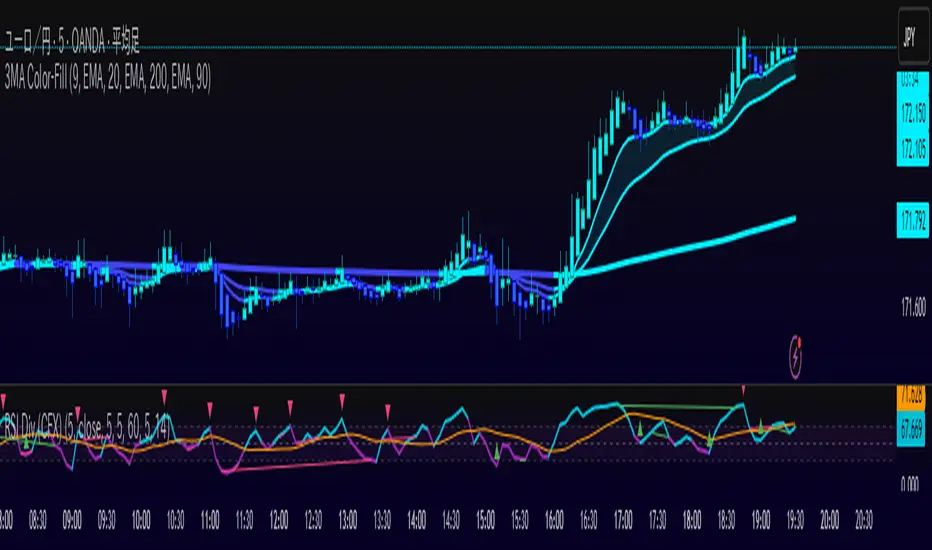
RSI Divergence(CompactFX)This is the standard "RSI" with "divergence" displayed. Additionally, it has the following features:
- The line color shifts above and below the RSI 50 threshold.
- The MA can be displayed on the RSI.
- Signs of an expected reversal are displayed.
**Examples of Use**
*For Swing Traders
In addition to using the standard RSI, the divergence display can serve as a trigger for further consideration.
*For Scalpers
For athletic traders who prefer intuition over logic and calculation, we recommend customizing the RSI color to your liking for bulls and bears. Consider extending the price until the RSI color changes. Below is my example.
-One-Minute Scalping
When prices are moving above the long-term and short-term MAs, you can hold a position as long as the RSI is above 55 (below 45 for bears). In this case, pivot signs can also be used as a guide for closing positions. Of course, this is best done during periods of high momentum. Five- and 15-minute scalping also works well. However, these only work if you adhere to my logic. Don't forget to adhere to your own logic and framework.
The above is just an example. Feel free to use it as you like.
Simple 5 Moving Averages 5 MAs - Shubhashish DixitEnjoy the 5 Moving Average to Support your analysis deeper

Swing Strategy MTF with Auto SL/TP + Weekly Pivotsested and Working Notes:
Works on any intraday chart (like 1H or 4H)
Uses Daily trend for confirmation by default
Adjust trend EMAs or pivot TF if needed
Wait for a signal label after candle close
Targets and SL are drawn automatically
—

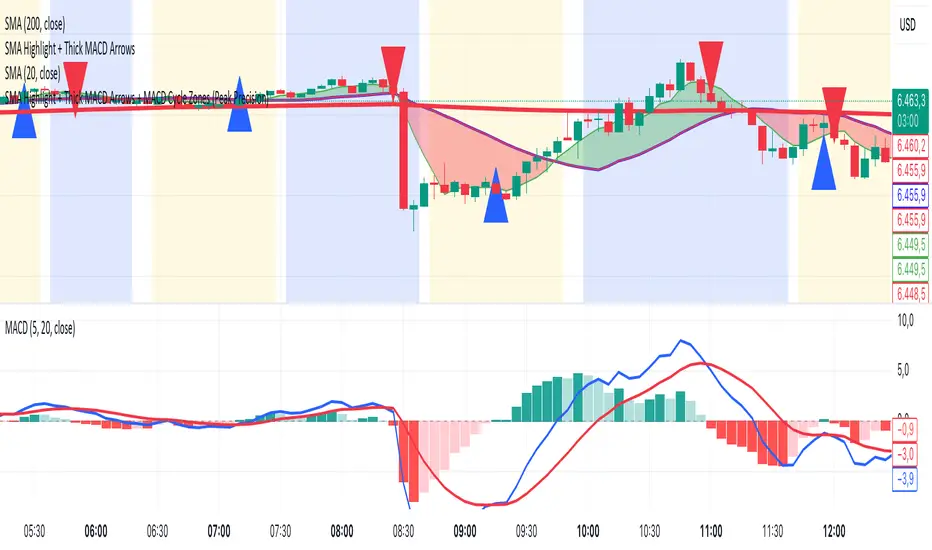
SMA Highlight + MACD Crossover ArrowsDraw blue arrow for bullish entries when MACD line crosses above the signal line and red arrow for bearish entries when MACD line crosses below the signal line
Koala Trend HackWhat this indicator is
A minimal, “ tweet‑faithful ” trend read with just two visuals:
1. H4 EMA200 (white): the macro/regime line pulled onto any timeframe.
2. Trend Line (colored): the average of EMA‑8 and EMA‑21; its color shows the current state.
How it works (state → color)
Priority is macro first, then short‑term momentum—so it’s simple but still reactive above H4:
Below H4 200 → Red (Be Bearish).
Above H4 200 with wick into it → Yellow (Be Bullish & Pray / Watch the retest).
Above H4 200 and above both 8 & 21 → Green (Be Bullish).
Above H4 200 but below both 8 & 21 → Orange (Be Cautious).
If none of the above applies, it falls back to the 8/21 cluster (above both = green, below both = orange) or stays Yellow (Neutral/Watch).
How it aligns with the tweet’s 5 rules
1. Reclaim EMAs = Long → close > 8 & 21 → Green.
2. Close below EMAs = Be cautious* → close < 8 & 21 → Orange.
3. Retest of H4 EMA200 = Be bullish and pray → close > H4 and low ≤ H4 → Yellow.
4. Lose H4 EMA200 = Be bearish* → close < H4 → Red.
5. Reclaim H4 EMA200 = Be bullish again* → back above H4 (and ideally > 8/21) → Green.
How to use
Green favors longs; Orange means lighten up or wait; Yellow says “watch the level” after a retest; Red warns against longs until H4 200 is reclaimed.
Notes:
The H4 EMA200 is a higher‑timeframe value fetched with request.security; on sub‑H4 charts it updates during the current 4‑hour candle (responsive but can shift slightly until that candle closes).
EMAs 8 & 21 are used internally to color the line; they’re not plotted, keeping the chart clean.
What would make this better? Modify it and show me what you built!

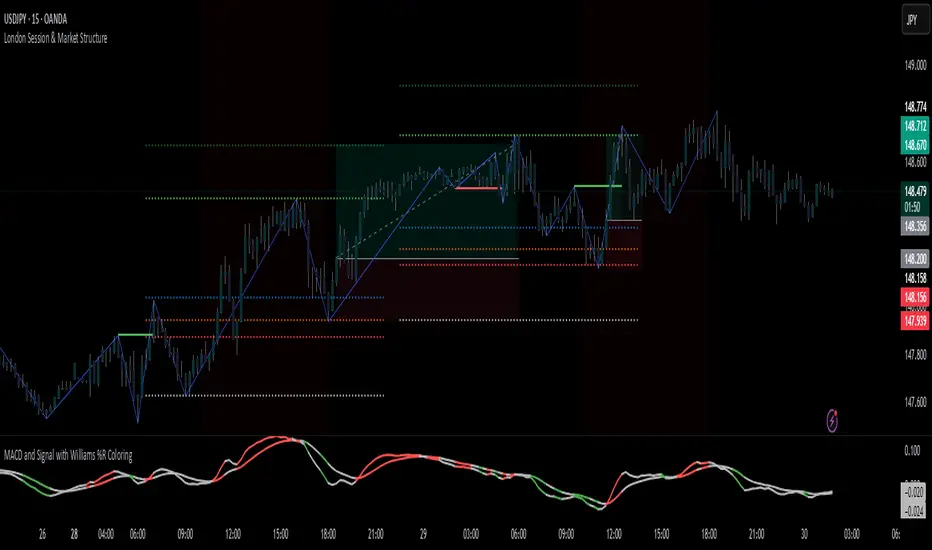
MACD Signal with Williams %R ColoringA simple fused indicator of 2, 1) MACD signal lines made colouring when 2) Williams % R is in overbought or oversold. not my own coding, just took two readily available indicators and coded them together.
9:45am NIFTY TRADINGTime Frame: 15 Minutes | Reference Candle Time: 9:45 AM IST | Valid Trading Window: 3 Hours
📌 Introduction
This document outlines a structured trading strategy for NIFTY & BANKNIFTY Options based on a 15-minute timeframe with a 9:45 AM IST reference candle. The strategy incorporates technical indicators, probability analysis, and strict trading rules to optimize entries and exits.
📊 Core Features
1. Reference Time Trading System
9:45 AM IST Candle acts as the reference for the day.
All signals (Buy/Sell/Reversal) are generated based on price action relative to this candle.
The valid trading window is 3 hours after the reference candle.
2. Signal Generation Logic
Signal Condition
Buy (B) Price breaks above reference candle high with confirmation
Sell (S) Price breaks below reference candle low with confirmation
Reversal (R) Early trend reversal signal (requires strict confirmation)
3. Probability Analysis System
The strategy calculates Win Probability (%) using 4 components:
Component Weight Calculation
Body Win Probability 30% Based on candle body strength (body % of total range)
Volume Win Probability 30% Current volume vs. average volume strength
Trend Win Probability 40% EMA crossover + RSI momentum alignment
Composite Probability - Weighted average of all 3 components
Probability Color Coding:
🟢 Green (High Probability): ≥70%
🟠 Orange (Medium Probability): 50-69%
🔴 Red (Low Probability): <50%
4. Timeframe Enforcement
Strictly 15-minute charts only (no other timeframes allowed).
System auto-disables signals if the wrong timeframe is selected.
📈 Technical Analysis Components
1. EMA System (Trend Analysis)
Short EMA (9) – Fast trend indicator
Middle EMA (20) – Intermediate trend
Long EMA (50) – Long-term trend confirmation
Rules:
Buy Signal: Price > 9 EMA > 20 EMA > 50 EMA (Bullish trend)
Sell Signal: Price < 9 EMA < 20 EMA < 50 EMA (Bearish trend)
2. Multi-Timeframe RSI (Momentum)
5M, 15M, 1H, 4H, Daily RSI values are compared for divergence/confluence.
Overbought (≥70) / Oversold (≤30) conditions help in reversal signals.
3. Volume Analysis
Volume Strength (%) = (Current Volume / Avg. Volume) × 100
Strong Volume (>120% Avg.) confirms breakout/breakdown.
4. Body Percentage (Candle Strength)
Body % = (Close - Open) / (High - Low) × 100
Strong Bullish Candle: Body > 60%
Strong Bearish Candle: Body < 40%
📊 Visual Elements
1. Information Tables
Reference Data Table (9:45 AM Candle High/Low/Close)
RSI Values Table (5M, 15M, 1H, 4H, Daily)
Signal Legend (Buy/Sell/Reversal indicators)
2. Chart Overlays
Reference Lines (9:45 AM High & Low)
EMA Lines (9, 20, 50)
Signal Labels (B, S, R)
3. Color Coding
High Probability (Green)
Medium Probability (Orange)
Low Probability (Red)
⚠️ Important Usage Guidelines
✅ Best Practices:
Trade only within the 3-hour window (9:45 AM - 12:45 PM IST).
Wait for confirmation (closing above/below reference candle).
Use probability score to filter high-confidence trades.
❌ Avoid:
Trading outside the 15-minute timeframe.
Ignoring volume & RSI divergence.
Overtrading – Stick to 1-2 high-probability setups per day.
🎯 Conclusion
This NIFTY Trading Strategy is optimized for 15-minute charts with a 9:45 AM IST reference candle. It combines EMA trends, RSI momentum, volume analysis, and probability scoring to generate high-confidence signals.
🚀 Key Takeaways:
✔ Reference candle defines the day’s bias.
✔ Probability system filters best trades.
✔ Strict 15M timeframe ensures consistency.
Happy Trading! 📈💰
