Volume Weighted SuperTrend | QuantumResearchQuantumResearch Volume Weighted Supertrend (VWST)
The Volume Adaptive Supertrend (VWST) is a dynamic trend-following tool that enhances traditional Supertrend calculations by incorporating volume-weighted market conditions.
This indicator adapts its trend signals based on volume-adjusted price action, allowing traders to refine their entries and exits with improved responsiveness. 🚀📊
1. Key Features
Volume-Weighted Adaptation: Uses various moving averages (VWMA, EMA, SMA, etc.) to adjust ATR bands based on market activity.
Customizable Trend Sensitivity: Adjusts ATR multipliers separately for bullish and bearish conditions.
Adaptive Supertrend Calculation: Dynamically recalculates trend direction based on volume-enhanced price movements.
Multi-Timeframe Compatibility: Can be applied across different assets and timeframes for versatile market analysis.
Visual Clarity & Alerts: Color-coded trend signals, shaded areas, and real-time alerts for trend shifts.
2. How It Works
A. Volume-Weighted Price Calculation
The indicator applies a user-selected moving average (EMA, VWMA, SMA, etc.) to price and volume data
This ensures that trend calculations are more reactive to strong volume surges and less influenced by low-liquidity fluctuations.
B. Adaptive ATR-Based Trend Filtering
ATR bands are dynamically adjusted based on volume-weighted price action.
Separate ATR multipliers for bullish and bearish conditions allow for refined sensitivity control.
The Supertrend line shifts dynamically to reflect these conditions.
C. Signal Generation
Bullish Trend: The price closes above the adaptive Supertrend line. ✅
Bearish Trend: The price closes below the adaptive Supertrend line. ❌
Long Entry: Triggered when trend direction switches from bearish to bullish.
Short Entry: Triggered when trend direction switches from bullish to bearish.
3. Visual Representation
A. Color-Coded Trend Signals
Green Trend Line: Indicates a bullish trend.
Red Trend Line: Indicates a bearish trend.
Gray Trend Line: Neutral phase.
B. Dynamic Background Fill
Shaded Green Areas: Confirmed uptrend zones.
Shaded Red Areas: Confirmed downtrend zones.
4. Customization & Parameters
ATR Length & Multipliers: Adjust trend sensitivity with separate multipliers for bullish and bearish phases.
Moving Average Type: Select from VWMA, EMA, SMA, HMA, WMA, DEMA, TEMA for volume-weighted calculations.
Volume Length: Modify how far back volume data is used to refine trend calculations.
Color Themes: Choose from 8 distinct color modes for clear visual representation.
5. Backtest & Market Applications
Backtest Summary :
The Volume Adaptive Supertrend (VWST) has been tested across multiple assets, including:
BTC/USD
ETH/USD
SOL/USD
📊 Key Observations:
Responsive Trend Detection: The volume-weighted adaptation helps minimize lag in trend shifts.
Versatile Across Market Conditions: Works well in both trending and consolidating phases with appropriate settings.
Customizable Risk Control: ATR multipliers can be adjusted to fine-tune signal sensitivity.
⚠️ Disclaimer: This indicator is designed to complement existing analysis techniques . Market conditions vary, and no tool can guarantee future performance. Always use proper risk management when trading.
6. Final Thoughts
The Volume Weighted Supertrend (VWST) enhances traditional Supertrend indicators by incorporating volume-adjusted trend detection.
Its dynamic ATR-based trend filtering ensures greater responsiveness to real market conditions.
Suitable for trend traders, breakout traders, and risk-conscious investors looking for volume-driven confirmations.
Use it alongside other confluences to build a robust trading system.
Important Reminder: No single indicator guarantees profitability. Always validate signals with additional market context. 📊
Moving Averages
Bar Color - Moving Average Convergence Divergence [nsen]The Pine Script you've provided creates a custom indicator that utilizes the MACD (Moving Average Convergence Divergence) and displays various outputs, such as bar color changes based on MACD signals, and a table of data from multiple timeframes. Here's a breakdown of how the script works:
1. Basic Settings (Input)
• The script defines several user-configurable parameters, such as the MACD values, bar colors, the length of the EMA (Exponential Moving Average) periods, and signal smoothing.
• Users can also choose timeframes to analyze the MACD values, like 5 minutes, 15 minutes, 1 hour, 4 hours, and 1 day.
2. MACD Calculation
• It uses the EMA of the close price to calculate the MACD value, with fast_length and slow_length representing the fast and slow periods. The signal_length is used to calculate the Signal Line.
• The MACD value is the difference between the fast and slow EMA, and the Signal Line is the EMA of the MACD.
• The Histogram is the difference between the MACD and the Signal Line.
3. Plotting the Histogram
• The Histogram values are plotted with colors that change based on the value. If the Histogram is positive (rising), it is colored differently than if it's negative (falling). The colors are determined by the user inputs, for example, green for bullish (positive) signals and red for bearish (negative) signals.
4. Bar Coloring
• The bar color changes based on the MACD's bullish or bearish signal. If the MACD is bullish (MACD > Signal), the bar color will change to the color defined for bullish signals, and if it's bearish (MACD < Signal), the bar color will change to the color defined for bearish signals.
5. Multi-Timeframe Data Table
• The script includes a table displaying the MACD trend for different timeframes (e.g., 5m, 15m, 1h, 4h, 1d).
• Each timeframe will show a colored indicator: green (🟩) for bullish and red (🟥) for bearish, with the background color changing based on the trend.
6. Alerts
• The script has alert conditions to notify the user when the MACD shows a bullish or bearish entry:
• Bullish Entry: When the MACD turns bullish (crosses above the Signal Line).
• Bearish Entry: When the MACD turns bearish (crosses below the Signal Line).
• Alerts are triggered with custom messages such as "🟩 MACD Bullish Entry" and "🟥 MACD Bearish Entry."
Key Features:
• Customizable Inputs: Users can adjust the MACD settings, histogram colors, and timeframe options.
• Visual Feedback: The color changes of the histogram and bars provide instant visual cues for bullish or bearish trends.
• Multi-Timeframe Analysis: The table shows the MACD trend across multiple timeframes, helping traders monitor trends in different timeframes.
• Alert Conditions: Alerts notify users when key MACD crossovers occur.

3x Supertrend + EMA200 Signal Buy/Sell [nsen]The indicator uses signals from three Supertrend lines to determine whether to trade Buy or Sell, with the assistance of a moving average for bias.
Buy/Sell signals are generated when the conditions are met:
A Buy signal is triggered when all three Supertrend lines indicate a bullish trend and are above the EMA.
A Sell signal is triggered when all three Supertrend lines indicate a bearish trend and are below the EMA.
Indicator ใช้สัญญาณจาก Supertrend ทั้งหมด 3 เส้น โดยใช้ในการกำหนดว่าจะเลือกเทรด Buy หรือ Sell โดยการใช้ moveing average เข้ามาช่วยในการ bias
แสดงสัญญาณ Buy/Sell เมื่อเข้าเงื่อนไข
- Supertrend ทั้ง 3 เส้นเป็นสัญญาณ Bullish และอยู่เหนือเส้น EMA จะเปิดสัญญาณ Buy
- Supertrend ทั้ง 3 เส้นเป็นสัญญาณ Bearish และอยู่ใต้เส้น EMA จะเปิดสัญญาณ Sell

Multi-Timeframe VWAP DashboardMulti-Timeframe VWAP Dashboard with Advanced Customization**
Unlock the power of **Volume-Weighted Average Price (VWAP)** across multiple timeframes with this highly customizable and feature-rich Pine Script. Designed for traders who demand precision and flexibility, this script provides a **comprehensive VWAP dashboard** that adapts to your trading style and strategy. Whether you're a day trader, swing trader, or long-term investor, this tool offers unparalleled insights into market trends and price levels.
---
### **Key Features:**
1. **Multi-Timeframe VWAP Calculation:**
- Calculate VWAP across **12-minute, 48-minute, 96-minute, 192-minute, daily, weekly, monthly, and even yearly timeframes**.
- Supports **custom timeframes** for tailored analysis.
2. **Price Source Selection:**
- Choose from multiple price sources for VWAP calculation, including **Open, High, Low, Close, HL2, HLC3, HLCC4, and All**.
- Optimize VWAP for **uptrends and downtrends** by selecting the most relevant price source.
3. **Customizable Labels:**
- Add **dynamic labels** to each VWAP line for quick reference.
- Customize label **colors, sizes, and offsets** to suit your chart setup.
- Display **price values** and **session types** (e.g., "12 Min", "Daily", "Weekly") directly on the chart.
4. **Advanced Session Detection:**
- Automatically detect new sessions for **intraday, daily, weekly, monthly, and yearly timeframes**.
- Ensures accurate VWAP calculations for each session.
5. **Plot Visibility Control:**
- Toggle the visibility of individual VWAP plots to **reduce clutter** and focus on the most relevant timeframes.
- Includes options for **short-term, medium-term, and long-term VWAPs**.
6. **Comprehensive Timeframe Coverage:**
- From **12-minute intervals** to **12-month intervals**, this script covers all major timeframes.
- Perfect for traders who analyze markets across multiple horizons.
7. **User-Friendly Inputs:**
- Intuitive input options for **timeframes, colors, labels, and offsets**.
- Easily customize the script to match your trading preferences.
8. **Dynamic Label Positioning:**
- Labels adjust automatically based on price movements and session changes.
- Choose from **multiple offset options** to position labels precisely.
9. **Miscellaneous Customization:**
- Adjust **text color, label size, and price display settings**.
- Enable or disable **price values** and **session type labels** for a cleaner chart.
---
### **Why Use This Script?**
- **Versatility:** Suitable for all trading styles, including scalping, day trading, swing trading, and long-term investing.
- **Precision:** Accurate VWAP calculations across multiple timeframes ensure you never miss key price levels.
- **Customization:** Tailor the script to your specific needs with a wide range of input options.
- **Clarity:** Dynamic labels and customizable plots make it easy to interpret market trends at a glance.
---
### **How It Works:**
1. **Select Your Price Source:**
- Choose the price source (e.g., Open, Close, HL2) for VWAP calculation based on your trading strategy.
2. **Choose Timeframes:**
- Define the timeframes for VWAP calculation, from intraday to yearly intervals.
3. **Customize Labels and Plots:**
- Enable or disable labels and plots for each timeframe.
- Adjust colors, sizes, and offsets to match your chart setup.
4. **Analyze Market Trends:**
- Use the VWAP lines and labels to identify **support/resistance levels**, **trend direction**, and **potential reversal points**.
5. **Adapt to Market Conditions:**
- Switch between timeframes and price sources to adapt to changing market conditions.
---
### **Ideal For:**
- **Day Traders:** Use short-term VWAPs (e.g., 12-minute, 48-minute) to identify intraday trends and key levels.
- **Swing Traders:** Leverage medium-term VWAPs (e.g., 96-minute, daily) to spot swing opportunities.
- **Long-Term Investors:** Analyze long-term VWAPs (e.g., weekly, monthly) to gauge overall market direction.
---
### **How to Get Started:**
1. Add the script to your TradingView chart.
2. Customize the inputs to match your trading preferences.
3. Analyze the VWAP lines and labels to make informed trading decisions.
---
### **Pro Tip:**
Combine this script with other technical indicators (e.g., moving averages, RSI) for a **holistic view** of the market. Use the VWAP lines as dynamic support/resistance levels to enhance your entry and exit strategies.
This script is a must-have tool for traders who value precision, flexibility, and clarity. Share it with your audience to help them elevate their trading game. Whether they're beginners or seasoned professionals, this **Multi-Timeframe VWAP Dashboard** will become an essential part of their toolkit.

3 Period EMA Cloud [deepakks444]3 Period EMA Cloud Indicator
The 3EMA Cloud Indicator uses three key EMAs to capture trends and display the market's direction through a color-coded cloud. The EMAs used in this indicator are:
High EMA: The EMA of the high prices over a specified period.
Low EMA: The EMA of the low prices over a specified period.
Additional EMA: An extra EMA, typically based on the close prices, that serves as an independent confirmation tool for trend direction.
Indicator Logic and Cloud Visualization:
The cloud is drawn between the high EMA and the low EMA, and its color changes based on the price's relationship to the high EMA, low EMA, and additional EMA.
Cloud Color:
Green Cloud: When the price is above both the high EMA and the low EMA, it signals a bullish trend, and the cloud turns green.
Additionally, if the close price is above the Additional EMA, this further confirms the bullish trend.
Red Cloud: When the price is below both the high EMA and the low EMA, it signals a bearish trend, and the cloud turns red.
Additionally, if the close price is below the Additional EMA, this further confirms the bearish trend.
How the Indicator Captures Trends:
Bullish Market:
Price above both high EMA and low EMA: This indicates that the market is in an uptrend, and the cloud will turn green.
Confirmation with Additional EMA: When the close price is above the Additional EMA, this reinforces the bullish market sentiment.
The green cloud is the visual confirmation of a bullish trend, guiding traders to consider long positions.
Bearish Market:
Price below both high EMA and low EMA: This indicates that the market is in a downtrend, and the cloud will turn red.
Confirmation with Additional EMA: When the close price is below the Additional EMA, this confirms the bearish trend.
The red cloud is the visual confirmation of a bearish trend, guiding traders to consider short positions.
Key Components:
High EMA: Calculates the EMA based on high prices, which helps to determine the upper boundary of the cloud.
Low EMA: Calculates the EMA based on low prices, which helps to determine the lower boundary of the cloud.
Additional EMA: An extra EMA (often of the close prices) that acts as an independent trend confirmation. This is used to validate the market direction and filter out potential false signals.
Use Cases for the 3EMA Cloud:
Trend Identification:
The cloud helps to visually identify the prevailing trend. A green cloud suggests a bullish trend, while a red cloud indicates a bearish trend.
Confirmation Tool:
The Additional EMA serves as an additional confirmation tool. A close price above the Additional EMA signals a strong bullish trend, while a close below it signals a strong bearish trend.
Market Reversals:
When the price moves from above both the high EMA and low EMA to below them (or vice versa), this could indicate a trend reversal. Pay attention to cloud color changes and the movement of the close price relative to the Additional EMA for potential reversal signals.
Entry and Exit Signals:
Long Entry (Buy Signal):
Price is above both the high EMA and low EMA, confirming a bullish trend.
Close price is above the Additional EMA, confirming the bullish trend.
Enter a long position when the cloud turns green and the confirmation by the Additional EMA is in place.
Short Entry (Sell Signal):
Price is below both the high EMA and low EMA, confirming a bearish trend.
Close price is below the Additional EMA, confirming the bearish trend.
Enter a short position when the cloud turns red and the confirmation by the Additional EMA is in place.
Exit Signal:
Exit Long Position when the price moves below both the high EMA and low EMA (signaling a potential trend reversal), or if the close price falls below the Additional EMA.
Exit Short Position when the price moves above both the high EMA and low EMA (signaling a potential trend reversal), or if the close price rises above the Additional EMA.
How This Indicator Improves Trend Following:
The 3EMA Cloud indicator enhances trend-following strategies by:
Visual Clarity: The color-coded cloud provides immediate visual feedback on whether the market is in a bullish or bearish phase.
Price Confirmation: The indicator uses the relationship of price to three EMAs (high, low, and additional) to confirm trend strength, which can help reduce false signals.
Flexibility: The Additional EMA adds flexibility by serving as an independent confirmation tool for trend direction, ensuring that you don’t enter trades based on weak or choppy market conditions.
This 3EMA Cloud indicator is designed to help traders follow and confirm trends with precision, improving their ability to identify strong market movements and avoid getting caught in sideways or choppy conditions. It provides a clear visual cue for potential buy and sell opportunities based on price relative to multiple EMAs, ensuring that trend-following strategies are robust and effective.
Disclaimer:
This script and its associated indicators are for educational purposes only. The information provided does not constitute financial advice or a recommendation to buy or sell any financial instruments. Users are advised to conduct their own research and consult with a professional financial advisor before making any trading decisions. Trading and investing involve risk, and users should be aware of the risks involved in financial markets.
[GYTS] Filters ToolkitFilters Toolkit indicator
🌸 Part of GoemonYae Trading System (GYTS) 🌸
🌸 --------- 1. INTRODUCTION --------- 🌸
💮 Overview
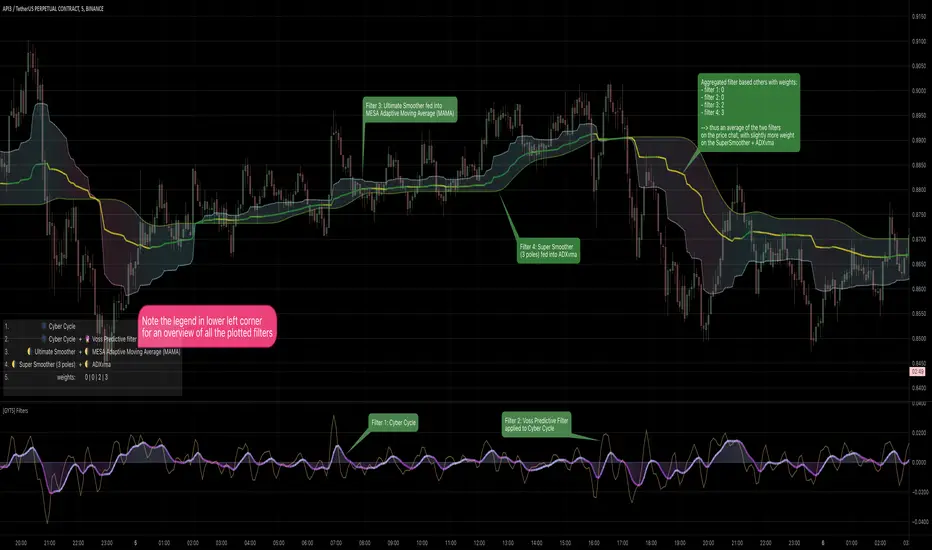
The GYTS Filters Toolkit indicator is an advanced, interactive interface built atop the high‐performance, curated functions provided by the FiltersToolkit library . It allows traders to experiment with different combinations of filtering methods -— from smoothing low-pass filters to aggressive detrenders. With this toolkit, you can build custom indicators tailored to your specific trading strategy, whether you're looking for trend following, mean reversion, or cycle identification approaches.
🌸 --------- 2. FILTER METHODS AND TYPES --------- 🌸
💮 Filter categories
The available filters fall into four main categories, each marked with a distinct symbol:
🌗 Low Pass Filters (Smoothers)
These filters attenuate high-frequency components (noise) while allowing low-frequency components (trends) to pass through. Examples include:
Ultimate Smoother
Super Smoother (2-pole and 3-pole variants)
MESA Adaptive Moving Average (MAMA) and Following Adaptive Moving Average (FAMA)
BiQuad Low Pass Filter
ADXvma (Adaptive Directional Volatility Moving Average)
A2RMA (Adaptive Autonomous Recursive Moving Average)
Low pass filters are displayed on the price chart by default, as they follow the overall price movement. If they are combined with a high-pass or bandpass filter, they will be displayed in the subgraph.
🌓 High Pass Filters (Detrenders)
These filters do the opposite of low pass filters - they remove low-frequency components (trends) while allowing high-frequency components to pass through. Examples include:
Butterworth High Pass Filter
BiQuad High Pass Filter
High pass filters are displayed as oscillators in the subgraph below the price chart, as they fluctuate around a zero line.
🌑 Band Pass Filters (Cycle Isolators)
These filters combine aspects of both low and high pass filters, isolating specific frequency ranges while attenuating both higher and lower frequencies. Examples include:
Ehlers Bandpass Filter
Cyber Cycle
Relative Vigor Index (RVI)
BiQuad Bandpass Filter
Band pass filters are also displayed as oscillators in a separate panel.
🔮 Predictive Filter
Voss Predictive Filter: A special filter that attempts to predict future values of band-limited signals (only to be used as post-filter). Keep its prediction horizon short (1–3 bars) for reasonable accuracy.
Note that the the library contains elaborate documentation and source material of each filter.
🌸 --------- 3. INDICATOR FEATURES --------- 🌸
💮 Multi-filter configuration
One of the most powerful aspects of this indicator is the ability to configure multiple filters. compare them and observe their combined effects. There are four primary filters, each with its own parameter settings.
💮 Post-filtering
Process a filter’s output through an additional filter by enabling the post-filter option. This creates a filter chain where the output of one filter becomes the input to another. Some powerful combinations include:
Ultimate Smoother → MAMA: Creates an adaptive smoothing effect that responds well to market changes, good for trend-following strategies
Butterworth → Super Smoother → Butterworth: Produces a well-behaved oscillator with minimal phase distortion, John Ehlers also calls a "roofing filter". Great for identifying overbought/oversold conditions with minimal lag.
A bandpass filter → Voss Prediction filter: Attempts to predict future movements of cyclical components, handy to find peaks and troughs of the market cycle.
💮 Aggregate filters
Arguably the coolest feature: aggregating filters allow you to combine multiple filters with different weights. Important notes about aggregation:
You can only aggregate filters that appear on the same chart (price chart or oscillator panel).
The weights are automatically normalised, so only their relative values matter
Setting a weight to 0 (zero) excludes that filter from the aggregation
Filters don't need to be visibly displayed to be included in aggregation
💮 Rich visualisation & alerts
The indicator intelligently determines whether a filter is displayed on the price chart or in the subgraph (as an oscillator) based on its characteristics.
Dynamic colour palettes, adjustable line widths, transparency, and custom fill between any of enabled filters or between oscillators and the zero-line.
A clear legend showing which filters are active and how they're configured
Alerts for direction changes and crossovers of all filters
🌸 --------- 4. ACKNOWLEDGEMENTS --------- 🌸
This toolkit builds on the work of numerous pioneers in technical analysis and digital signal processing:
John Ehlers, whose groundbreaking research forms the foundation of many filters.
Robert Bristow-Johnson for the BiQuad filter formulations.
The TradingView community, especially @The_Peaceful_Lizard, @alexgrover, and others mentioned in the code of the library.
Everyone who has provided feedback, testing and support!
Triple HMA Colored [Chichomax]Triple HMA Colored Indicator Description
The Triple HMA Colored indicator is a sophisticated technical analysis tool designed to enhance trend identification by displaying three Hull Moving Averages (HMAs) on your chart, each with fully customizable periods and dynamic color settings. This indicator is built on the refined HMA calculation method, which leverages weighted moving averages (WMAs) to generate smooth and responsive trend lines with minimal lag.
Key Features:
- Triple HMA Setup:
Displays three HMAs, each computed with different, user-configurable periods, enabling multi-timeframe analysis in a single indicator.
- Dynamic Color Coding:
Each HMA line is color-coded based on its directional movement. When the current HMA value exceeds the previous value, the line is drawn in the designated "up" color, and when it falls below, it switches to the "down" color. This provides immediate visual cues for trend shifts.
- Customizable Inputs:
Users can adjust the period lengths for each of the three HMAs and select from six different color options (two for each HMA) directly from the indicator’s settings panel, ensuring that the tool can be tailored to match various trading strategies and visual preferences.
- Efficient Trend Detection:
By combining the speed of WMAs with the smoothness of the Hull Moving Average, this indicator offers a reliable method to detect market momentum changes, making it a valuable asset for both trend-following and counter-trend strategies.
Ideal for traders who demand flexibility and clarity in their chart analysis, the Triple HMA Colored indicator simplifies the process of tracking market trends across multiple timeframes while providing clear, visual signals for potential entry and exit points.

[TehThomas] - MA Cross with DisplacementThis TradingView script, "MA Cross with Displacement," is designed to detect potential long and short trade opportunities based on moving average (MA) crossovers combined with price displacement confirmation. The script utilizes two simple moving averages (SMA) and highlights potential trade signals when a crossover occurs alongside a strong price movement (displacement).
Why This Indicator is Useful
This indicator enhances the standard moving average crossover strategy by incorporating a displacement condition, making trade signals more reliable. Many traders rely on moving average crossovers to determine trend reversals, but false signals often occur due to minor price fluctuations. By requiring a significant price movement (displacement), this indicator helps filter out weak or insignificant crossovers, leading to more high-probability trade opportunities.
How It Works
Calculates Two Moving Averages (MA)
The user can set two different MA periods:
MA 1 (blue line): Default period is 9 (shorter-term trend).
MA 2 (red line): Default period is 21 (longer-term trend).
These moving averages smooth out price fluctuations to identify overall trends.
Detects Crossovers
Bullish crossover: The blue MA crosses above the red MA + displacement candle → Potential long signal.
Example of bullish cross with displacement:
Bearish crossover: The blue MA crosses below the red MA + displacement candle → Potential short signal.
Example of bearish cross with displacement:
Confirms Displacement (Strong Price Move)
A price displacement threshold is used (default: 1.1% of the previous candle size).
For a valid trade signal, a crossover must occur alongside a strong price movement.
Bullish Displacement Condition: Price increased by more than the threshold.
Bearish Displacement Condition: Price decreased by more than the threshold.
Visual Indicators on the Chart
Bars are colored green when there is a bullish displacement.
Bars are colored red when there is a bearish displacement.
These color changes help traders quickly identify potential trade setups.
How to Use the Indicator
Add the Script to Your Chart
Copy and paste the script into TradingView's Pine Script Editor.
Click "Add to Chart" to activate it.
Customize the Settings
Adjust the moving average periods to fit your trading strategy.
Modify the displacement threshold based on market volatility.
Change the bar colors for better visualization.
Look for Trade Signals
Long Trade (Buy Signal)
The blue MA crosses above the red MA (bullish crossover).
A green bar appears, confirming bullish displacement.
Short Trade (Sell Signal)
The blue MA crosses below the red MA (bearish crossover).
A red bar appears, confirming bearish displacement.
Use in Conjunction with Other Indicators
This indicator works best when combined with support & resistance levels, RSI, MACD, or volume analysis to improve trade accuracy.
Final Thoughts
The MA Cross with Displacement Indicator improves the reliability of moving average crossovers by requiring strong price movements to confirm a trade signal. This helps traders avoid false breakouts and weak trends, making it a powerful tool for identifying high-probability trades.
__________________________________________
Thanks for your support!
If you found this idea helpful or learned something new, drop a like 👍 and leave a comment—I’d love to hear your thoughts! 🚀
Make sure to follow me for more price action insights, free indicators, and trading strategies. Let’s grow and trade smarter together! 📈✨

Sniper TradingSniper Trader Indicator Overview
Sniper Trader is a comprehensive trading indicator designed to assist traders by providing valuable insights and alerting them to key market conditions. The indicator combines several technical analysis tools and provides customizable inputs for different strategies and needs.
Here’s a detailed breakdown of all the components and their functions in the Sniper Trader indicator:
1. MACD (Moving Average Convergence Divergence)
The MACD is a trend-following momentum indicator that helps determine the strength and direction of the current trend. It consists of two lines:
MACD Line (Blue): Calculated by subtracting the long-term EMA (Exponential Moving Average) from the short-term EMA.
Signal Line (Red): The EMA of the MACD line, typically set to 9 periods.
What does it do?
Buy Signal: When the MACD line crosses above the signal line, it generates a buy signal.
Sell Signal: When the MACD line crosses below the signal line, it generates a sell signal.
Zero Line Crossings: Alerts are triggered when the MACD line crosses above or below the zero line.
2. RSI (Relative Strength Index)
The RSI is a momentum oscillator used to identify overbought or oversold conditions in the market.
Overbought Level (Red): The level above which the market might be considered overbought, typically set to 70.
Oversold Level (Green): The level below which the market might be considered oversold, typically set to 30.
What does it do?
Overbought Signal: When the RSI crosses above the overbought level, it’s considered a signal that the asset may be overbought.
Oversold Signal: When the RSI crosses below the oversold level, it’s considered a signal that the asset may be oversold.
3. ATR (Average True Range)
The ATR is a volatility indicator that measures the degree of price movement over a specific period (14 bars in this case). It provides insights into how volatile the market is.
What does it do?
The ATR value is plotted on the chart and provides a reference for potential market volatility. It's used to detect flat zones, where the price may not be moving significantly, potentially indicating a lack of trends.
4. Support and Resistance Zones
The Support and Resistance Zones are drawn by identifying key swing highs and lows over a user-defined look-back period.
Support Zone (Green): Identifies areas where the price has previously bounced upwards.
Resistance Zone (Red): Identifies areas where the price has previously been rejected or reversed.
What does it do?
The indicator uses swing highs and lows to define support and resistance zones and highlights these areas on the chart. This helps traders identify potential price reversal points.
5. Alarm Time
The Alarm Time feature allows you to set a custom time for the indicator to trigger an alarm. The time is based on Eastern Time and can be adjusted directly in the inputs tab.
What does it do?
It triggers an alert at a user-defined time (for example, 4 PM Eastern Time), helping traders close positions or take specific actions at a set time.
6. Market Condition Display
The Market Condition Display shows whether the market is in a Bullish, Bearish, or Flat state based on the MACD line’s position relative to the signal line.
Bullish (Green): The market is in an uptrend.
Bearish (Red): The market is in a downtrend.
Flat (Yellow): The market is in a range or consolidation phase.
7. Table for Key Information
The indicator includes a customizable table that displays the current market condition (Bull, Bear, Flat). The table is placed at a user-defined location (top-left, top-right, bottom-left, bottom-right), and the appearance of the table can be adjusted for text size and color.
8. Background Highlighting
Bullish Reversal: When the MACD line crosses above the signal line, the background is shaded green to highlight the potential for a trend reversal to the upside.
Bearish Reversal: When the MACD line crosses below the signal line, the background is shaded red to highlight the potential for a trend reversal to the downside.
Flat Zone: A flat zone is identified when volatility is low (ATR is below the average), and the background is shaded orange to signal periods of low market movement.
Key Features:
Customizable Time Inputs: Adjust the alarm time based on your local time zone.
User-Friendly Table: Easily view market conditions and adjust display settings.
Comprehensive Alerts: Receive alerts for MACD crossovers, RSI overbought/oversold conditions, flat zones, and the custom alarm time.
Support and Resistance Zones: Drawn automatically based on historical price action.
Trend and Momentum Indicators: Utilize the MACD and RSI for identifying trends and market conditions.
How to Use Sniper Trader:
Set Your Custom Time: Adjust the alarm time to match your trading schedule.
Monitor Market Conditions: Check the table for real-time market condition updates.
Use MACD and RSI Signals: Watch for MACD crossovers and RSI overbought/oversold signals.
Watch for Key Zones: Pay attention to the support and resistance zones and background highlights to identify market turning points.
Set Alerts: Use the built-in alerts to notify you of buy/sell signals or when it’s time to take action at your custom alarm time.

Money Flow Indicator (Chaikin Oscillator) with VWAPStrategy Overview
Entry Conditions:
Buy Entry:
The Chaikin Oscillator crosses above the signal line.
The current price is above the VWAP.
Sell Entry:
The Chaikin Oscillator crosses below the signal line.
The current price is below the VWAP.
Exit Conditions:
Profit Taking:
Take profit when a target profit is reached (e.g., a 2% increase from the entry price).
Stop Loss:
Set a stop loss, for example, at a 1% decline from the entry price.
Risk Management:
Manage risk by limiting each trade to no more than 1-2% of the account balance.
Calculate position size based on risk and trade accordingly.
Trend Confirmation:
Use other indicators (like moving averages) to confirm the overall trend and focus trades in the direction of the trend.
In an uptrend, prioritize buy entries; in a downtrend, prioritize sell entries.
Specific Trade Scenarios
Example 1: Buy Entry:
Enter a buy position when the Chaikin Oscillator crosses above the signal line and the price is above the VWAP.
Set a stop loss 1% below the entry price and a profit target 2% above the entry price.
Example 2: Sell Entry:
Enter a sell position when the Chaikin Oscillator crosses below the signal line and the price is below the VWAP.
Set a stop loss 1% above the entry price and a profit target 2% below the entry price.
Additional Considerations
Backtesting: Test this strategy with historical data to evaluate performance and make adjustments as needed.
Market Conditions: Pay attention to market volatility and economic indicators, adjusting the trading strategy flexibly.
Psychological Factors: Avoid emotional decisions and follow clear rules when trading.

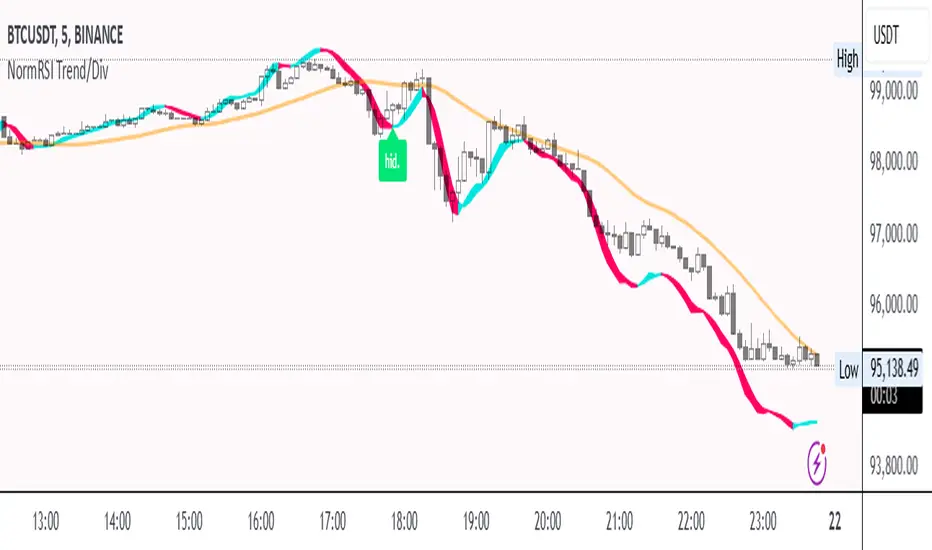
Normalized RSI Trendline with DivergencesNormalized RSI Trendline with Divergences
🔹 Overview
The Normalized RSI Trendline with Divergences indicator enhances traditional RSI analysis by normalizing RSI values within a defined range and applying a trend-following approach. It also detects bullish and bearish divergences to highlight potential trend reversals.
🔹 Features
✔ Normalized RSI Calculation – The RSI values are normalized between -1 and 1 to provide a clearer representation of market momentum.
✔ Trend & Center Lines – A trendline based on linear regression and an adaptive moving average (ALMA) for smoother trend visualization.
✔ Divergence Detection – Identifies regular and hidden divergences, displaying signals directly on the chart.
✔ Customizable Parameters – Users can adjust the signal period, lookback range, trend length, and divergence sensitivity to fit different trading strategies.
🔹 How to Use
Trend Following: The trendline helps identify the overall market direction.
Divergence Signals:
🟢 Bullish Divergence (Potential upward reversal)
🔴 Bearish Divergence (Potential downward reversal)
🟩 Hidden Bullish Divergence (Trend continuation signal)
🟧 Hidden Bearish Divergence (Trend continuation signal)
This script is suitable for trend traders, swing traders, and divergence-based strategies. Customize the settings to match your preferred trading style. 🚀
📌 Disclaimer: This script is for educational purposes only and does not constitute financial advice. Always conduct your own analysis before making trading decisions.
EMA POD Indicator #gangesThis script is a technical analysis indicator that uses multiple Exponential Moving Averages (EMAs) to identify trends and track price changes in the market. Here's a breakdown:
EMA Calculation: It calculates six different EMAs (for periods 5, 10, 20, 50, 100, and 150) to track short- and long-term trends.
Trend Identification:
Uptrend: The script identifies an uptrend when the EMAs are in ascending order (EMA5 > EMA10 > EMA20 > EMA50 > EMA100 > EMA150).
Downtrend: A downtrend is identified when the EMAs are not in ascending order.
Trend Change Tracking: It tracks when an uptrend starts and ends, displaying the duration of the trend and the percentage price change during the trend.
Visuals:
It plots the EMAs on the chart with different colors.
It adds green and red lines to represent the ongoing uptrend and downtrend.
Labels are displayed showing when the uptrend starts and ends, along with the trend's duration and price change percentage.
In short, this indicator helps visualize trends, track their changes, and measure the impact of those trends on price.

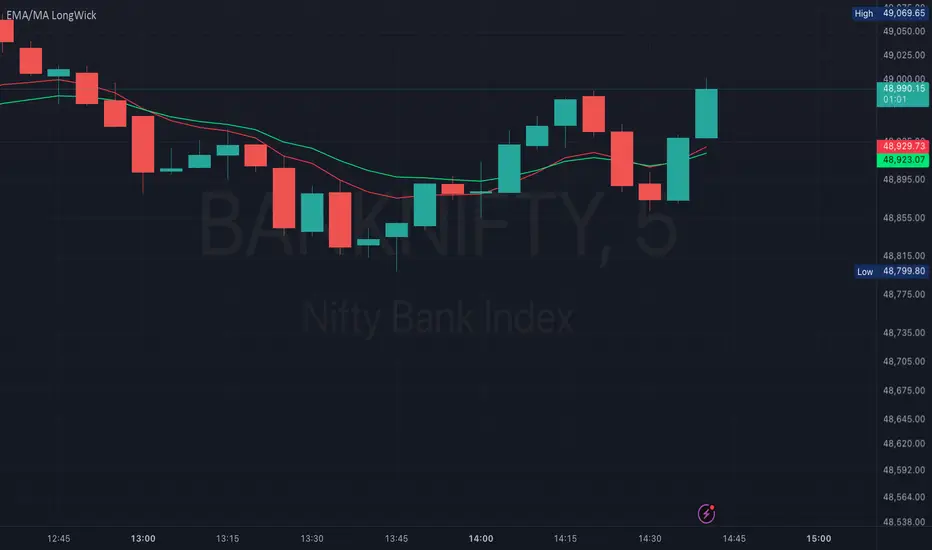
EMA/MA with OHCL Candle and Long Wick – A Comprehensive Trading
Dear Traders,
I am excited to introduce EMA/MA with OHCL Candle and Long Wick, a powerful trading indicator designed to enhance market analysis by combining Exponential Moving Averages (EMA), Simple Moving Averages (MA), OHCL candle patterns, and long wick detection into a single tool.
Key Features:
✅ Customizable Wick Size & Timeframe – Adapt the indicator to different market conditions by adjusting wick size and analyzing price action over any timeframe.
✅ EMA & MA for Trend Analysis – Includes multiple EMAs and MAs (5, 9, 15, 20, 50, 100, 200) to help identify trends and potential reversals.
✅ Long Wick Signal Detection – Identifies strong Buy and Sell opportunities based on wick size, signaling potential market turning points.
✅ OHCL Candle Analysis – Highlights OHCL patterns to provide additional insights into price action.
✅ User-Friendly & Lightweight – Efficiently coded for seamless performance on TradingView.
This indicator is perfect for traders looking to refine their entry and exit strategies by leveraging price action and moving averages. Whether you're a scalper, day trader, or swing trader, this tool provides valuable insights to enhance your decision-making.
Give it a try, and let me know your feedback! 🚀
Best regards,
Purnendu Singh
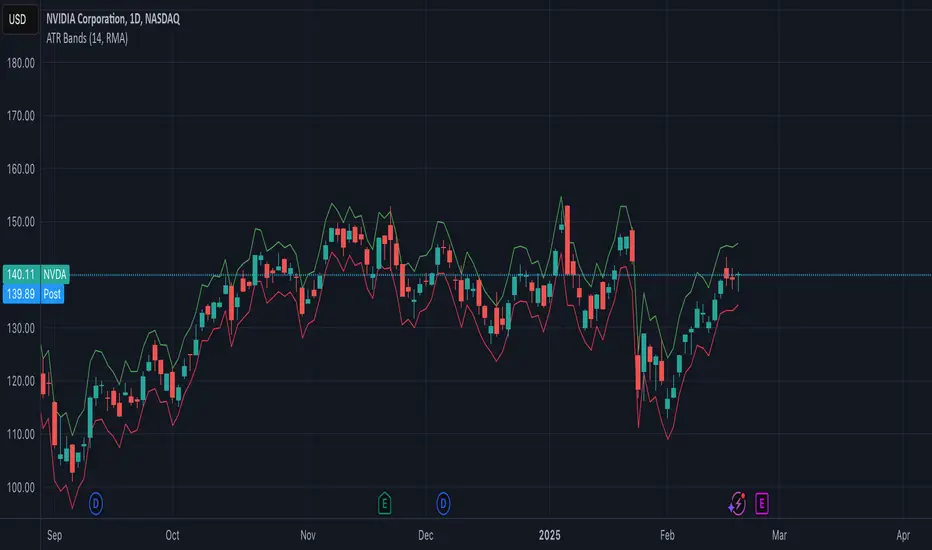
ATR BandsThe ATR Bands indicator is a volatility-based tool that plots dynamic support and resistance levels around the price using the Average True Range (ATR). It consists of two bands:
Upper Band: Calculated as current price + ATR, representing an upper volatility threshold.
Lower Band: Calculated as current price - ATR, serving as a lower volatility threshold.
Key Features:
✅ Measures Volatility: Expands and contracts based on market volatility.
✅ Dynamic Support & Resistance: Helps identify potential breakout or reversal zones.
✅ Customizable Smoothing: Supports multiple moving average methods (RMA, SMA, EMA, WMA) for ATR calculation.
How to Use:
Trend Confirmation: If the price consistently touches or exceeds the upper band, it may indicate strong bullish momentum.
Reversal Signals: A price approaching the lower band may suggest a potential reversal or increased selling pressure.
Volatility Assessment: Wide bands indicate high volatility, while narrow bands suggest consolidation.
This indicator is useful for traders looking to incorporate volatility-based strategies into their trading decisions
Dynamic VWAP Levels (V1.0)The script calculates bands around the VWAP (Volume Weighted Average Price) using the Average True Range (ATR) to adjust the levels according to market reality. Buy and sell signals are generated when the price crosses these bands.
Customizable Parameters SmoothingLength (SmoothLength): The period used to smooth the levels. A higher value results in smoother bands that are less susceptible to rapid fluctuations.
Use EMA for smoothing?: Selects between using the Exponential Moving Average (EMA) or the Simple Moving Average (SMA) for smoothing.
ATR Length: The period used to calculate the ATR, which determines the frequency.
ATR Multiplier: A multiplier that adjusts the amplitude of the bands around the VWAP.
How the Script Works Calculating VWAP and Bands: The VWAP is calculated to obtain the volume weighted average price.
Bands are created around the VWAP by adding or subtracting a fraction of the ATR to account for the current market variation.
Smoothing Application: Price levels are smoothed to reduce market noise, allowing for better visualization of trends.
Signal Generation: Buy Signal: Generated when price crosses upwards the smoothed lower band (default dp7_smooth).
Sell Signal: Generated when price crosses downwards the smoothed upper band (default dp1_smooth).

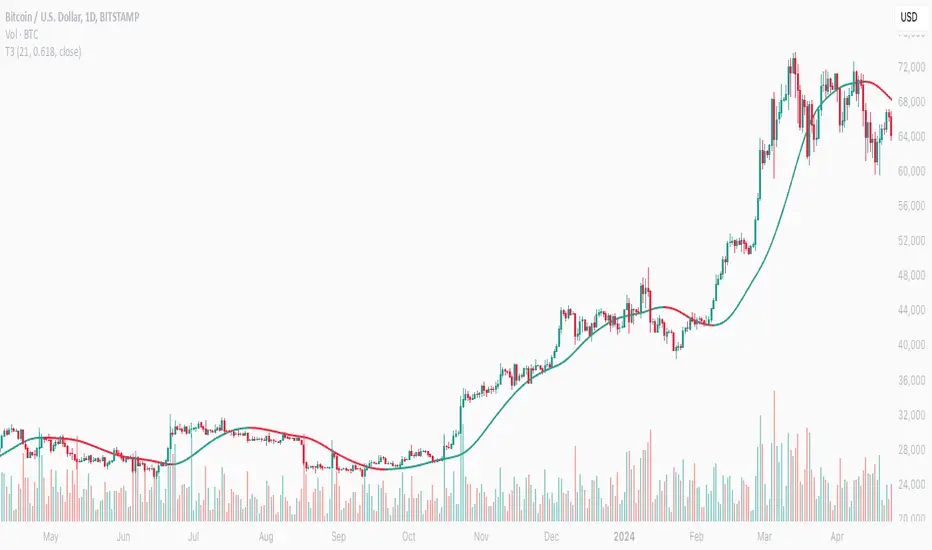
Tillson T3 Moving Average (improved)T3 Moving Average – Advanced Smoothing for Trend Analysis
Overview
The Tillson T3 Moving Average (T3 MA) is a superior smoothing moving average that reduces lag while maintaining responsiveness to price changes. Unlike traditional moving averages such as SMA, EMA, or WMA, the T3 applies multiple levels of smoothing, making it more adaptive to market conditions.
How It Works
The T3 MA is an exponentially smoothed moving average with a factor that controls the level of smoothing. This multi-layered smoothing process allows it to:
✅ React faster than a standard EMA while still filtering out market noise.
✅ Smooth out price fluctuations better than SMA or WMA, reducing false signals.
✅ Reduce lag compared to traditional moving averages, making it useful for both trend identification and entry/exit decisions.
How to Use This Script
🔹 Trend Identification – Use T3 MA as a dynamic trend filter. Price above T3 signals an uptrend, while price below signals a downtrend.
🔹 Direction Signal – The direction of the T3 MA (i.e. sloping upwards or downwards) can itself be used as a signal. The script allows the MA line to be colored, so it's easier to spot.
🔹 Crossover Signals – Combine T3 with another moving average (e.g., a shorter T3 or EMA, SMA, etc.) to generate trade signals when they cross.
🔹 Support & Resistance – The T3 can act as dynamic support and resistance in trending markets.
Features of This Script
✅ Custom Source Selection – Apply T3 not just to price, but also to any indicator (e.g., RSI, volume, etc.).
✅ Customizable Length & Smoothing – Adjust how smooth and responsive the T3 MA is.
✅ Optional Color Changes – The T3 MA can dynamically change color based on trend direction, making it easier to read.
✅ Versatile for Any Strategy – Works well in trend-following, mean-reversion, and breakout trading systems.
This script is ideal for traders looking for a smoother, more adaptive moving average that reduces noise while remaining reactive to price action. 🚀
BoBosseTrading_HMA_TheBestIntroducing the HMA % Offset Indicator – a powerful tool designed to capture high-probability reversal zones with exceptional clarity and precision. This indicator leverages the Hull Moving Average (HMA) as its foundation, using a default length of 600 to ensure smooth and reliable trend analysis. Two dynamic offset lines are then derived at a user-defined percentage (defaulting to 2% above and below the HMA), creating critical zones where market reversals are most likely to occur.
15min 1%
30min 2%
1H 3%
...
Key Features:
Advanced HMA Calculation:
The indicator computes a Hull Moving Average with a robust default setting of 600, ensuring that the trend analysis is both smooth and responsive to market changes.
Dynamic Offset Lines:
Two offset lines are generated at ±2% of the HMA. These lines act as visual thresholds—when price action breaks above or below these levels, it signals a potential reversal.
Reversal Signal Detection:
The indicator uses a unique, reversely-triggered signal system. It checks the previous bar's close relative to the offset lines and assigns a Long (1) or Short (-1) signal accordingly. When a new signal is detected, it marks the start of a new potential trend.
Visual Arrow Markers:
To enhance clarity, the indicator places eye-catching arrow markers at the start of each new signal:
A green upward arrow appears when a Long signal is generated.
A red downward arrow appears when a Short signal is initiated.
Dynamic Color Coding:
The offset lines adjust their colors based on the active signal:
During a Long signal, the lower offset line turns green (highlighting support), while the upper offset line fades to a subtle blue.
Conversely, during a Short signal, the upper offset line turns red (emphasizing resistance), while the lower offset line is muted.
Clean and Uncluttered Display:
The indicator intentionally hides the HMA itself, allowing you to focus solely on the critical offset zones and reversal signals. This streamlined approach minimizes chart clutter, making your trading decisions more straightforward and effective.
Whether you're a trend follower or a reversal trader, the HMA % Offset Indicator equips you with a precise visual framework for identifying key market turning points. Experience enhanced entry timing, reduced noise, and a cleaner chart view with this must-have indicator for dynamic trading environments.
Elevate your trading strategy with the HMA % Offset Indicator – where technical precision meets actionable insights!

Uptrick: Alpha TrendIntroduction
Uptrick: Alpha Trend is a comprehensive technical analysis indicator designed to provide traders with detailed insights into market trends, momentum, and risk metrics. It adapts to various trading styles—from quick scalps to longer-term positions—by dynamically adjusting its calculations and visual elements. By combining multiple smoothing techniques, advanced color schemes, and customizable data tables, the indicator offers a holistic view of market behavior.
Originality
The Alpha Trend indicator distinguishes itself by blending established technical concepts with innovative adaptations. It employs three different smoothing techniques tailored to specific trading modes (Scalp, Swing, and Position), and it dynamically adjusts its parameters to match the chosen mode. The indicator also offers a wide range of color palettes and multiple on-screen tables that display key metrics. This unique combination of features, along with its ability to adapt in real time, sets it apart as a versatile tool for both novice and experienced traders.
Features
1. Multi-Mode Trend Line
The indicator automatically selects a smoothing method based on the trading mode:
- Scalp Mode uses the Hull Moving Average (HMA) for rapid responsiveness.
- Swing Mode employs the Exponential Moving Average (EMA) for balanced reactivity.
- Position Mode applies the Weighted Moving Average (WMA) for smoother, long-term trends.
Each method is chosen to best capture the price action dynamics appropriate to the trader’s timeframe.
2. Adaptive Momentum Thresholds
It tracks bullish and bearish momentum with counters that increment as the trend confirms directional movement. When these counters exceed a user-defined threshold, the indicator generates optional buy or sell signals. This approach helps filter out minor fluctuations and highlights significant market moves.
3. Gradient Fills
Two types of fills enhance visual clarity:
- Standard Gradient Fill displays ATR-based zones above and below the trend line, indicating potential bullish and bearish areas.
- Fading Gradient Fill creates a smooth transition between the trend line and the price, visually emphasizing the distance between them.
4. Bar Coloring and Signal Markers
The indicator can color-code bars based on market conditions—bullish, bearish, or neutral—allowing for immediate visual assessment. Additionally, signal markers such as buy and sell arrows are plotted when momentum thresholds are breached.
5. Comprehensive Data Tables
Uptrick: Alpha Trend offers several optional tables for detailed analysis:
- Insider Info: Displays key metrics like the current trend value, bullish/bearish momentum counts, and ATR.
- Indicator Metrics: Lists input settings such as trend length, damping, signal threshold, and net momentum.
- Market Analysis: Summarizes overall trend direction, trend strength, Sortino ratio, return, and volatility.
- Price & Trend Dynamics: Details price deviation from the trend, trend slope, and ATR ratio.
- Momentum & Volatility Insights: Presents RSI, standard deviation (volatility), and net momentum.
- Performance & Acceleration Metrics: Focuses on the Sortino ratio, trend acceleration, return, and trend strength.
Each table can be positioned flexibly on the chart, allowing traders to customize the layout according to their needs.
Why It Combines Specific Smoothing Techniques
Smoothing techniques are essential for filtering out market noise and revealing underlying trends. The indicator combines three smoothing methods for the following reasons:
- The Hull Moving Average (HMA) in Scalp Mode minimizes lag and responds quickly to price changes, which is critical for short-term trading.
- The Exponential Moving Average (EMA) in Swing Mode gives more weight to recent data, striking a balance between speed and smoothness. This makes it suitable for mid-term trend analysis.
- The Weighted Moving Average (WMA) in Position Mode smooths out short-term fluctuations, offering a clear view of longer-term trends and reducing the impact of transient market volatility.
By using these specific methods in their respective trading modes, the indicator ensures that the trend line is appropriately responsive for the intended time frame, enhancing decision-making while maintaining clarity.
Inputs
1. Trend Length (Default: 30)
Defines the lookback period for the smoothing calculation. A shorter trend length results in a more responsive line, while a longer length produces a smoother, less volatile trend.
2. Trend Damping (Default: 0.75)
Controls the degree of smoothing applied to the trend line. Lower values lead to a smoother curve, whereas higher values increase sensitivity to price fluctuations.
3. Signal Strength Threshold (Default: 5)
Specifies the number of consecutive bullish or bearish bars required to trigger a signal. Higher thresholds reduce the frequency of signals, focusing on stronger moves.
4. Enable Bar Coloring (Default: True)
Toggles whether each price bar is colored to indicate bullish, bearish, or neutral conditions.
5. Enable Signals (Default: True)
When enabled, this option plots buy or sell arrows on the chart once the momentum thresholds are met.
6. Enable Standard Gradient Fill (Default: False)
Activates ATR-based gradient fills around the trend line to visualize potential support and resistance zones.
7. Enable Fading Gradient Fill (Default: True)
Draws a gradual color transition between the trend line and the current price, emphasizing their divergence.
8. Trading Mode (Options: Scalp, Swing, Position)
Determines which smoothing method and ATR period to use, adapting the indicator’s behavior to short-term, medium-term, or long-term trading.
9. Table Position Inputs
Allows users to select from nine possible chart positions (top, middle, bottom; left, center, right) for each data table.
10. Show Table Booleans
Separate toggles control the display of each table (Insider Info, Indicator Metrics, Market Analysis, and the three Deep Tables), enabling a customized view of the data.
Color Schemes
(Default) - The colors in the preview image of the indicator.
(Emerald)
(Sapphire)
(Golden Blaze)
(Mystic)
(Monochrome)
(Pastel)
(Vibrant)
(Earth)
(Neon)
Calculations
1. Trend Line Methods
- Scalp Mode: Utilizes the Hull Moving Average (HMA), which computes two weighted moving averages (one at half the length and one at full length), subtracts them, and then applies a final weighted average based on the square root of the length. This method minimizes lag and increases responsiveness.
- Swing Mode: Uses the Exponential Moving Average (EMA), which assigns greater weight to recent prices, thus balancing quick reaction with smoothness.
- Position Mode: Applies the Weighted Moving Average (WMA) to focus on longer-term trends by emphasizing the entire lookback period and reducing the impact of short-term volatility.
2. Momentum Tracking
The indicator maintains separate counters for bullish and bearish momentum. These counters increase as the trend confirms directional movement and reset when the trend reverses. When a counter exceeds the defined signal strength threshold, a corresponding signal (buy or sell) is triggered.
3. Volatility and ATR Zones
The Average True Range (ATR) is calculated using a period that adapts to the selected trading mode (shorter for Scalp, longer for Position). The ATR value is then used to define upper and lower zones around the trend line, highlighting the current level of market volatility.
4. Return and Trend Acceleration
- Return is calculated as the difference between the current and previous closing prices, providing a simple measure of price change.
- Trend Acceleration is derived from the change in the trend line’s movement (its first derivative) compared to the previous bar. This metric indicates whether the trend is gaining or losing momentum.
5. Sortino Ratio and Standard Deviation
- The Sortino Ratio measures risk-adjusted performance by comparing returns to downside volatility (only considering negative price changes).
- Standard Deviation is computed over the lookback period to assess the extent of price fluctuations, offering insights into market stability.
Usage
This indicator is suitable for various time frames and market instruments. Traders can enable or disable specific visual elements such as gradient fills, bar coloring, and signal markers based on their preference. For a minimalist approach, one might choose to display only the primary trend line. For a deeper analysis, enabling multiple tables can provide extensive data on momentum, volatility, trend dynamics, and risk metrics.
Important Note on Risk
Trading involves inherent risk, and no indicator can eliminate the uncertainty of the markets. Past performance is not indicative of future results. It is essential to use proper risk management, test any new tool thoroughly, and consult multiple sources or professional advice before making trading decisions.
Conclusion
Uptrick: Alpha Trend unifies a diverse set of calculations, adaptive smoothing techniques, and customizable visual elements into one powerful tool. By combining the Hull, Exponential, and Weighted Moving Averages, the indicator is able to provide a trend line that is both responsive and smooth, depending on the trading mode. Its advanced color schemes, gradient fills, and detailed data tables deliver a comprehensive analysis of market trends, momentum, and risk. Whether you are a short-term trader or a long-term investor, this indicator aims to clarify price action and assist you in making more informed trading decisions.

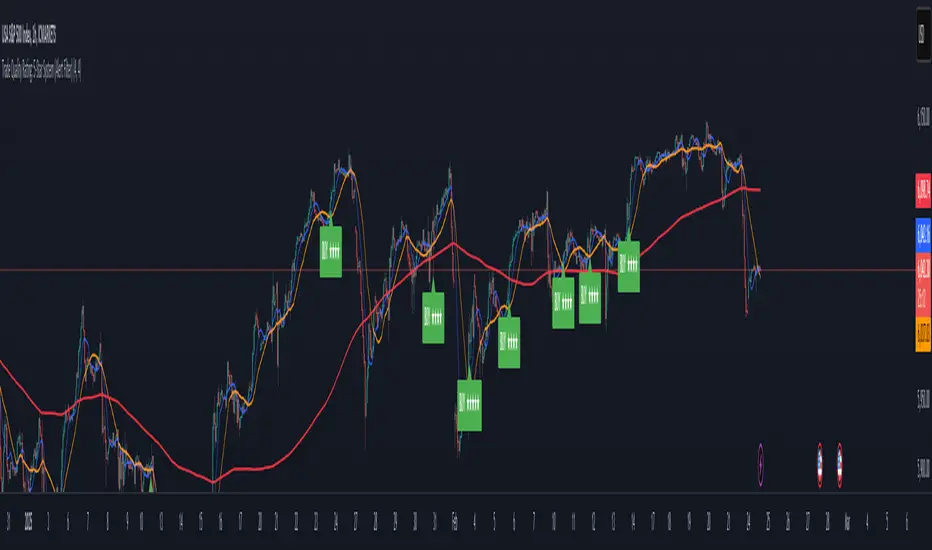
Trade Quality Rating: signal rating from 1 to 5 starsOverview
The indicator is built to generate trading signals based on a combination of technical indicators and then assign each signal a quality rating from 1 to 5 stars. The idea is that the more filters that are met, the stronger (or higher quality) the signal is assumed to be. You can then use these quality ratings to decide which signals to act upon, keeping in mind that a higher-rated signal has more confirming factors.
Components of the Indicator
Simple Moving Averages (SMAs):
SMA9 and SMA20:
These two moving averages are used to detect short-term trend changes via crossovers. A bullish signal is generated when the SMA9 crosses above the SMA20, and a bearish signal when it crosses below.
SMA200 (on the current timeframe) & Daily SMA200:
The SMA200 on your current chart helps smooth out the price action.
The Daily SMA200 serves as a long-term trend filter. For a valid long signal, the price must be above the Daily SMA200, and vice versa for a short signal.
MACD (Moving Average Convergence Divergence):
The MACD is calculated using standard parameters (12, 26, 9).
It adds momentum confirmation to the signal. For a long trade, the MACD line should be above its signal line, and for a short trade, below.
RSI (Relative Strength Index):
Calculated with a 14-period setting.
For long signals, the RSI must be above 50 (indicating upward momentum), while for short signals, it should be below 50.
This filter is one of the additional conditions that add to the quality rating.
Volume Filter:
A 20-period moving average of volume is computed.
The current volume must exceed this average, suggesting that there is enough market participation backing the move.
This is another extra filter that adds to the overall quality score.
ADX (Average Directional Index):
The ADX is manually calculated in the script (using a 14-period setting) to gauge the strength of the trend.
A value above 25 is considered to confirm that a strong trend is in place, making the signal more reliable.
VWAP (Volume Weighted Average Price):
The session VWAP is computed on a daily basis.
For long trades, the price should be above the VWAP, and for short trades, below.
This serves as a confirmation that the current price is moving in the right direction relative to the volume-weighted average.
Signal Generation and Quality Rating
Base Signal (1 Star):
The fundamental trade signal is generated when the SMA9/SMA20 crossover occurs, in combination with the MACD confirmation and the condition that the price is on the correct side of the Daily SMA200. This base signal provides a 1-star quality rating.
Additional Filters (Adding Extra Stars):
RSI Filter: Adds 1 extra star if the RSI condition is met (RSI > 50 for long or RSI < 50 for short).
Volume Filter: Adds 1 extra star if the current volume exceeds its 20-period moving average.
ADX Filter: Adds 1 extra star if the ADX value is above 25, confirming a strong trend.
VWAP Filter: Adds 1 extra star if the price is above the VWAP for long trades (or below for short trades).
When all filters are met, you get a 5-star rating (1 star base + 4 extra stars).
Display and Alerts:
The indicator plots your SMAs on the chart.
When a signal occurs, it places a label on the chart showing the trade direction ("BUY" or "SELL") along with the quality rating in stars.
Additionally, alert conditions are set up so that you can receive notifications when a valid signal (based on the base criteria) is generated.
How to Use This Indicator
Filtering Trades:
Use the quality rating as a visual guide. For instance, if you want to only act on the most reliable setups, you might decide to trade only signals that are rated 4 or 5 stars.
Manual Confirmation:
Even with a high star rating, you can perform your own final checks (e.g., checking price action or additional chart patterns) before entering a trade.
Backtesting and Adjustment:
Because market conditions differ, it’s advisable to backtest the indicator on your instrument of choice and adjust the parameters (such as the ADX threshold or the period for volume averaging) to better suit your trading style.
Conclusion
This 5-star system indicator is designed to provide a comprehensive overview of trade quality by integrating multiple technical filters into one visual signal. It helps filter out noise by ensuring that a trade signal not only meets a basic SMA and MACD condition but also aligns with volume, trend strength (ADX), and VWAP criteria. This multi-layered approach can lead to fewer but higher quality trades, allowing you to focus on setups that have more confluence.
Happy trading!
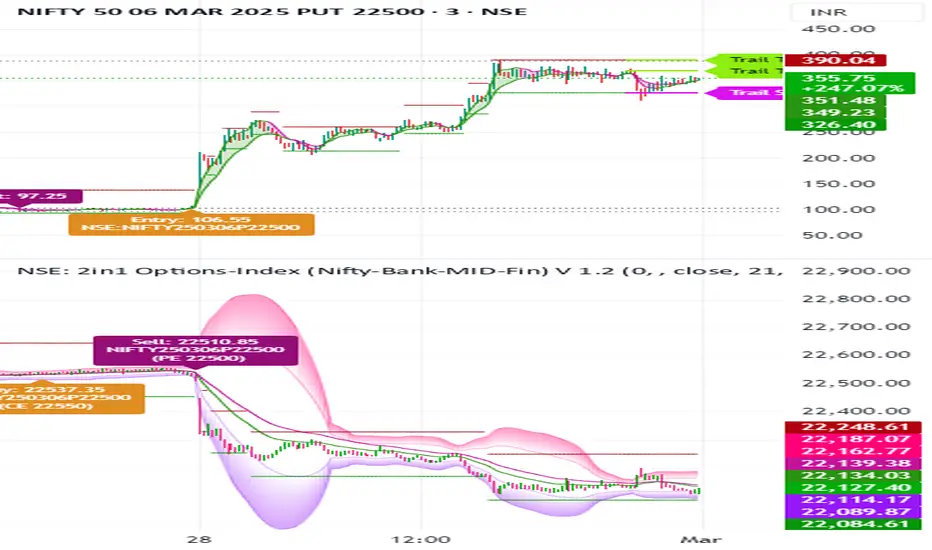
NSE: 2in1 Options-Index (Nifty-Bank-MID-Fin)
1. Using Two Charts in One Indicator with Buy and Sell Signals on Both Charts
Dual-Chart Functionality: This indicator allows you to monitor two charts simultaneously – the main chart (Options) and the underlying index chart (NIFTY, BANKNIFTY, etc.).
The index chart (below the main chart) shows the underlying index movement.
The main chart displays the Options data (e.g., NIFTY options, BANKNIFTY options).
Buy/Sell Signals on Both Charts:
Buy and sell signals are generated on both the options chart and the index chart, ensuring you don’t miss any trading opportunities.
This dual-chart setup helps you correlate the movement of the index with the options data for better decision-making.
2. Works Across Major Indices (NIFTY, BANKNIFTY, FINNIFTY, etc.)
Automatic Index Detection: The script automatically detects the underlying index based on the chart symbol. It supports:
NIFTY, BANKNIFTY, FINNIFTY, MIDCPNIFTY, SENSEX
Flexibility: Whether you’re trading NIFTY options or BANKNIFTY options, the indicator adapts to the selected index and provides accurate signals.
3. Helps You Select ATM, ITM, and OTM Strikes (Ideal for Beginners and Advanced Traders)
ATM (At-The-Money) Strike Calculation:
The script calculates the ATM strike price based on the current spot price of the underlying index.
ITM (In-The-Money) and OTM (Out-Of-The-Money) Strikes:
Users can adjust the strike price using a slider to select ITM or OTM strikes.
This feature is especially helpful for beginners who are learning about options trading and want to understand the difference between ITM, ATM, and OTM strikes.
Strike Price Display:
The selected strike price is displayed on the chart, making it easy to identify the right strike for your trades.
4. Double EMA Selection for Trading
Customizable EMAs:
The script uses two Exponential Moving Averages (EMAs) to generate signals:
Short EMA (Default: 21 periods)
Long EMA (Default: 34 periods)
Users can customize the EMA lengths based on their trading strategy.
5. Option Chart in the Main Chart with Index Chart Below for Easy Monitoring
Integrated Chart Setup:
The main chart displays the options data (e.g., NIFTY options, BANKNIFTY options).
The index chart (below the main chart) shows the underlying index movement.
Benefits:
This setup allows you to monitor both the options and the index in a single view, making it easier to:
Correlate the movement of the index with the options data.
Identify trading opportunities directly on the chart.
No need to switch between multiple charts – everything is in one place.
6. Targets and Stop-Loss When the Signal is Generated
Dynamic Targets and Stop-Loss:
The script calculates targets and stop-loss levels based on the Predicted Range (PR) bands.
Trailing Stop-Loss:
The stop-loss level adjusts dynamically as the price moves in your favor.
Target Levels:
Two target levels are provided (Target 1 and Target 2) based on the PR bands.
Visual Indicators:
Targets and stop-loss levels are plotted on the chart with labels and lines for easy reference.
Colors:
Trailing Stop: Light Pink
Target 1: Light Green
Target 2: Light Green
7. Various Other Options in One Indicator
Advanced Statistical Bands (KRO Settings):
The script includes Kernel Regression Oscillator (KRO) settings for advanced traders.
Plots upper and lower bands based on standard deviation and kernel regression.
Helps identify overbought and oversold conditions.
Customizable Alerts:
Users can enable/disable alerts for:
Buy/Sell signals.
Trailing stop-loss hits.
Target achievements.
Summary of Benefits
All-in-One Tool: Combines candlestick analysis, EMAs, options strike selection, targets, stop-loss, and advanced statistical bands in a single indicator.
Beginner-Friendly: Helps new traders understand ATM, ITM, and OTM strikes while providing clear buy/sell signals.
Advanced Features: Includes KRO settings, dynamic targets, and trailing stop-loss for experienced traders.
Dual-Chart Setup: Monitor options and the underlying index simultaneously for better decision-making.
Customizable: Adjust EMA lengths, strike prices, colors, and alerts to suit your trading style.
Multi-Timeframe VWMA chartThis "Multi-Timeframe VWMA Indicator" is a powerful tool for traders seeking to analyze price action across multiple timeframes using the Volume Weighted Moving Average (VWMA). Built in Pine Script v6, it overlays a customizable VWMA on your chart while displaying a table that tracks how your chosen price source (e.g., close, open, high, low) interacts with the VWMA across eight timeframes: 1m, 3m, 5m, 15m, 1h, 4h, 1d, and 1w.
Key features include adjustable inputs: select your price source, set the VWMA length (default 20), pick the line color (default blue), adjust line width (default 2), and apply an offset (default 0, range -500 to 500) to shift the VWMA for precise alignment. The VWMA is plotted on the current chart timeframe, scaling naturally with price due to the overlay setting.
The table, positioned top-right, shows each timeframe’s status: an upward arrow (↑, green) if the source is above the VWMA, indicating bullish momentum, or a downward arrow (↓, red) if below, suggesting bearish pressure. Using request.security, it fetches data efficiently, making it ideal for multi-timeframe analysis. Perfect for traders wanting a clear, customizable view of VWMA-based trends.

Multi-Timeframe 200 EMAMulti-Timeframe 200 EMA Indicator
Description:
This indicator plots the 200-period Exponential Moving Average (EMA) from multiple timeframes on a single chart. It allows traders to visualize key trend levels across different timeframes, helping with confluence, trend identification, and potential trade setups.
Key Features:
Multi-Timeframe EMAs: Displays the 200 EMA from the 2m, 5m, 15m, 30m, 1hr, and 4hr timeframes, regardless of the chart's current timeframe.
Dynamic Labeling: Each EMA is labeled with its respective timeframe (e.g., "2m", "1hr", "4hr") and the labels update in real-time, staying on the current EMA value.
Auto-Updating Labels: The labels move with the EMAs as new candles form, ensuring a clean and informative display. Old labels automatically disappear to prevent clutter.
Color-Coded EMAs: Each EMA has a unique color, making it easy to differentiate between timeframes.
How to Use This Indicator in Trading:
Trend Confirmation: If price stays above the higher timeframe 200 EMA (e.g., 1hr, 4hr), it suggests an uptrend; below it suggests a downtrend.
Support & Resistance Zones: The 200 EMA from larger timeframes often acts as strong dynamic support or resistance.
Multi-Timeframe Confluence: If multiple EMAs are aligned in the same direction, it strengthens the trend bias.
Reversal or Breakout Signals: When price crosses above or below a higher timeframe EMA, it could indicate a potential trend change or breakout opportunity.
Best Used For:
🔹 Scalpers & Day Traders: Helps identify intraday trends and key levels across multiple timeframes.
🔹 Swing Traders: Useful for aligning trade setups with higher timeframe trends.
🔹 Trend Followers: Provides confirmation of long-term trends using the 200 EMA.

PRC-ALMA | QuantEdgeBIntroducing PRC-ALMA by QuantEdgeB
Overview
The PRC-ALMA (Percentile Adaptive ALMA) is an advanced dynamic trend and volatility filtering indicator that leverages the Arnaud Legoux Moving Average (ALMA) combined with Percentile Rank Filtering and Median Absolute Deviation (MAD) Bands. It is designed to enhance market structure clarity, detect breakout zones, and provide trade signals by dynamically adjusting its filtering based on recent price action.
____
Key Features
1. 📈 Adaptive ALMA Smoothing:
- Uses ALMA for smoothing price action while reducing lag.
- Provides a more responsive moving average than traditional EMAs and SMAs.
2. 📊 Percentile Rank-Based Thresholds:
- Determines upper and lower regions using 75th and 25th percentile ranks.
- Allows for adaptive thresholding based on historical price movements.
3. 🎯 Median Absolute Deviation (MAD) Volatility Filtering:
- Filters out noise using robust statistical deviation measures.
- MAD Bands dynamically adjust based on volatility expansion and contraction.
4. 🔄 Dynamic Trade Signals:
- Generates long signals when price exceeds the upper threshold.
- Generates short signals when price drops below the lower threshold.
5. 🎨 Customizable Color Modes & Visual Enhancements:
- Choose between multiple color schemes to match trading preferences.
- Optional candlestick coloring to indicate market sentiment shifts.
____
How It Works
1. ALMA Calculation:
- The indicator starts by computing the ALMA (Arnaud Legoux Moving Average) with a customizable length, offset, and sigma.
2. Percentile Rank Filtering:
- It then calculates the 75th and 25th percentile ranks over a selected period, determining dynamic levels for trend identification.
3. Volatility Adjustment Using Median Absolute Deviation (MAD):
- MAD is applied to filter noise and adapt the upper/lower bands based on market volatility.
- The higher the MAD multiplier, the wider the bands, allowing more price fluctuations before a signal triggers.
4. Entry & Exit Conditions:
- Long Entry: When price crosses above the upper percentile band + MAD filter.
- Short Entry: When price crosses below the lower percentile band - MAD filter.
5. Visual Enhancements:
- Dynamic band plotting with shading between percentile ranks.
- Candlestick coloring to visually indicate long/short sentiment shifts.
____
Practical Applications
✅ Trend Following & Momentum Trading – Uses ALMA for trend smoothing and percentile-based breakouts.
✅ Mean Reversion Strategies – Adaptive MAD filtering ensures only significant deviations trigger signals.
✅ Multi-Timeframe Trading – Works on intraday, daily, and weekly timeframes based on user customization.
✅ Noise Reduction – Eliminates minor fluctuations while capturing meaningful market moves.
____
🛠 Settings
-ALMA Length: 24 – Defines the smoothing period for the Arnaud Legoux Moving Average.
-ALMA Offset: 0.7 – Adjusts the shift factor, controlling responsiveness.
-ALMA Sigma: 4 – Determines the smoothing strength, balancing trend-following and noise reduction.
-Percentile Length: 21 – Lookback period for calculating percentile rank levels.
-Median Period: 21 – The period used for the Median Absolute Deviation (MAD) filter.
-Median Multiplier: 1.8 – Adjusts the sensitivity of the MAD filter, impacting how signals are generated.
-Color Mode: Strategy – Various visual themes available for better chart readability.
-Signal Label: Off - If turned off the indicator produced a Long or Cash signal when the trend changes.
📌 Conclusion
The PRC-ALMA | QuantEdgeB is an advanced valuation and signal generation tool that dynamically adjusts based on market conditions. By combining ALMA for trend smoothing, percentile rank thresholds, and MAD-based volatility filtering, it provides traders with a versatile indicator for momentum, breakout, and mean reversion strategies.
Key Takeaways:
✔ Smooth & Adaptive – ALMA ensures minimal lag while maintaining trend responsiveness.
✔ Dynamic Overbought/Oversold Zones – Adjusts to real-time market conditions using percentile-based bands.
✔ Volatility-Aware Filtering – Uses MAD to eliminate market noise, making signals more reliable.
✔ Customizable & Multi-Timeframe Ready – Works on various asset classes and timeframes with adjustable settings.
🔹 Disclaimer: Past performance is not indicative of future results. No trading strategy can guarantee success in financial markets.
🔹 Strategic Advice: Always backtest, optimize, and align parameters with your trading objectives and risk tolerance before live trading.
