Multi-Timeframe 200 EMAMulti-Timeframe 200 EMA Indicator
Description:
This indicator plots the 200-period Exponential Moving Average (EMA) from multiple timeframes on a single chart. It allows traders to visualize key trend levels across different timeframes, helping with confluence, trend identification, and potential trade setups.
Key Features:
Multi-Timeframe EMAs: Displays the 200 EMA from the 2m, 5m, 15m, 30m, 1hr, and 4hr timeframes, regardless of the chart's current timeframe.
Dynamic Labeling: Each EMA is labeled with its respective timeframe (e.g., "2m", "1hr", "4hr") and the labels update in real-time, staying on the current EMA value.
Auto-Updating Labels: The labels move with the EMAs as new candles form, ensuring a clean and informative display. Old labels automatically disappear to prevent clutter.
Color-Coded EMAs: Each EMA has a unique color, making it easy to differentiate between timeframes.
How to Use This Indicator in Trading:
Trend Confirmation: If price stays above the higher timeframe 200 EMA (e.g., 1hr, 4hr), it suggests an uptrend; below it suggests a downtrend.
Support & Resistance Zones: The 200 EMA from larger timeframes often acts as strong dynamic support or resistance.
Multi-Timeframe Confluence: If multiple EMAs are aligned in the same direction, it strengthens the trend bias.
Reversal or Breakout Signals: When price crosses above or below a higher timeframe EMA, it could indicate a potential trend change or breakout opportunity.
Best Used For:
🔹 Scalpers & Day Traders: Helps identify intraday trends and key levels across multiple timeframes.
🔹 Swing Traders: Useful for aligning trade setups with higher timeframe trends.
🔹 Trend Followers: Provides confirmation of long-term trends using the 200 EMA.
Moving Averages

PRC-ALMA | QuantEdgeBIntroducing PRC-ALMA by QuantEdgeB
Overview
The PRC-ALMA (Percentile Adaptive ALMA) is an advanced dynamic trend and volatility filtering indicator that leverages the Arnaud Legoux Moving Average (ALMA) combined with Percentile Rank Filtering and Median Absolute Deviation (MAD) Bands. It is designed to enhance market structure clarity, detect breakout zones, and provide trade signals by dynamically adjusting its filtering based on recent price action.
____
Key Features
1. 📈 Adaptive ALMA Smoothing:
- Uses ALMA for smoothing price action while reducing lag.
- Provides a more responsive moving average than traditional EMAs and SMAs.
2. 📊 Percentile Rank-Based Thresholds:
- Determines upper and lower regions using 75th and 25th percentile ranks.
- Allows for adaptive thresholding based on historical price movements.
3. 🎯 Median Absolute Deviation (MAD) Volatility Filtering:
- Filters out noise using robust statistical deviation measures.
- MAD Bands dynamically adjust based on volatility expansion and contraction.
4. 🔄 Dynamic Trade Signals:
- Generates long signals when price exceeds the upper threshold.
- Generates short signals when price drops below the lower threshold.
5. 🎨 Customizable Color Modes & Visual Enhancements:
- Choose between multiple color schemes to match trading preferences.
- Optional candlestick coloring to indicate market sentiment shifts.
____
How It Works
1. ALMA Calculation:
- The indicator starts by computing the ALMA (Arnaud Legoux Moving Average) with a customizable length, offset, and sigma.
2. Percentile Rank Filtering:
- It then calculates the 75th and 25th percentile ranks over a selected period, determining dynamic levels for trend identification.
3. Volatility Adjustment Using Median Absolute Deviation (MAD):
- MAD is applied to filter noise and adapt the upper/lower bands based on market volatility.
- The higher the MAD multiplier, the wider the bands, allowing more price fluctuations before a signal triggers.
4. Entry & Exit Conditions:
- Long Entry: When price crosses above the upper percentile band + MAD filter.
- Short Entry: When price crosses below the lower percentile band - MAD filter.
5. Visual Enhancements:
- Dynamic band plotting with shading between percentile ranks.
- Candlestick coloring to visually indicate long/short sentiment shifts.
____
Practical Applications
✅ Trend Following & Momentum Trading – Uses ALMA for trend smoothing and percentile-based breakouts.
✅ Mean Reversion Strategies – Adaptive MAD filtering ensures only significant deviations trigger signals.
✅ Multi-Timeframe Trading – Works on intraday, daily, and weekly timeframes based on user customization.
✅ Noise Reduction – Eliminates minor fluctuations while capturing meaningful market moves.
____
🛠 Settings
-ALMA Length: 24 – Defines the smoothing period for the Arnaud Legoux Moving Average.
-ALMA Offset: 0.7 – Adjusts the shift factor, controlling responsiveness.
-ALMA Sigma: 4 – Determines the smoothing strength, balancing trend-following and noise reduction.
-Percentile Length: 21 – Lookback period for calculating percentile rank levels.
-Median Period: 21 – The period used for the Median Absolute Deviation (MAD) filter.
-Median Multiplier: 1.8 – Adjusts the sensitivity of the MAD filter, impacting how signals are generated.
-Color Mode: Strategy – Various visual themes available for better chart readability.
-Signal Label: Off - If turned off the indicator produced a Long or Cash signal when the trend changes.
📌 Conclusion
The PRC-ALMA | QuantEdgeB is an advanced valuation and signal generation tool that dynamically adjusts based on market conditions. By combining ALMA for trend smoothing, percentile rank thresholds, and MAD-based volatility filtering, it provides traders with a versatile indicator for momentum, breakout, and mean reversion strategies.
Key Takeaways:
✔ Smooth & Adaptive – ALMA ensures minimal lag while maintaining trend responsiveness.
✔ Dynamic Overbought/Oversold Zones – Adjusts to real-time market conditions using percentile-based bands.
✔ Volatility-Aware Filtering – Uses MAD to eliminate market noise, making signals more reliable.
✔ Customizable & Multi-Timeframe Ready – Works on various asset classes and timeframes with adjustable settings.
🔹 Disclaimer: Past performance is not indicative of future results. No trading strategy can guarantee success in financial markets.
🔹 Strategic Advice: Always backtest, optimize, and align parameters with your trading objectives and risk tolerance before live trading.

Squeeze Momentum Indicator with Entry Tactics### **Squeeze Momentum Indicator with Stacked EMAs**
#### **Description:**
This indicator is an enhanced version of the **Squeeze Momentum Indicator** (originally by John Carter and later modified by LazyBear). It identifies **periods of consolidation (squeeze)** and signals potential **explosive price moves** when momentum shifts. The added **stacked EMA concept** further refines entry signals by confirming trend strength. This is also an update to version 6 of PineScript
#### **How to Use:**
The indicator provides **three different entry tactics**, allowing traders to choose signals based on their strategy:
1. **Inside Day Pattern** – Detects inside candles, which indicate potential breakouts when volatility contracts.
2. **Consecutive Black Crosses (Squeeze Signal)** – A certain number of black crosses (low volatility periods) suggests a strong move is coming.
3. **Stacked EMA Concept** – When the **8 EMA > 21 EMA > 34 EMA**, combined with a momentum shift from negative to positive, it signals a **high-probability bullish entry**.
#### **Visual Cues:**
- **Histogram Bars**: Show momentum (green for increasing bullish, red for increasing bearish).
- **Black & Gray Dots**: Represent different squeeze states (low volatility vs. breakout conditions).
- **🔥 Bullish Label**: Appears when the stacked EMAs align and momentum shifts from negative to positive.
#### **Best Practices:**
- Look for **momentum shifts during a squeeze** for high-probability trades.
- Use **stacked EMAs as trend confirmation** before entering.
- Combine with **price action and volume analysis** for additional confluence.
This indicator helps traders **anticipate major price moves** rather than react, making it a powerful tool for trend-following and breakout strategies. 🚀

Liquidity Sweep Filter [AlgoAlpha]Unlock a deeper understanding of market liquidity with the Liquidity Sweep Filter by AlgoAlpha. This indicator identifies liquidity sweeps, highlighting key price levels where large liquidations have occurred. By visualizing major and minor liquidation events, traders can better anticipate potential reversals and market structure shifts, making this an essential tool for those trading in volatile conditions.
Key Features :
🔍 Liquidity Sweep Detection – Identifies and highlights areas where liquidity has been swept, distinguishing between major and minor liquidation events.
📊 Volume Profile Integration – Displays a volume profile overlay, helping traders spot high-activity price zones where the market is likely to react.
📈 Trend-Based Filtering – Utilizes an adaptive trend detection algorithm to refine liquidity sweeps based on market direction, reducing noise.
🎨 Customizable Visualization – Modify colors, thresholds, and display settings to tailor the indicator to your trading style.
🔔 Alerts for Liquidity Sweeps & Trend Changes – Stay ahead of the market by receiving alerts when significant liquidity events or trend shifts occur.
How to Use:
🛠 Add the Indicator : Add the Liquidity Sweep Filter to your chart and configure the settings based on your preferred sensitivity. Adjust the major sweep threshold to filter out smaller moves.
📊 Analyze Liquidity Zones and trend direction : Look for liquidation levels where large buy or sell stops have been triggered. Major sweeps indicate strong reactions, while minor sweeps show gradual liquidity absorption. You can also see which levels are high in liquidity by the transparency of the levels.
🔔 Set-Up Alerts : Use the in-built alerts so you don't miss a trading opportunity
How It Works :
The Liquidity Sweep Filter detects liquidity events by tracking swing highs and lows (defined as a pivot where neighboring candles are lower/higher than it) where traders are likely to have placed stop-loss orders. It evaluates volume and price action, marking areas where liquidity has been absorbed by the market. Additionally, the integrated trend filter ensures that only relevant liquidity sweeps are highlighted based on market direction, lows in an uptrend and highs in a downtrend. The trend filter works by calculating a basis, and defining trend shifts when the closing price crosses over the upper or lower bands.The included volume profile further enhances analysis by displaying key trading zones where price may react.

DEMO QV | QuantEdgeBIntroducing DEMO QV by QuantEdgeB
Overview
The DEMO QV indicator is a dynamic momentum and volatility-based model, designed to identify high-probability trend shifts and breakout opportunities. By leveraging a double exponential moving average smoothing with percentile-based trend analysis, and ATR volatility filters, this tool adapts to market conditions efficiently and ensuring robust signal generation.
_____
Key Features
🔹 DEMA (Double Exponential Moving Average)
A faster and more responsive alternative to traditional EMAs, DEMA reduces lag, enhancing the ability to detect rapid market shifts.
🔹 Percentile-Based Trend Identification:
The system calculates 25th, 50th, and 75th percentile levels effectively segmenting price action into different regimes for trend confirmation and signal clarity.
🔹 ATR-Adjusted Volatility Filters:
By incorporating ATR multipliers the system adapts to different market conditions, ensuring that breakout signals are based on meaningful price movements rather than noise.
🔹 Momentum Confirmation (ROC-Based):
A rate-of-change (ROC) momentum filter is applied to validate trend strength, reducing false signals and aligning trades with prevailing market momentum.
_____
How It Works
✅ Long Signals:
- Price closes above the 75th DEMA Percentile level, adjusted with ATR for volatility filtering.
- Momentum is positive, confirming the trend shift.
- Shown by "Long" label
✅ Short Signals:
- Price closes above the 25th DEMA Percentile level, adjusted with ATR for volatility filtering.
- Momentum is negative, ensuring alignment with bearish trends.
- Shown by "Cash" label
This dual-layered signal mechanism makes the strategy smooth yet aggressive on shorts, quickly reacting to potential downturns.
______
Use Cases
📌 Breakout & Trend-Following Strategy: Ideal for spotting breakout conditions based on percentile rank and ATR expansion.
📌 Momentum-Driven Trading: The ROC filter ensures signals align with price momentum, reducing premature entries.
📌 Adaptable Across Markets: Works across assets with different volatility, thanks to its ATR filtering and dual layer for signal confirmation.
📌 Smooth but Aggressive on Shorts:The dual-layered short logic enables reactive entries while maintaining a clean trend-following approach for longs.
_____
Behaviour across Crypto Majors:
BTC
ETH
SOL
Note : Past behaviour is not indicative of future results. Always conduct thorough testing and risk management before making trading decisions.
_____
Customization Options
⚙️ Color Mode Selection: Multiple preset themes for enhanced visualization.
⚙️ Long/Cash Signal Label: Default is turned off.
⚙️ DEMA Length: Adjustable to fine-tune sensitivity. (Default: 14)
⚙️ Percentile Calculation Length: Defines trend zones. (Default: 35)
⚙️ ATR Length & Multipliers: Controls the threshold for breakout confirmation. (Default: 14, 1.3x for longs, 2.5x for shorts)
⚙️ Momentum Length: Fine-tunes responsiveness to trend shifts. (Default: 8)
_____
Conclusion
The DEMO QV indicator is a powerful trend and volatility-based tool, balancing smooth trend-following logic with aggressive short entries for optimized breakout detection. Whether used for momentum trading, breakouts, or adaptive trend filtering, its combination of percentile-based analysis, ATR filtering, and momentum validation ensures a robust and reliable trading experience.
_____
🔹 Disclaimer: Past performance is not indicative of future results. No trading strategy can guarantee success in financial markets.
🔹 Strategic Advice: Always backtest, optimize, and align parameters with your trading objectives and risk tolerance before live trading.

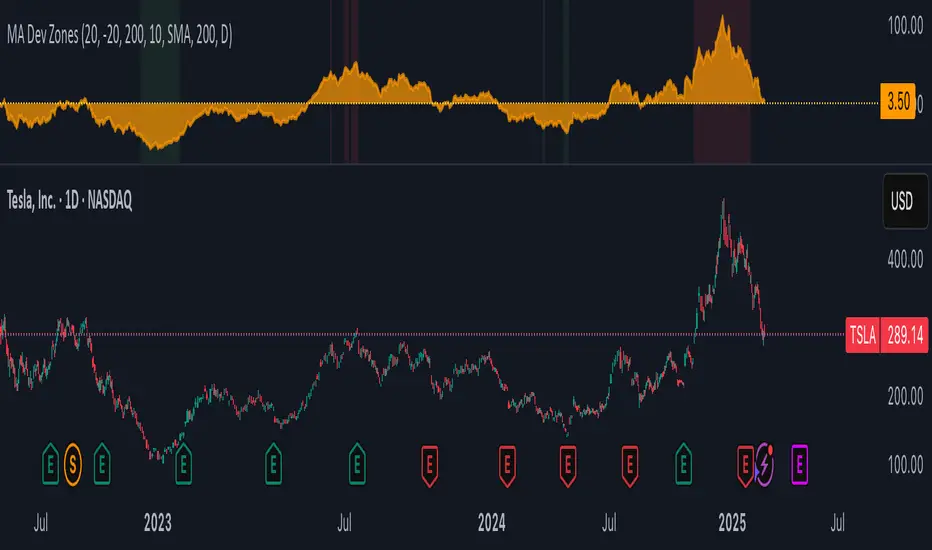
MA Deviation with Volatility ThresholdsPrice Deviation from MA with Dynamic Thresholds - TradingView Script Description
Overview
The Price Deviation from Moving Average (MA) with Dynamic Thresholds indicator is designed to measure and visualize how far the current price deviates from a chosen moving average (SMA or EMA) in percentage terms. It provides traders with valuable insights into whether the asset is significantly overbought or oversold relative to its historical mean.
One of the standout features of this indicator is its ability to dynamically adjust overbought and oversold thresholds based on historical volatility, making it more adaptable across different asset classes and market conditions.
Key Features
✅ Customizable Moving Average
Choose between Simple Moving Average (SMA) or Exponential Moving Average (EMA).
Adjustable MA period (default: 200).
Select the timeframe for the MA calculation (default: Daily).
✅ Percentage-Based Deviation Measurement
Measures how much the price has deviated from the selected moving average in percentage terms.
Helps to identify extreme price movements relative to historical trends.
✅ Static & Dynamic Overbought/Oversold Thresholds
Static Thresholds: Users can set fixed percentage levels for overbought and oversold conditions (default: ±20%).
Dynamic Thresholds (enabled by default): Automatically adjust based on historical volatility.
Uses standard deviation of price changes over a specified period (default: 200 candles).
Thresholds are calculated as volatility × a user-defined multiplier (default: 10).
✅ Visual Enhancements
Background Highlighting:
Red when the price exceeds the overbought threshold.
Green when the price drops below the oversold threshold.
Area Chart Representation: The deviation is plotted as a filled orange area (30% opacity) to enhance visual clarity.
Zero Line in Yellow: Helps in quickly identifying when the price is near the moving average.
How to Use
📌 Trend Confirmation & Mean Reversion Trading:
If the deviation is consistently positive, it indicates an uptrend, while negative values suggest a downtrend.
If the price significantly deviates from the MA and enters the overbought/oversold zone, a potential mean reversion opportunity may arise.
📌 Volatility-Adaptive Thresholds:
When enabled, dynamic thresholds help to adjust for different asset volatilities.
Suitable for traders dealing with assets that exhibit varying levels of price fluctuations.
📌 Combining with Other Indicators:
Works well with RSI, Bollinger Bands, and MACD to confirm trend strength or potential reversals.
Can be used in conjunction with support & resistance levels for added confirmation.
Customization Options
Moving Average Type: SMA or EMA.
Moving Average Period & Timeframe Selection.
Static Overbought/Oversold Levels.
Dynamic Thresholds:
Toggle ON/OFF.
Set the Lookback Period for volatility calculation.
Adjust the Volatility Multiplier for fine-tuning threshold sensitivity.
Why Use This Indicator?
🔹 Adaptive to Different Markets: Works with stocks, forex, crypto, commodities, and indices.
🔹 Useful for Both Trend-Following & Mean Reversion Strategies.
🔹 Volatility-Based Adjustments Ensure Market-Relevant Thresholds.
🔹 Enhances Market Awareness by Identifying Extreme Price Deviations.
Final Thoughts
The Price Deviation from MA with Dynamic Thresholds indicator is a powerful tool for traders who want to gauge price extremes and identify potential turning points in the market. With both static and dynamic threshold options, it can be tailored to different trading styles and asset behaviors.
💡 Tip: Experiment with different MA types, periods, and volatility multipliers to find settings that best suit your preferred trading strategy. 🚀
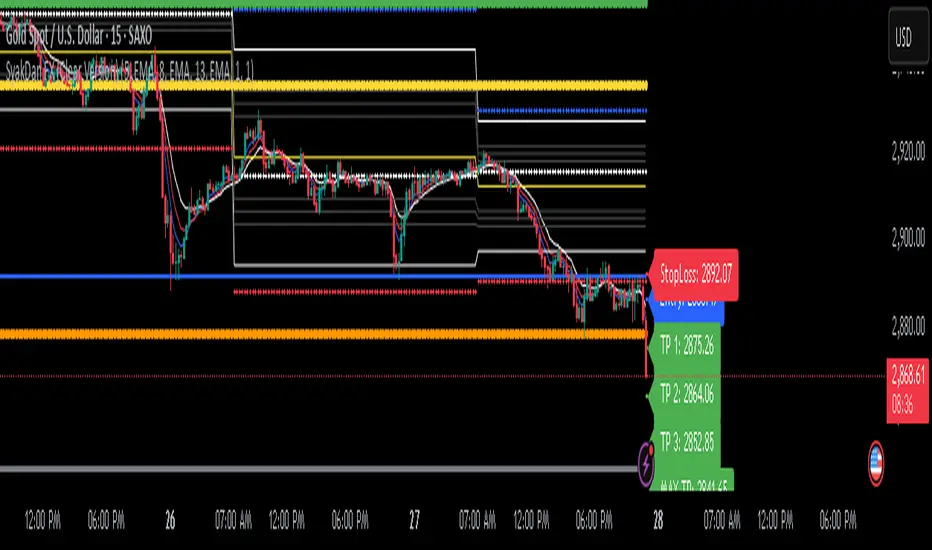
SyakDan FX (Clear Version)**SyakDan FX (Clear Version) - Indicator Description**
### Overview:
SyakDan FX (Clear Version) is a comprehensive TradingView indicator designed for account management, trend identification, and automated trading signals. This script utilizes multiple moving averages, ATR-based stop-loss calculations, and Fibonacci-based pivot points to assist traders in making informed trading decisions.
### Features:
1. **Account Management Calculation:**
- The indicator dynamically adapts to the current timeframe.
- Customizable moving average (MA) types, including EMA, SMA, WMA, and HMA.
- ATR-based trailing stop and volatility assessment.
2. **Moving Averages & Trend Identification:**
- Configurable EMA lengths for three different moving averages.
- Dynamic selection of MA types (SMA, EMA, WMA, HMA) for flexibility.
- Different EMA lengths for low and high timeframes.
- Automatic detection of EMA crossovers and trend changes.
3. **Entry, Stop-Loss, and Take-Profit Calculation:**
- Enables automatic calculation of entry, stop-loss, and take-profit levels.
- ATR-based stop-loss placement.
- Multi-level take-profit targets (TP1, TP2, TP3, and Max TP).
- Visual representation of SL/TP levels using dynamic lines and labels.
4. **Alerts & Notifications:**
- Alerts for EMA crossovers (Buy & Sell signals).
- Additional alerts when EMA 2 crosses EMA 3, indicating strong signals.
5. **Pivot Point Calculations:**
- Calculates daily and weekly pivot points using Fibonacci and traditional methods.
- Helps traders identify key support and resistance levels.
### How It Works:
- The indicator plots three customizable moving averages on the chart.
- It detects crossovers between these moving averages to identify potential buy and sell signals.
- ATR (Average True Range) is used to set dynamic stop-loss and take-profit levels.
- Traders can enable or disable automatic SL/TP plotting.
- Alerts notify users when key trade signals occur.
- Fibonacci and traditional pivot points provide additional confluence for trading decisions.
### Customization Options:
- **MA Type Selection:** Choose from SMA, EMA, WMA, or HMA for each moving average.
- **EMA Length Adjustments:** Modify the lengths for short-term and long-term trends.
- **SL/TP Settings:** Enable or disable SL/TP plotting and customize their multipliers.
- **Alert Preferences:** Enable or disable alerts for trend crossovers.
### Ideal Usage:
- Traders using trend-following strategies based on moving averages.
- Those who want automated SL/TP placement for risk management.
- Anyone looking to integrate pivot points into their trading decisions.
This indicator provides a clean, structured approach to trading with automated analysis, reducing the need for manual calculations while offering strong risk management tools.
Chaikin Money Flow with Moving AverageThis indicator combines the Chaikin Money Flow (CMF) with a moving average, helping traders analyze buying/selling pressure and whether it's increasing or decreasing.
What It Does:
Chaikin Money Flow (CMF) developed by Marc Chaikin is a volume-weighted average of accumulation and distribution over a specified period.
A moving average is applied to CMF to reduce noise and smooth trends, making it easier to identify sustained market sentiment shifts.
How to Use It?
CMF helps confirm trend strength and potential reversals. We reduces false signals from CMF by smoothing fluctuations and making it easier to spot trends.
A CMF value above zero is a sign of strength, and a value below zero is a sign of weakness.
A rising price with a falling CMF (below moving average) is a bearish divergence and a possible reversal of the uptrend.
Similarly, a falling price with a rising CMF (above moving average) is a bullish divergence and again signals a possible reversal of the downtrend.
Configurable Parameters:
CMF Length: Adjusts how many periods are used for CMF calculation.
MA Type: Choose between SMA, EMA, WMA, VWMA, or T3 for smoothing.
MA Length: Controls how much smoothing is applied.
This tool is great for traders looking to improve volume-based trend analysis while filtering out short-term noise.

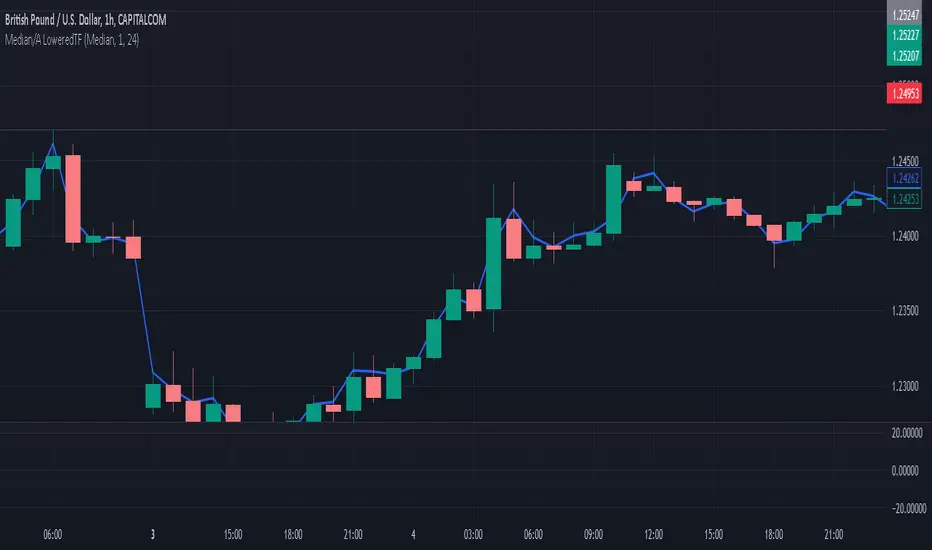
Median / Averages from Lower Time-Frame TicksI've added/created this to give me a more accurate idea of candle movements - I use the MEDIAN average of a candle, which gives me a more accurate "description" of where the candle spent most of it's time 'hovering', over that time frame. The beauty of this is how it REDUCES NOISE, espeicially long wicks, or candles that spike at the moment of a close, skewing a 'normalized' candle's result.
Due to how the Median Calculation works, changing the 'candle timeframe' in options will have no effect - that is available as an option for some of the more traditional MA's, which you can toggle between in the settings... it can also display traditional MA's - SMA, HMA, WMA, and the HLC/3 which I was using up until this point.
This is a 'Line Chart' version of this indicator; I intend to update it with a 'normalized', custom drawn candle based on this method.
The MEDIAN of a candle is a value based on the following;
it lines all values up over a time frame, then takes the value closest to the centre of the array as the 'median'. I'll provide a working example.
imagine we have a candle with 5 values;
it opens at 2, spikes up to 1, spikes down to 10, then spends the entire time hovering at 3 and 4 until it's close. Our array looks like this;
1,2,3,4,100
now, the "average" of these candles is (1+2+3+4+100) / 5 = 22
when the "median" of these candles is the centre value of the array, which is 3.
The candle spent 99% of it's time between 1 and 4 - and spiked for one moment to 100... so now the median gives me a better idea of where the price spent most of it's time, in this instance.
This becomes more skewed, and therefore more accurate, the more values in a candle - and the minute chart on the hourly is a good baseline that gives pretty fair values, without being overly taxing on the machine that needs to make those calculations.
Caveat: I Trade on the Hourly/Daily, so the medians are taken from Minute Candles - thus this will effectively be 'no good' for 1 minute time-frames, (it will simply draw at the Close) but will still have some value down to 15 minute, or even 5 minute charts.
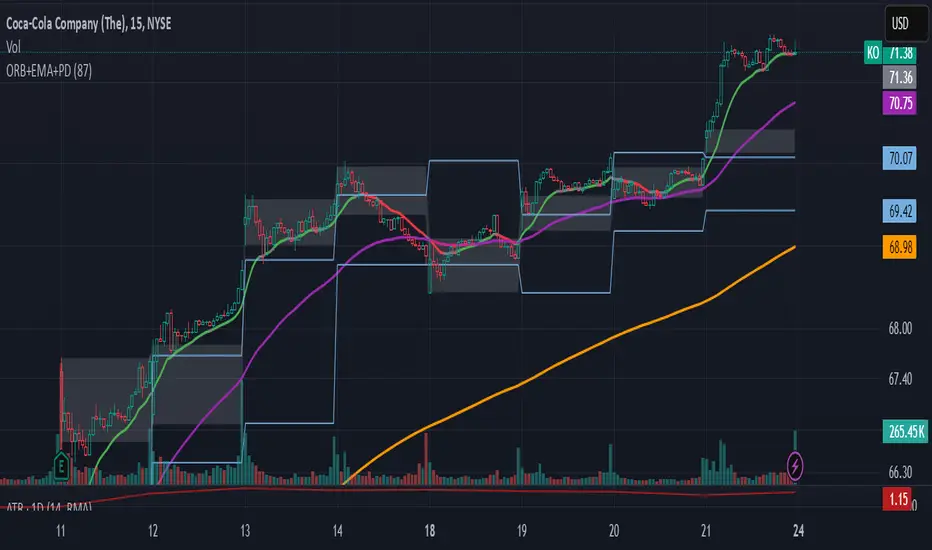
ORB-5Min + Adaptive 12/48 EMA + PDH/PDL
Overview:
This indicator combines the 5-Minute Opening Range Breakout (ORB), Adaptive 12/48 Exponential Moving Averages (EMAs), and Previous Day High/Low (PDH/PDL) levels to help traders identify key intraday levels and market trends.
Key Components and Logic:
5-Minute Opening Range Breakout (ORB):
Displays the high and low from the first 5-minute candle of the trading session.
Includes customizable opacity for the range fill.
Helps traders spot breakout opportunities and key support/resistance zones.
Adaptive 12/48 EMA System:
Displays EMAs for 9, 12, 48, and 200 periods.
The 12 EMA changes color based on whether the price is entirely above or below it.
The 48 EMA changes color depending on its relationship with the 12 EMA.
Provides dynamic trend identification and potential entry/exit signals.
Previous Day High/Low (PDH/PDL):
Displays the previous day’s high and low levels.
Useful for tracking key intraday support/resistance levels and potential reversal points.
Summary:
This script stands out by blending three popular intraday tools into a single comprehensive indicator. The combined visualization provides a layered market context that assists traders in making informed decisions quickly. The color-adaptive EMAs add clarity to trend direction, while the ORB and PDH/PDL levels highlight significant price zones for breakout or reversal trades.
How to Use:
Breakout Trades: Watch for price breaks above the ORB high or below the ORB low, especially when supported by EMA trends.
Trend Confirmation: Use the color-adaptive 12/48 EMA system to gauge momentum and market direction.
Reversal or Continuation: Observe how price reacts around PDH/PDL levels, especially if confluence with EMAs occurs.
This indicator is suitable for day traders seeking a clear and efficient way to track market structure, identify trends, and spot potential trade opportunities during regular market hours.
TTC EMA Scalping Machine with RSI Filter and MACDTTC EMA Scalping Machine with RSI Filter and MACD
TTC EMA Scalping Machine with RSI Filter and MACD is a multi-layered technical analysis tool designed for traders looking to scalp the markets with a combination of trend-following and momentum-based indicators. This strategy leverages Exponential Moving Averages (EMAs) , Relative Strength Index (RSI) , MACD , and Volume Analysis to help traders identify high-probability entry points for short and long trades. The indicator can be used in multiple market conditions and is suited for both beginners and experienced traders looking for clear entry signals.
---
Key Features :
1. EMA-Based Trend Filtering :
- The indicator uses four Exponential Moving Averages (EMAs) with different periods:
- EMA 10 (Short-Term) : The fastest-moving average for detecting quick price movements.
- EMA 20 (Medium-Term) : A central trendline for market momentum.
- EMA 30 (Long-Term) : To observe broader market trends.
- EMA 50 (Longest-Term) : To identify the overall market direction.
- These EMAs are plotted on the chart and used to create EMA bands , visually displaying potential support and resistance levels. Price action inside these bands helps identify scalping opportunities.
2. RSI Filter :
- RSI (Relative Strength Index) is used to gauge overbought and oversold conditions in the market:
- Overbought condition (RSI > 70) : The market may be overextended, signaling the possibility of a short.
- Oversold condition (RSI < 30) : The market may be undervalued, signaling the possibility of a long.
- The RSI filter ensures that trades are not taken when the market is overextended, offering a more conservative approach to trade entries.
3. MACD Momentum Analysis :
- The MACD (Moving Average Convergence Divergence) indicator is included to confirm the trend and momentum direction:
- Long Condition : The MACD line crosses above the signal line, confirming a bullish momentum.
- Short Condition : The MACD line crosses below the signal line, confirming a bearish momentum.
- This serves as an additional filter to verify if the market momentum aligns with the long or short entry criteria.
4. Long Entry (Buy Signal) :
- A long entry signal is triggered when the following conditions are met:
- The price is above EMA 20 (indicating an overall bullish market).
- The price is within the green EMA band (EMA 10 and EMA 20), suggesting short-term support.
- The RSI is below 70 (indicating the market is not overbought).
- The MACD line is above the signal line , showing bullish momentum.
- These conditions combined suggest an ideal environment for entering a long position.
5. Short Entry (Sell Signal) :
- A short entry signal is triggered when the following conditions are met:
- The price is below EMA 20 (indicating an overall bearish market).
- The price is within the green EMA band (EMA 20 and EMA 30), suggesting short-term resistance.
- The RSI is above 30 (indicating the market is not oversold).
- The MACD line is below the signal line , showing bearish momentum.
- These conditions combined suggest an ideal environment for entering a short position.
6. Signal Alerts :
- Long Alerts : Users can set alerts to notify them when a long condition is met. These alerts are triggered when all the criteria for a long entry are satisfied.
- Short Alerts : Similarly, users can set alerts for short signals, notifying them when all the conditions for a short entry are satisfied.
7. EMA Bands :
- The EMA bands are visually represented with colored fills between the EMAs, providing a visual aid to recognize potential trading zones. These zones can serve as a reference for traders to make quick decisions regarding entries and exits.
8. Volume Filter :
- The indicator also includes a volume filter , which compares the current volume to its 20-period simple moving average. Higher volumes provide confirmation of price movement, which can indicate stronger potential for the trade.
---
How It Works :
- Long Trades : The indicator suggests a long position when the price is above the EMA 20, within the green EMA band, the RSI is not overbought, and MACD confirms bullish momentum (MACD line above the signal line).
- Short Trades : The indicator suggests a short position when the price is below the EMA 20, within the green EMA band, the RSI is not oversold, and MACD confirms bearish momentum (MACD line below the signal line).
- Volume Confirmation : The indicator uses a volume-based filter to ensure the trade is backed by sufficient market participation.
---
Usage :
- Best for Scalping : This strategy is designed for short-term trades ( scalping ) and can be applied to any time frame, though it works best on intraday charts, such as 5-minute or 15-minute charts.
- Ideal for Trend-Following : With the use of EMAs and MACD, the strategy is best suited for markets that exhibit clear trends. It helps to avoid whipsaw trades and focuses on capturing medium-term trends.
- Risk Management : By using RSI, MACD, and volume analysis together, this strategy reduces the likelihood of entering a trade in an overextended market, which helps with risk management.
---
Alerts and Signals :
- Long Signals : When all conditions are met for a long trade, a green label appears below the price bar, indicating a potential buy opportunity. An alert is also generated, notifying the user.
- Short Signals : When all conditions are met for a short trade, a red label appears above the price bar, indicating a potential sell opportunity. An alert is also generated, notifying the user.
---
This combination of EMA , RSI , MACD , and volume-based filters creates a balanced approach to scalping, ensuring that traders receive clear, actionable entry signals with trend confirmation, while avoiding overbought and oversold conditions that may lead to false signals. The indicator is designed to help traders confidently identify high-probability trades while maintaining simplicity and clarity in its setup.

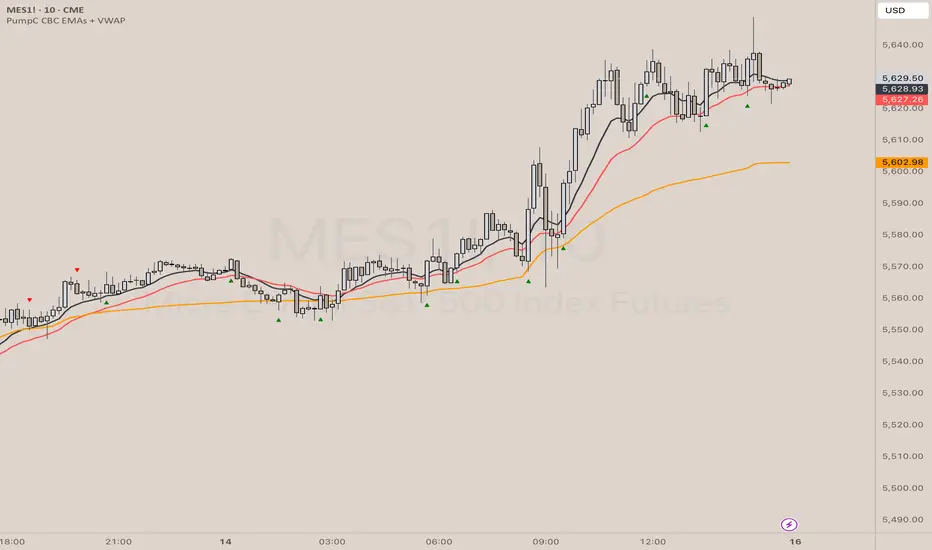
PumpC CBC EMAs + VWAPPumpC CBC EMAs + VWAP Indicator for Tradingview
Introduction
This is an indicator for the Candle By Candle (CBC) Flip strategy , based on the CBC Flip concept taught by MapleStax and inspired by the original CBC Flip indicator by AsiaRoo . The CBC Flip strategy is a simple yet effective approach to gauge if bulls or bears are in control for any given candle.
The logic behind the CBC Flip is as follows:
Bullish Flip : If the most recent candle’s close is above the previous candle’s high, bulls have taken control.
Bearish Flip : If the most recent candle’s close is below the previous candle’s low, bears are now in control.
No Flip : If neither condition is met, the previously dominant side (bulls or bears) remains in control until one of these conditions is satisfied, flipping the market sentiment—hence the name CBC Flip .
The PumpC CBC EMAs + VWAP Indicator enhances this simple strategy by adding trend confirmation filters using EMAs and VWAP , along with time-restricted signal generation and fully customizable alerts.
What Does This Indicator Do?
The PumpC CBC EMAs + VWAP Indicator helps traders identify CBC Flips to spot potential trend continuations or reversals. It combines candlestick logic , trend filters , and time-based restrictions to provide high-probability trade signals.
CBC Flip Detection
Bullish Flip : Current close is above the previous candle’s high.
Bearish Flip : Current close is below the previous candle’s low.
Strict Flips : Require a liquidity sweep for higher accuracy.
All Flips : Looser conditions that generate more frequent signals.
EMA and VWAP Trend Confirmation (Optional)
This filter ensures that long signals only trigger when the Slow EMA is above the VWAP , confirming an upward trend. For short signals, the Slow EMA must be below the VWAP.
Time-Based Filtering
The indicator allows you to set a specific trading window (e.g., 9:00 AM to 3:00 PM), helping you avoid low-volume or high-risk periods.
Visual Labels and Alerts
Labels : Arrows (▲ for long and ▼ for short) mark CBC Flip points on the chart.
Alerts : Fully customizable notifications for each signal type, based on your chosen filters.
Key Features
CBC Flip Detection : Identify potential reversals and trend continuations.
Strict vs. All Flips : Choose between higher-accuracy strict flips or more frequent all flips.
EMA-to-VWAP Filter : Optional trend confirmation filter to reduce false signals.
Customizable EMAs and VWAP : Configure lengths and colors for visual clarity.
Time-Restricted Signals : Focus on your preferred trading session.
Custom Alerts : Notifications for long and short signals based on filter settings.
Credits and Inspiration
The CBC Flip strategy was created by MapleStax .
This indicator is inspired by the original CBC Flip indicator by AsiaRoo .
Additional enhancements include EMA-to-VWAP filtering , custom alerts , and time-restricted signal generation for a more comprehensive trading experience.
Risks and Disclaimer
This indicator is for educational purposes only and does not constitute financial advice.
Trading involves significant risk, and past performance does not guarantee future results. Always test this indicator in a simulated environment before live trading.
TASC 2025.03 A New Solution, Removing Moving Average Lag█ OVERVIEW
This script implements a novel technique for removing lag from a moving average, as introduced by John Ehlers in the "A New Solution, Removing Moving Average Lag" article featured in the March 2025 edition of TASC's Traders' Tips .
█ CONCEPTS
In his article, Ehlers explains that the average price in a time series represents a statistical estimate for a block of price values, where the estimate is positioned at the block's center on the time axis. In the case of a simple moving average (SMA), the calculation moves the analyzed block along the time axis and computes an average after each new sample. Because the average's position is at the center of each block, the SMA inherently lags behind price changes by half the data length.
As a solution to removing moving average lag, Ehlers proposes a new projected moving average (PMA) . The PMA smooths price data while maintaining responsiveness by calculating a projection of the average using the data's linear regression slope.
The slope of linear regression on a block of financial time series data can be expressed as the covariance between prices and sample points divided by the variance of the sample points. Ehlers derives the PMA by adding this slope across half the data length to the SMA, creating a first-order prediction that substantially reduces lag:
PMA = SMA + Slope * Length / 2
In addition, the article includes methods for calculating predictions of the PMA and the slope based on second-order and fourth-order differences. The formulas for these predictions are as follows:
PredictPMA = PMA + 0.5 * (Slope - Slope ) * Length
PredictSlope = 1.5 * Slope - 0.5 * Slope
Ehlers suggests that crossings between the predictions and the original values can help traders identify timely buy and sell signals.
█ USAGE
This indicator displays the SMA, PMA, and PMA prediction for a specified series in the main chart pane, and it shows the linear regression slope and prediction in a separate pane. Analyzing the difference between the PMA and SMA can help to identify trends. The differences between PMA or slope and its corresponding prediction can indicate turning points and potential trade opportunities.
The SMA plot uses the chart's foreground color, and the PMA and slope plots are blue by default. The plots of the predictions have a green or red hue to signify direction. Additionally, the indicator fills the space between the SMA and PMA with a green or red color gradient based on their differences:
Users can customize the source series, data length, and plot colors via the inputs in the "Settings/Inputs" tab.
█ NOTES FOR Pine Script® CODERS
The article's code implementation uses a loop to calculate all necessary sums for the slope and SMA calculations. Ported into Pine, the implementation is as follows:
pma(float src, int length) =>
float PMA = 0., float SMA = 0., float Slope = 0.
float Sx = 0.0 , float Sy = 0.0
float Sxx = 0.0 , float Syy = 0.0 , float Sxy = 0.0
for count = 1 to length
float src1 = src
Sx += count
Sy += src
Sxx += count * count
Syy += src1 * src1
Sxy += count * src1
Slope := -(length * Sxy - Sx * Sy) / (length * Sxx - Sx * Sx)
SMA := Sy / length
PMA := SMA + Slope * length / 2
However, loops in Pine can be computationally expensive, and the above loop's runtime scales directly with the specified length. Fortunately, Pine's built-in functions often eliminate the need for loops. This indicator implements the following function, which simplifies the process by using the ta.linreg() and ta.sma() functions to calculate equivalent slope and SMA values efficiently:
pma(float src, int length) =>
float Slope = ta.linreg(src, length, 0) - ta.linreg(src, length, 1)
float SMA = ta.sma(src, length)
float PMA = SMA + Slope * length * 0.5
To learn more about loop elimination in Pine, refer to this section of the User Manual's Profiling and optimization page.
CSR Ultimate (Final)This indicator calculates and displays a "Candle Strength Ratio" (CSR) to help you gauge bullish versus bearish momentum on a given timeframe. Here’s what it does:
*Multiple Calculation Methods:*
*You can choose among three different methods:*
-Classic CSR: Compares the difference between the upper and lower parts of the candle relative to its total range.
-Weighted Body CSR: Gives more weight to the candle’s body relative to its wicks.
-Close-Focused CSR: Focuses on the net movement from open to close relative to the full range.
*Optional Enhancements:*
The indicator allows you to enable additional features to refine it:
-Volume Weighting: Adjusts the CSR based on the ratio of current volume to a moving average of volume, so a candle on higher-than-average volume might carry more weight.
-ATR Normalization: Normalizes the CSR using the Average True Range (ATR) to account for market volatility.
-Multi-Bar Averaging: Averages the CSR over a specified number of bars to smooth out noise.
-RSI Filter: Optionally checks an RSI condition (bullish if RSI > 50 or bearish if RSI < 50) to help filter out signals that might not be supported by overall momentum.
*Visual and Alert Features:*
The indicator plots the CSR line with color coding (green for bullish, red for bearish) and draws horizontal threshold lines. It also adjusts the chart background color when the CSR exceeds defined bullish or bearish levels and provides alerts when these thresholds are crossed.

MTF- Standard Deviation ChannelWhat Is Standard Deviation?
Standard deviation is a statistical measurement that looks at how far individual points in a dataset are dispersed from the mean of that set. If data points are further from the mean, there is a higher deviation within the data set. It is calculated as the square root of the variance.
Key Takeaways:
Standard deviation measures the dispersion of a dataset relative to its mean.
It is calculated as the square root of the variance.
Standard deviation, in finance, is often used as a measure of the relative riskiness of an asset.
A volatile stock has a high standard deviation, while the deviation of a stable blue-chip stock is usually rather low.
Standard deviation is also used by businesses to assess risk, manage business operations, and plan cash flows based on seasonal changes and volatility.
Source: Investopedia
--------------- UPDATE ---------------
The deviation is calculated automatically. (via stdev function).
--
The targeted timeframe is available in the options (recalculation cycle).
--
If the selected security is a contract the number of days before expiration is automatically managed, otherwise it will use the 'default' options.
---------------------------------------

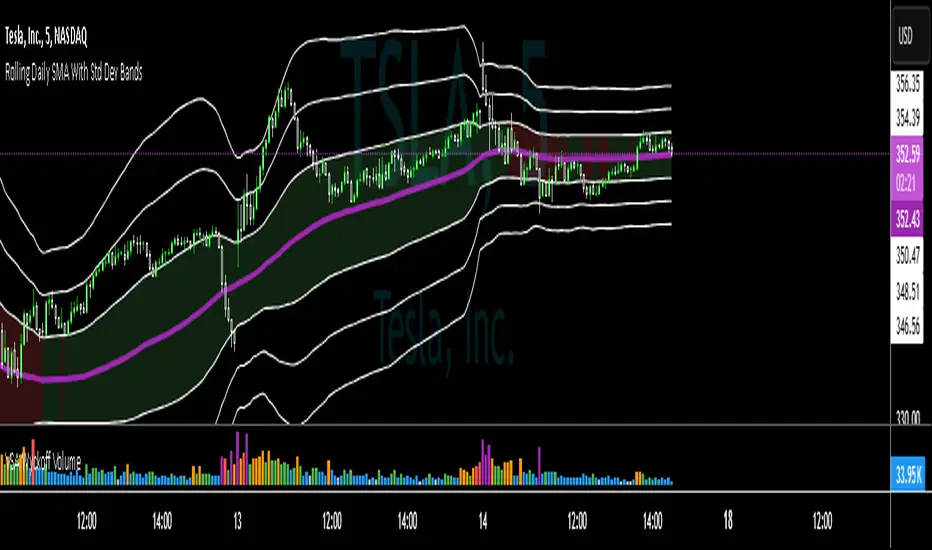
SMA with Std Dev Bands (Futures/US Stocks RTH)Rolling Daily SMA With Std Dev Bands
Upgrade your technical analysis with Rolling Daily SMA With Std Dev Bands, a powerful indicator that dynamically adjusts to your trading instrument. Whether you’re analyzing futures or US stocks during regular trading hours (RTH), this indicator seamlessly applies the correct logic to calculate a rolling daily Simple Moving Average (SMA) with customizable standard deviation bands for precise trend and volatility tracking.
Key Features:
✅ Automatic Instrument Detection– The indicator automatically recognizes whether you're trading futures or US equities and applies the correct daily lookback period based on your chart’s timeframe.
- Futures: Uses full trading day lengths (e.g., 1380 bars for 1‑minute charts).
- US Stocks (RTH): Uses regular session lengths (e.g., 390 bars for 1‑minute charts).
✅ Rolling Daily SMA (3‑pt Purple Line) – A continuously updated daily moving average, giving you an adaptive trend indicator based on market structure.
✅ Three Standard Deviation Bands (1‑pt White Lines) –
- Customizable multipliers allow you to adjust each band’s width.
- Toggle each band on or off to tailor the indicator to your strategy.
- The inner band area is color-filled: light green when the SMA is rising, light red when falling, helping you quickly identify trend direction.
✅ Works on Any Chart Timeframe – Whether you trade on 1-minute, 3-minute, 5-minute, or 15-minute charts, the indicator adjusts dynamically to provide accurate rolling daily calculations.
# How to Use:
📌 Identify Trends & Volatility Zones – The rolling daily SMA acts as a dynamic trend guide, while the standard deviation bands help spot potential overbought/oversold conditions.
📌 Customize for Precision – Adjust band multipliers and toggle each band on/off to match your trading style.
📌 Trade Smarter – The filled inner band offers instant visual feedback on market momentum, while the outer bands highlight potential breakout zones.
🔹 This is the perfect tool for traders looking to combine trend-following with volatility analysis in an easy-to-use, adaptive indicator.
🚀 Add Rolling Daily SMA With Std Dev Bands to your chart today and enhance your market insights!
---
*Disclaimer: This indicator is for informational and educational purposes only and should not be considered financial advice. Always use proper risk management and conduct your own research before trading.*
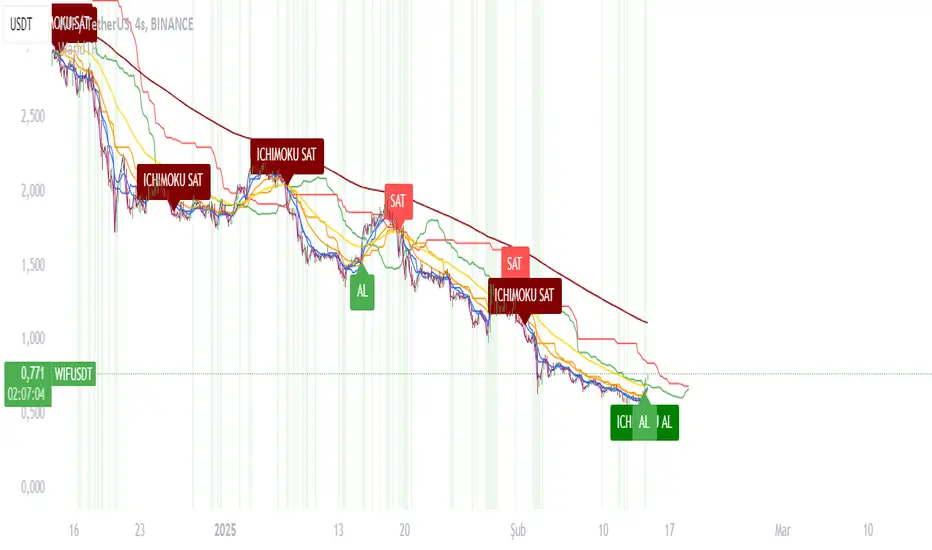
WaridTR15 Dakika ve Üzeri Periyotlar İçin Önerilen Ayarlar:
EMA Uzunlukları:
Kısa EMA: 9 yerine 12 veya 14 kullanılabilir.
Uzun EMA: 21 yerine 26 veya 50 kullanılabilir.
Golden Cross için 50 EMA ve 200 EMA zaten uzun vadeli trendleri yakalar, bu nedenle değiştirmeye gerek yok.
RSI Uzunluğu:
RSI uzunluğu 14 yerine 21 veya 28 yapılabilir. Bu, daha uzun vadeli aşırı alım/aşırı satım bölgelerini daha doğru tespit eder.
Volume Filtresi:
Volume ortalaması için 20 periyot yerine 50 veya 100 periyot kullanılabilir. Bu, daha uzun vadeli hacim eğilimlerini yakalar.
Ichimoku Parametreleri:
Ichimoku, varsayılan olarak 9-26-52 periyotlarıyla çalışır. Bu, zaten uzun vadeli trendleri yakalamak için uygundur. Ancak, daha uzun periyotlar için:
Tenkan-Sen: 9 yerine 14.
Kijun-Sen: 26 yerine 52.
Senkou Span B: 52 yerine 104.
Power of MovingThe Power of Moving indicator is a multi-moving average indicator designed to help traders identify strong trending conditions by analyzing the alignment and separation of multiple moving averages.
This indicator allows users to select between different types of moving averages (SMA, EMA, SMMA, WMA, VWMA) and plots four configurable moving averages on the chart. The background color dynamically changes when the moving averages are correctly stacked in a bullish (green) or bearish (yellow) formation, with sufficient distance between them. This ensures that trends are not only aligned but also have strong momentum. The indicator also includes alert conditions, notifying traders when the trend direction changes, allowing them to stay ahead of market moves.
This indicator works well in trending markets and should be combined with price action analysis or other confirmation indicators like RSI or volume for optimal results.

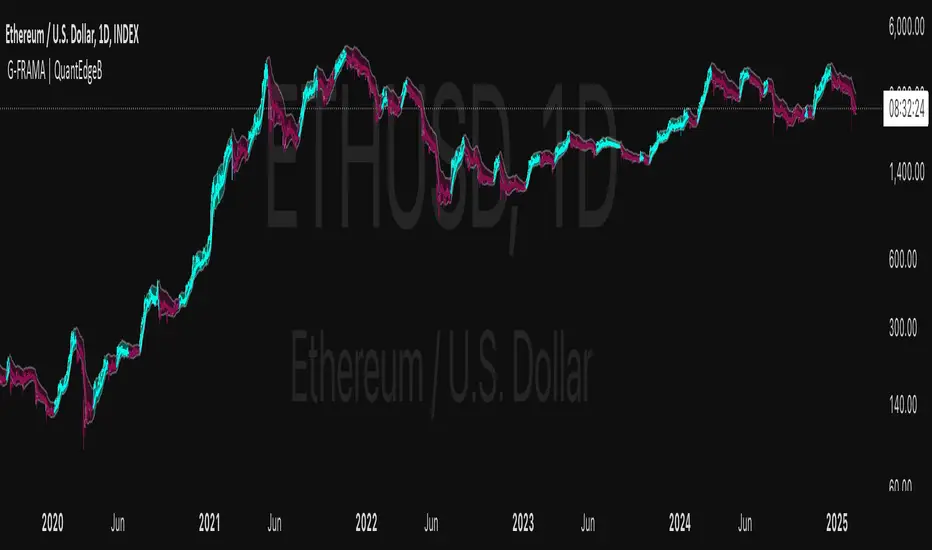
G-FRAMA | QuantEdgeBIntroducing G-FRAMA by QuantEdgeB
Overview
The Gaussian FRAMA (G-FRAMA) is an adaptive trend-following indicator that leverages the power of Fractal Adaptive Moving Averages (FRAMA), enhanced with a Gaussian filter for noise reduction and an ATR-based dynamic band for trade signal confirmation. This combination results in a highly responsive moving average that adapts to market volatility while filtering out insignificant price movements.
_____
1. Key Features
- 📈 Gaussian Smoothing – Utilizes a Gaussian filter to refine price input, reducing short-term noise while maintaining responsiveness.
- 📊 Fractal Adaptive Moving Average (FRAMA) – A self-adjusting moving average that adapts its sensitivity to market trends.
- 📉 ATR-Based Volatility Bands – Dynamic upper and lower bands based on the Average True Range (ATR), improving signal reliability.
- ⚡ Adaptive Trend Signals – Automatically detects shifts in market structure by evaluating price in relation to FRAMA and its ATR bands.
_____
2. How It Works
- Gaussian Filtering
The Gaussian function preprocesses the price data, giving more weight to recent values and smoothing fluctuations. This reduces whipsaws and allows the FRAMA calculation to focus on meaningful trend developments.
- Fractal Adaptive Moving Average (FRAMA)
Unlike traditional moving averages, FRAMA uses fractal dimension calculations to adjust its smoothing factor dynamically. In trending markets, it reacts faster, while in sideways conditions, it reduces sensitivity, filtering out noise.
- ATR-Based Volatility Bands
ATR is applied to determine upper and lower thresholds around FRAMA:
- 🔹 Long Condition: Price closes above FRAMA + ATR*Multiplier
- 🔻 Short Condition: Price closes below FRAMA - ATR
This setup ensures entries are volatility-adjusted, preventing premature exits or false signals in choppy conditions.
_____
3. Use Cases
✔ Adaptive Trend Trading – Automatically adjusts to different market conditions, making it ideal for both short-term and long-term traders.
✔ Noise-Filtered Entries – Gaussian smoothing prevents false breakouts, allowing for cleaner entries.
✔ Breakout & Volatility Strategies – The ATR bands confirm valid price movements, reducing false signals.
✔ Smooth but Aggressive Shorts – While the indicator is smooth in overall trend detection, it reacts aggressively to downside moves, making it well-suited for traders focusing on short opportunities.
_____
4. Customization Options
- Gaussian Filter Settings – Adjust length & sigma to fine-tune the smoothness of the input price. (Default: Gaussian length = 4, Gaussian sigma = 2.0, Gaussian source = close)
- FRAMA Length & Limits – Modify how quickly FRAMA reacts to price changes.(Default: Base FRAMA = 20, Upper FRAMA Limit = 8, Lower FRAMA Limit = 40)
- ATR Multiplier – Control how wide the volatility bands are for long/short entries.(Default: ATR Length = 14, ATR Multiplier = 1.9)
- Color Themes – Multiple visual styles to match different trading environments.
_____
Conclusion
The G-FRAMA is an intelligent trend-following tool that combines the adaptability of FRAMA with the precision of Gaussian filtering and volatility-based confirmation. It is versatile across different timeframes and asset classes, offering traders an edge in trend detection and trade execution.
____
🔹 Disclaimer: Past performance is not indicative of future results. No trading strategy can guarantee success in financial markets.
🔹 Strategic Advice: Always backtest, optimize, and align parameters with your trading objectives and risk tolerance before live trading.
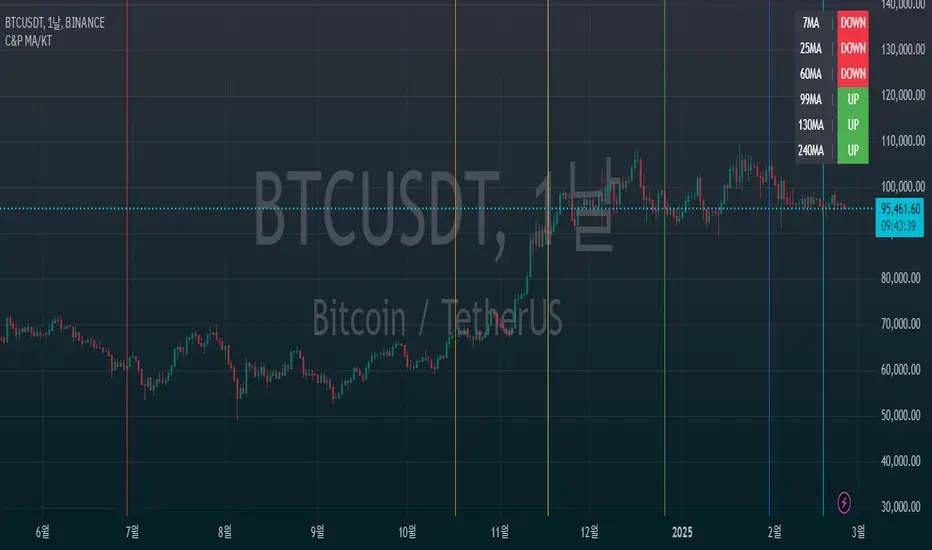
C&P MA/KT Compare & Predict Moving average / Current market price.
This is simple table indicator. Located at right-top of chart. Shows which way will MA's head go.
I made this indicator for automate candle countings & compare price. With this friend, you will be know trend more faster then waiting traditional MA golden / dead crossing.
In factory settings, current market price will be compared with closing price of the candle, corresponding to previous number 7, 25, 60, 99, 130, 240. If Current market price is lower then past, the box for the corresponding MA is highlighted in red and appears as Down. In opposite case, it will be highlighted in green and indicates Up.
MA와 시장가 차이로 MA의 머리 방향을 예측해주는 간단한 지표입니다.
수동으로 캔들 되돌려서 종가와 시장가 비교하는게 너무 번거로워서 자동화를 위해 제작되었습니다. 해당 지표를 이용하시면 MA의 골든/데드 크로스를 기다리는 것보다 더 빠른 예측이 가능합니다.
차트 우측 상단에 예측 값이 표시되며, 기본 설정에선 7, 25, 60, 99, 130, 240개 전 캔들의 종가와 시장가가 비교됩니다. 시장가가 비교 값보다 높을 때는 초록 배경에 Up 텍스트가 출력됩니다. 반대의 경우엔 빨간색 배경에 Down 표기가 나타납니다.
HMA 4H and 15M overlay Notes:
HMA Calculation: We calculate three HMAs for the 15-minute timeframe (ma1, ma2, ma3) based on the settings from your original script, but only ma3 is plotted to keep it consistent with your initial setup.
4-hour HMA: An additional HMA is calculated for the 4-hour timeframe (hma4h) using the hma3 period since it was the longest in your original setup, which might be suitable for a 4-hour chart comparison.
Plotting: Both the 15-minute ma3 and 4-hour hma4h HMAs are plotted with distinct colors for easy visual differentiation.
Timeframe Security: request.security() is used to fetch data from different timeframes. Remember, using request.security() with historical data can sometimes lead to misalignments or delayed data, especially during live trading.
This script will overlay the 15-minute HMA (using the ma3 from your settings) with a new 4-hour HMA on any chart timeframe you apply it to. Remember, if you're looking at a chart timeframe that's not 15 minutes or 4 hours, the HMAs might appear less smooth or aligned due to how Pine Script handles different timeframes.

Range Filtered Trend Signals [AlgoAlpha]Introducing the Range Filtered Trend Signals , a cutting-edge trading indicator designed to detect market trends and ranging conditions with high accuracy. This indicator leverages a combination of Kalman filtering and Supertrend analysis to smooth out price fluctuations while maintaining responsiveness to trend shifts. By incorporating volatility-based range filtering, it ensures traders can differentiate between trending and ranging conditions effectively, reducing false signals and enhancing trade decision-making.
:key: Key Features
:white_check_mark: Kalman Filter Smoothing – Minimizes market noise while preserving trend clarity.
:bar_chart: Supertrend Integration – A dynamic trend-following mechanism for spotting reversals.
:fire: Volatility-Based Range Detection – Detects trending vs. ranging conditions with precision.
:art: Color-Coded Trend Signals – Instantly recognize bullish, bearish, and ranging market states.
:gear: Customizable Inputs – Fine-tune Kalman parameters, Supertrend settings, and color themes to match your strategy.
:bell: Alerts for Trend Shifts – Get real-time notifications when market conditions change!
:tools: How to Use
Add the Indicator – Click the star icon to add it to your TradingView favorites.
Analyze Market Conditions – Observe the color-coded signals and range boundaries to identify trend strength and direction.
Use Alerts for Trade Execution – Set alerts for trend shifts and market conditions to stay ahead without constantly monitoring charts.
:mag: How It Works
The Kalman filter smooths price fluctuations by dynamically adjusting its weighting based on market volatility. It helps remove noise while keeping the signal reactive to trend changes. The Supertrend calculation is then applied to the filtered price data, providing a robust trend-following mechanism. To enhance signal accuracy, a volatility-weighted range filter is incorporated, creating upper and lower boundaries that define trend conditions. When price breaks out of these boundaries, the indicator confirms trend continuation, while signals within the range indicate market consolidation. Traders can leverage this tool to enhance trade timing, filter false breakouts, and identify optimal entry/exit zones.

Adaptive 12/48 EMAThe Adaptive 12/48 EMA is a trend-following indicator that dynamically changes color based on price positioning relative to key exponential moving averages (EMAs).
EMA Calculation:
The script calculates three EMAs—9 EMA (white), 12 EMA (adaptive color), and 48 EMA (adaptive color).
Trend Confirmation:
The 12 EMA turns green when the price (open, close, and low) is fully above it, indicating bullish momentum. The 12 EMA turns red when the price is fully below it, signaling bearish conditions.
Long-Term Trend (48 EMA):
The 48 EMA turns purple when the 12 EMA is above it, confirming an uptrend. The 48 EMA turns pink when the 12 EMA is below it, confirming a downtrend. Both EMAs turn gray when there's no clear trend.
How to Benefit from It:
Trend Trading: Use green/red shifts in the 12 EMA to time entries in the direction of momentum.
Trend Strength Confirmation: The 48 EMA color change helps determine the longer-term trend direction.
Confluence with Other Indicators: Works well with volume indicators or RSI for confirmation before entering trades.
This indicator provides a clear visual representation of trend strength and direction, helping traders make informed decisions based on price structure.
