Price Above EMAPrice has exceeded EMA - this is an exploratory indicator for me - mostly learning the UI and pine scripting, but also starting to practice some paper trades.
Moving Averages

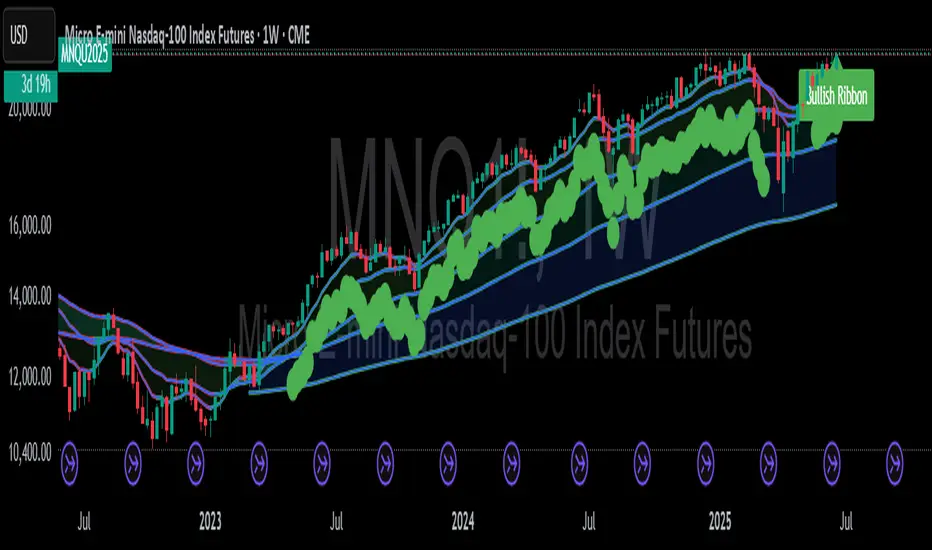
PINO EMA Rhythm Pack📌 PINO EMA Rhythm Pack
This indicator provides a multi-layered visual framework for analyzing the **rhythm and structure** of price movements using a customizable combination of EMAs and SMA. It is designed to simplify the interpretation of momentum shifts, pullbacks, and structural alignment across different time frames.
---
🔹 **Purpose & Use**
Use this tool to interpret short-term market rhythm (EMA 10/20/50), detect transitions through mid-term anchors (EMA 21), and align with long-term directional flow (EMA 200, SMA 200), all within one clean overlay.
---
🔹 **Key Features**
- Default view focuses on short-term rhythm:
• EMA 10 / EMA 20 / EMA 50
- Optional anchors and long-term guides:
• EMA 21 / EMA 200 / SMA 200
- Clean line colors and varied thickness for quick visual parsing
- Fully toggleable components to suit your trading framework
- No alerts, no signals — just visual context
---
🔹 **Note**
This open-source script was built for educational purposes and practical chart use. It brings together widely-used moving average concepts into one flexible overlay, aiming to support **structured discretionary analysis** and improve visual clarity.
This open-source script was built for educational purposes and practical chart use.


5MA mtf bull & bear color5 moving averages customizable for everything with option for bullish and bearish colors


multi_tf_trendHere is a powerful trend indicator that uses data from 3 different time frames to analyze trend direction and direction switches. You can change the timeframes with the drop down menu. The index adds up all the bull signals and subtracts bear signals. The index can help gauge a trend's longevity and strength. For example, Index of +2 is strongly bullish while an Index of -2 is strongly bearish.

DTC FX+DTC FX+ is a clean, theme-optimized session indicator for Forex traders. It features price-anchored session boxes, max/min lines, a live session status table with open/close countdowns, and a fully customizable watermark. Supports both monotone and colorful layouts, and is optimized for both dark and light TradingView themes. All session and timer logic is timezone-accurate and robust for global markets.
Major Features & Customizations:
Session Boxes:
Draws New York, London, and Tokyo session boxes, anchored to price.
In dark mode, boxes are nearly white; in light mode, boxes are light grey for maximum clarity.
Session code (NY, LDN, TKY) is centered inside each box, with text color auto-adjusting for theme (white in dark, black in light).
Session Max/Min Lines:
Dotted, thick, and dark grey for clear visibility on all themes.
Session Status Table:
Shows session status (ONLINE/OFFLINE), time until open, and time until close for each session.
Table and header text are always white in dark mode, black in light mode.
Table background and borders are theme-optimized for maximum readability.
Theme & Layout Support:
Fully optimized for both dark/black and light/white TradingView chart themes.
Toggle between monotone (grey) and colorful layouts.
Colorful layout uses distinct, vibrant colors for each session (blue, orange, magenta).
Watermark:
Customizable watermark with options for position, size, signature, separator, and color.
Default settings: watermark enabled, blue color, large size, signature "❤", separator "~", position bottom-center, show timeframe enabled, show prefix disabled.
Other Improvements:
All text and UI elements are theme-aware for maximum contrast and clarity.
All session and timer logic is timezone-accurate and handles sessions that cross midnight.

MA of TurnoverThis indicator helps in low liquity markets.
Very simple formula: Volume MA * price * %
Last day results is max suggested entry value.

Aqua MTF Trend Oscillator——————————————————————————————————————————————————————————
The Aqua Multi-Timeframe (MTF) Trend Oscillator is a comprehensive momentum and trend analysis tool designed to synthesize
complex market dynamics into a single, intuitive oscillator. It moves beyond single-timeframe analysis by aggregating
trend information from up to five distinct, user-configurable sources—spanning different timeframes, symbols, and
moving average types.
--- CORE CONCEPT ---
The strength and direction of a trend are rarely uniform across all market perspectives. This indicator's core
principle is to quantify and weigh the trend's character from multiple angles simultaneously. By blending these
perspectives, it generates a composite score that reflects the overall "consensus" of trend momentum, providing
a more robust view than any single moving average could offer alone.
--- METHODOLOGY ---
The indicator's power lies in its sophisticated, multi-step normalization process for each analysis slot:
1. **MA Calculation:** A standard moving average (e.g., EMA, SMA) is calculated for the specified source, symbol, and timeframe.
2. **Volatility-Normalized Distance:** It first measures the deviation of price from its moving average in terms
of Average True Range (ATR) units. This volatility-normalization step is crucial for comparing trend strength
across different timeframes or instruments, as it measures distance in a context-aware manner.
3. **Magnitude Squashing:** This ATR-based distance is then passed through a hyperbolic tangent (`tanh`) squashing
function. This elegantly transforms the potentially unbounded measurement into a standardized score oscillating
between -1 (maximum bearish magnitude) and +1 (maximum bullish magnitude). This prevents extreme outliers in one
timeframe from disproportionately skewing the final result.
4. **Weighted Aggregation:** Each of these normalized (-1 to +1) scores is then combined based on a user-defined
weight. The weighted average of all enabled slots produces the final composite score.
5. **Final Scaling & Smoothing:** The composite score is scaled to oscillate between -100 and +100. An optional
final smoothing pass can be applied to this master line to reduce noise and clarify the overall trend.
All higher-timeframe calculations are performed correctly within their native context to ensure the indicator is
non-repainting and provides a stable, reliable output on the chart.
--- KEY FEATURES ---
• **Five Independent Analysis Slots:** Fully customize up to five sources, each with its own symbol, timeframe, MA type, period, and weight.
• **Advanced Normalization:** Utilizes ATR and the hyperbolic tangent function for robust, comparable trend magnitude scores.
• **Correct MTF Calculation:** Employs best practices for non-repainting data requests, ensuring historical and real-time results are consistent.
• **Weighted Composite Score:** Assign importance to different timeframes to tailor the oscillator to your specific analytical needs.
• **Optional Master Smoothing:** Apply a final MA to the composite score line for enhanced clarity and signal filtering.
• **Clear Visualization:** A simple, color-coded oscillator line shows the final trend score, while individual component trends can also be plotted.
--- HOW TO INTERPRET ---
• **Zero Line Cross:** A cross above 0 indicates that the weighted balance of trend components has shifted to bullish. A cross below 0 signals a shift to bearish.
• **Oscillator Magnitude:** Values approaching +100 suggest a strong, broad-based uptrend consensus. Values nearing -100 indicate a strong downtrend consensus.
• **Slope:** The slope of the oscillator line indicates the accelerating or decelerating nature of the aggregate trend momentum.
• **Divergence:** As with any oscillator, watch for divergences between price action and the oscillator, which can signal a potential exhaustion of the prevailing trend.
Author: Aquaritek
——————————————————————————————————————————————————————————


DAILY LEVELDAILY LEVEL Indicator User Guide-especially for crypto
This indicator automatically draws five horizontal lines on your chart, representing the previous trading day's High, Low, Mid (average of High and Low), Open, and Close prices. Each line is labeled with its corresponding value. It is designed for intraday traders to quickly reference key price levels from the previous day, helping to identify support/resistance and make trading decisions.
"pdH / pdL / pdEQ / pdOpen / pdClose" Correspond to the previous day's High, Low, Mid, Open, and Close, respectively.
You can customize the color and style (solid, dotted, dashed, arrow, etc.) for each line.
"Line Width (width)": Sets the thickness of all horizontal lines (range: 1–5).
"Distance": Sets the horizontal offset of the labels from the current bar to avoid overlapping with candles (range: 1–200).
1.Add the Indicator
2.On the TradingView chart, click "Indicators," search for, and add this script.
3.Customize Parameters: Adjust the color, style, line width, and label distance for each line in the settings panel to suit your preferences.
4.Indicator Display: The indicator will automatically display the previous day's High, Low, Mid, Open, and Close as horizontal lines on the far right of the chart, with value labels (e.g., pdH: 1234.56) next to each line.
DAILY LEVEL 指标用户说明
本指标用于在K线图上自动绘制加密货币前一交易日的高点(High)、低点(Low)、中点(Mid)、开盘价(Open)、收盘价(Close)五条水平线,并在每条线上显示对应的数值标签。适用于日内交易者快速参考前一日关键价位,辅助判断支撑/阻力和交易决策。
pdH / pdL / pdEQ / pdOpen / pdClose分别对应前一日的高点、低点、中点、开盘价、收盘价。
每项都可自定义线条颜色和样式(实线、虚线、点划线、箭头等)。
线宽width: 设置所有水平线的粗细,范围1~5。
distance距离: 设置标签距离当前K线的水平偏移量,避免标签遮挡K线,范围1~200。
添加指标:在TradingView图表页面,点击“指标”,搜索并添加本脚本。
自定义参数:可在参数面板中调整每条线的颜色、样式、线宽和标签距离,满足个性化需求。
指标显示:指标会自动在图表最右侧显示前一日的高、低、中、开、收五条水平线,并在每条线右侧显示对应的数值标签(如:pdH: 1234.56)。

FIVEX Kombine Trend AnalizörüFIVEX doesn’t look at the market through the lens of just one indicator — it combines the insights of six powerful tools working together in harmony. This system brings together RSI, EMA, Bollinger Bands, OBV, MACD, and Fibonacci-based Pivot levels to deliver highly accurate signals for both trend direction and momentum.
Each indicator evaluates the chart based on its own logic and produces a decision: LONG, SHORT, or NEUTRAL. FIVEX collects these individual insights and only generates a trading signal when at least three indicators agree on the same direction. This significantly reduces false signals caused by random price movements.
At a glance, the table in the top right corner of your chart shows exactly what each indicator is thinking in real-time. Background color changes only occur when the signal is strong and stable — this keeps your screen clean and your decisions clear. If a signal appears, you'll immediately understand why.
Thanks to dynamic parameter adjustments based on timeframes, FIVEX behaves more aggressively on 15-minute charts and more refined on daily charts. It’s compatible with every trading style — from scalping to swing trading.
FIVEX isn’t just an indicator; it’s a consensus engine.
It questions, waits for confirmation, and shows only what’s truly strong.
It doesn’t shout the final word — it delivers the collective judgment of market logic.

MACDBBThis is a custom modified MACD where some parameters have been customized and Bollinger Band added to the MACD . When the MACD is running above its upper Bollinger Band , it will be depicted as lime, and vice versa red.
Then the second set of histograms is am idea of mine where the opposing parameters of MACD signals are deducted off each other to reveal the underlying "momentum" of the MACD .

Average price trend (Magistr)The indicator is a combined market analysis tool, which allows you to identify key support and resistance levels. The trend line is built on the basis of price behavior for a certain period and serves as a visual reference point of the market movement direction. The average buy price by players shows the level at which small market participants make their purchases, which allows to understand their probable entry and exit zones.

QQE Momentum Trend FilterRecommended for use in 1 hour time frame
Recommended for use in long/short arrangements

Mongoose EMA Ribbon — Pro EditionMongoose EMA Ribbon — Pro Edition
The Mongoose EMA Ribbon is a precision tool designed to support directional bias, trend integrity, and momentum alignment through a structured multi-EMA system. It is built for traders seeking clarity across high-timeframe trend conditions without sacrificing speed or simplicity.
Key Features:
Five customizable EMAs optimized for layered ribbon analysis
Configurable color logic for clean visual separation
Built-in ribbon compression and expansion visibility
Support for ribbon-based trend continuation zones
Optional label and visual tag for real-time trend state
Applications:
Identify trend strength and reversals with ribbon alignment
Detect compression zones that precede directional moves
Support discretionary or system-based trading strategies
Integrates well with price structure and macro overlays
This script is part of the Mongoose Capital toolkit and was developed to meet internal standards for clarity, execution readiness, and cross-asset compatibility.
Version: Pro Edition
Timeframes: Optimized for 1H, 4H, Daily, Weekly
Previous Daily High/LowThe previous day’s high and low are critical price levels that traders use to identify potential support, resistance, and intraday trading opportunities. These levels represent the highest and lowest prices reached during the prior trading session and often act as reference points for future price action.
Why Are Previous Daily High/Low Important?
Support & Resistance Zones
The previous day’s low often acts as support (buyers defend this level).
The previous day’s high often acts as resistance (sellers defend this level).
Breakout Trading
A move above the previous high suggests bullish momentum.
A move below the previous low suggests bearish momentum.
Mean Reversion Trading
Traders fade moves toward these levels, expecting reversals.
Example: Buying near the previous low in an uptrend.
Institutional Order Flow
Market makers and algos often reference these levels for liquidity.
How to Use Previous Daily High/Low in Trading
1. Breakout Strategy
Long Entry: Price breaks & closes above previous high → bullish continuation.
Short Entry: Price breaks & closes below previous low → bearish continuation.
2. Reversal Strategy
Long at Previous Low: If price pulls back to the prior day’s low in an uptrend.
Short at Previous High: If price rallies to the prior day’s high in a downtrend.
3. Range-Bound Markets
Buy near previous low, sell near previous high if price oscillates between them.
Example Trade Setup
Scenario: Price opens near the previous day’s high.
Bullish Case: A breakout above it targets next resistance.
Bearish Case: Rejection at the high signals a pullback.

GRIFFIN-2As a continuation of the GRIFFIN indicator, the GRIFFIN-2 indicator is here.
It currently contains ABRA and AVWAP.
Indicators will be added at another time.
Use it in good times.
--------------------------------------------------------------------------------------------
x.com

SMA Alignment (Triangle & X Signals)Cash Clash EXCLUSIVE This indicator is designed to provide clean and reliable trend signals using the alignment of four Simple Moving Averages: the 9, 21, 50, and 200-period SMAs. It identifies moments when the short-term, medium-term, and long-term momentum align in one direction—either bullish or bearish—based on the classic principle of moving average stacking.
When the SMAs are aligned in ascending order (9 > 21 > 50 > 200), the indicator plots a green upward triangle below the candle, signaling a bullish trend confirmation. Conversely, when the SMAs align in descending order (9 < 21 < 50 < 200), it plots a red downward triangle above the candle, signaling a bearish trend confirmation. These triangles only appear on the first candle where the alignment begins to avoid noise and repeated signals.
To provide clear exit or de-alignment signals, a small X is plotted on the candle where the alignment breaks—red for bullish exits and green for bearish exits—helping traders identify when the stacked trend loses structure.
All aspects of the indicator are customizable from the settings panel:
You can toggle on/off bullish and bearish signals
Choose whether to display entry triangles and exit Xs
Adjust the lengths of the SMAs to fit your strategy or asset class
This indicator is useful across all timeframes and asset types, making it especially powerful for:
Trend-following strategies
Confirming momentum shifts
Entry/exit timing on higher-timeframe trend plays or intraday setups
Whether you’re a swing trader or scalper, the SMA Alignment Indicator helps filter out noise and clarify market direction with simple, actionable signals.

Uptrick: Fusion Trend Reversion SystemOverview
The Uptrick: Fusion Trend Reversion System is a multi-layered indicator designed to identify potential price reversals during intraday movement while keeping traders informed of the dominant short-term trend. It blends a composite fair value model with deviation logic and a refined momentum filter using the Relative Strength Index (RSI). This tool was created with scalpers and short-term traders in mind and is especially effective on lower timeframes such as 1-minute, 5-minute, and 15-minute charts where price dislocations and quick momentum shifts are frequent.
Introduction
This indicator is built around the fusion of two classic concepts in technical trading: identifying trend direction and spotting potential reversion points. These are often handled separately, but this system merges them into one process. It starts by computing a fair value price using five moving averages, each with its own mathematical structure and strengths. These include the exponential moving average (EMA), which gives more weight to recent data; the simple moving average (SMA), which gives equal weight to all periods; the weighted moving average (WMA), which progressively increases weight with recency; the Arnaud Legoux moving average (ALMA), known for smoothing without lag; and the volume-weighted average price (VWAP), which factors in volume at each price level.
All five are averaged into a single value — the raw fusion line. This fusion acts as a dynamically balanced centerline that adapts to price conditions with both smoothing and responsiveness. Two additional exponential moving averages are applied to the raw fusion line. One is slower, giving a stable trend reference, and the other is faster, used to define momentum and cloud behavior. These two lines — the fusion slow and fusion fast — form the backbone of trend and signal logic.
Purpose
This system is meant for traders who want to trade reversals without losing sight of the underlying directional bias. Many reversal indicators fail because they act too early or signal too frequently in choppy markets. This script filters out noise through two conditions: price deviation and RSI confirmation. Reversion trades are considered only when the price moves a significant distance from fair value and RSI suggests a legitimate shift in momentum. That filtering process gives the trader a cleaner, higher-quality signal and reduces false entries.
The indicator also visually supports the trader through colored bars, up/down labels, and a filled cloud between the fast and slow fusion lines. These features make the market context immediately visible: whether the trend is up or down, whether a reversal just occurred, and whether price is currently in a high-risk reversion zone.
Originality and Uniqueness
What makes this script different from most reversal systems is the way it combines layers of logic — not just to detect signals, but to qualify and structure them. Rather than relying on a single MA or a raw RSI level, it uses a five-MA fusion to create a baseline fair value that incorporates speed, stability, and volume-awareness.
On top of that, the system introduces a dual-smoothing mechanism. It doesn’t just smooth price once — it creates two layers: one to follow the general trend and another to track faster deviations. This structure lets the script distinguish between continuation moves and possible turning points more effectively than a single-line or single-metric system.
It also uses RSI in a more refined way. Instead of just checking if RSI is overbought or oversold, the script smooths RSI and requires directional confirmation. Beyond that, it includes signal memory. Once a signal is generated, a new one will not appear unless the RSI becomes even more extreme and curls back again. This memory-based gating reduces signal clutter and prevents repetition, a rare feature in similar scripts.
Why these indicators were merged
Each moving average in the fusion serves a specific role. EMA reacts quickly to recent price changes and is often favored in fast-trading strategies. SMA acts as a long-term filter and smooths erratic behavior. WMA blends responsiveness with smoothing in a more balanced way. ALMA focuses on minimizing lag without losing detail, which is helpful in fast markets. VWAP anchors price to real trade volume, giving a sense of where actual positioning is happening.
By combining all five, the script creates a fair value model that doesn’t lean too heavily on one logic type. This fusion is then smoothed into two separate EMAs: one slower (trend layer), one faster (signal layer). The difference between these forms the basis of the trend cloud, which can be toggled on or off visually.
RSI is then used to confirm whether price is reversing with enough force to warrant a trade. The RSI is calculated over a 14-period window and smoothed with a 7-period EMA. The reason for smoothing RSI is to cut down on noise and avoid reacting to short, insignificant spikes. A signal is only considered if price is stretched away from the trend line and the smoothed RSI is in a reversal state — below 30 and rising for bullish setups, above 70 and falling for bearish ones.
Calculations
The script follows this structure:
Calculate EMA, SMA, WMA, ALMA, and VWAP using the same base length
Average the five values to form the raw fusion line
Smooth the raw fusion line with an EMA using sens1 to create the fusion slow line
Smooth the raw fusion line with another EMA using sens2 to create the fusion fast line
If fusion slow is rising and price is above it, trend is bullish
If fusion slow is falling and price is below it, trend is bearish
Calculate RSI over 14 periods
Smooth RSI using a 7-period EMA
Determine deviation as the absolute difference between current price and fusion slow
A raw signal is flagged if deviation exceeds the threshold
A raw signal is flagged if RSI EMA is under 30 and rising (bullish setup)
A raw signal is flagged if RSI EMA is over 70 and falling (bearish setup)
A final signal is confirmed for a bullish setup if RSI EMA is lower than the last bullish signal’s RSI
A final signal is confirmed for a bearish setup if RSI EMA is higher than the last bearish signal’s RSI
Reset the bullish RSI memory if RSI EMA rises above 30
Reset the bearish RSI memory if RSI EMA falls below 70
Store last signal direction and use it for optional bar coloring
Draw the trend cloud between fusion fast and fusion slow using fill()
Show signal labels only if showSignals is enabled
Bar and candle colors reflect either trend slope or last signal direction depending on mode selected
How it works
Once the script is loaded, it builds a fusion line by averaging five different types of moving averages. That line is smoothed twice into a fast and slow version. These two fusion lines form the structure for identifying trend direction and signal areas.
Trend bias is defined by the slope of the slow line. If the slow line is rising and price is above it, the market is considered bullish. If the slow line is falling and price is below it, it’s considered bearish.
Meanwhile, the script monitors how far price has moved from that slow line. If price is stretched beyond a certain distance (set by the threshold), and RSI confirms that momentum is reversing, a raw reversion signal is created. But the script only allows that signal to show if RSI has moved further into oversold or overbought territory than it did at the last signal. This blocks repetitive, weak entries. The memory is cleared only if RSI exits the zone — above 30 for bullish, below 70 for bearish.
Once a signal is accepted, a label is drawn. If the signal toggle is off, no label will be shown regardless of conditions. Bar colors are controlled separately — you can color them based on trend slope or last signal, depending on your selected mode.
Inputs
You can adjust the following settings:
MA Length: Sets the period for all moving averages used in the fusion.
Show Reversion Signals: Turns on the plotting of “Up” and “Down” labels when a reversal is confirmed.
Bar Coloring: Enables or disables colored bars based on trend or signal direction.
Show Trend Cloud: Fills the space between the fusion fast and slow lines to reflect trend bias.
Bar Color Mode: Lets you choose whether bars follow trend logic or last signal direction.
Sens 1: Smoothing speed for the slow fusion line — higher values = slower trend.
Sens 2: Smoothing speed for the fast line — lower values = faster signal response.
Deviation Threshold: Minimum distance price must move from fair value to trigger a signal check.
Features
This indicator offers:
A composite fair value model using five moving average types.
Dual smoothing system with user-defined sensitivity.
Slope-based trend definition tied to price position.
Deviation-triggered signal logic filtered by RSI reversal.
RSI memory system that blocks repetitive signals and resets only when RSI exits overbought or oversold zones.
Real-time tracking of the last signal’s direction for optional bar coloring.
Up/Down labels at signal points, visible only when enabled.
Optional trend cloud between fusion layers, visualizing current market bias.
Full user control over smoothing, threshold, color modes, and visibility.
Conclusion
The Fusion Trend-Reversion System is a tool for short-term traders looking to fade price extremes without ignoring trend bias. It calculates fair value using five diverse moving averages, smooths this into two dynamic layers, and applies strict reversal logic based on RSI deviation and momentum strength. Signals are triggered only when price is stretched and momentum confirms it with increasingly strong behavior. This combination makes the tool suitable for scalping, intraday entries, and fast market environments where precision matters.
Disclaimer
This indicator is for informational and educational purposes only. It does not constitute financial advice. All trading involves risk, and no tool can predict market behavior with certainty. Use proper risk management and do your own research before making trading decisions.

EMA Cross Alert with SoundShows you when the 9 and 20 ema crosses and you can set up alerts so you dont have watch the charts

5 MAsTitle: 5 MAs — Key Moving Averages + 2h Trend Filter
Description:
This indicator plots five essential moving averages used for identifying market structure, momentum shifts, and trend confirmation across multiple timeframes. It’s designed for traders who blend intraday price action with higher-timeframe context.
Included Averages:
200 SMA (red): Long-term trend direction and dynamic support/resistance.
50 SMA (blue): Medium-term trend guide, often used for pullbacks or structure shifts.
21 EMA (purple): Shorter-term momentum guide — commonly used in trending strategies.
10 EMA (green): Fast momentum line for scalping, intraday setups, or crossover signals.
2h 20 EMA (orange): Higher-timeframe trend filter pulled from the 2-hour chart — adds confluence when trading lower timeframes (e.g., 5m, 15m).
How to Use:
Use the alignment of these MAs to confirm market bias (e.g., all pointing up = strong bullish structure).
Watch for crossovers, price interaction, or dynamic support/resistance at key levels.
The 2h 20 EMA adds a higher timeframe filter to avoid counter-trend trades and spot reversals early.
Best Used For:
Scalping, intraday trading, swing entries, or trend-following systems.
