AI Breakout Bands (Zeiierman)█ Overview
AI Breakout Bands (Zeiierman) is an adaptive trend and breakout detection system that combines Kalman filtering with advanced K-Nearest Neighbor (KNN) smoothing. The result is a smart, self-adjusting band structure that adapts to dynamic market behavior, identifying breakout conditions with precision and visual clarity.
At its core, this indicator estimates price behavior using a two-dimensional Kalman filter (position + velocity), then enhances the smoothing process with a nonlinear, similarity-based KNN filter. This unique blend enables it to handle noisy markets and directional shifts with both speed and stability — providing breakout traders and trend followers a reliable framework to act on.
Whether you're identifying volatility expansions, capturing trend continuations, or spotting early breakout conditions, AI Breakout Bands gives you a mathematically grounded, visually adaptive roadmap of real-time market structure.
█ How It Works
⚪ Kalman Filter Engine
The Kalman filter models price movement as a state system with two components:
Position (price)
Velocity (trend direction)
It recursively updates predictions using real-time price as a noisy observation, balancing responsiveness with smoothness.
Process Noise (Position) controls sensitivity to sudden moves.
Process Noise (Velocity) controls smoothing of directional flow.
Measurement Noise (R) defines how much the filter "trusts" live price data.
This component alone creates a responsive yet stable estimate of the market’s center of gravity.
⚪ Advanced K-Neighbor Smoothing
After the Kalman estimate is computed, the script applies a custom K-Nearest Neighbor (KNN) smoother.
Rather than averaging raw values, this method:
Finds K most similar past Kalman values
Weighs them by similarity (inverse of absolute distance)
Produces a smoother that emphasizes structural similarity
This nonlinear approach gives the indicator an AI feature — reacting fast when needed, yet staying calm in consolidation.
█ How to Use
⚪ Trend Recognition
The line color shifts dynamically based on slope direction and breakout confirmation.
Bullish conditions: price above the mid band with positive slope
Bearish conditions: price below the mid band with negative slope
⚪ Breakout Signals
Price breaking above or below the bands may signal momentum acceleration.
Combine with your own volume or momentum confirmation for stronger entries.
Bands adapt to market noise, helping filter out low-quality whipsaws.
█ Settings
Process Noise (Position): Controls Kalman filter’s sensitivity to price changes.
Process Noise (Velocity): Controls smoothing of directional component.
Measurement Noise (R): Defines how much trust is placed in price data.
K-Neighbor Length: Number of historical Kalman values considered for smoothing.
Slope Calculation Window: Number of bars used to compute trend slope of the smoothed Kalman.
Band Lookback (MAE): Rolling period for average absolute error.
Band Multiplier: Multiplies MAE to determine band width.
-----------------
Disclaimer
The content provided in my scripts, indicators, ideas, algorithms, and systems is for educational and informational purposes only. It does not constitute financial advice, investment recommendations, or a solicitation to buy or sell any financial instruments. I will not accept liability for any loss or damage, including without limitation any loss of profit, which may arise directly or indirectly from the use of or reliance on such information.
All investments involve risk, and the past performance of a security, industry, sector, market, financial product, trading strategy, backtest, or individual's trading does not guarantee future results or returns. Investors are fully responsible for any investment decisions they make. Such decisions should be based solely on an evaluation of their financial circumstances, investment objectives, risk tolerance, and liquidity needs.
Moving Averages

EMA and Dow Theory Strategies🌐 Strategy Description
📘 Overview
This is a hybrid strategy that combines EMA crossovers, Dow Theory swing logic, and multi-timeframe trend overlays. It is suitable for intraday to short-term trading on any asset class: crypto, forex, stocks, and indices.
The strategy provides precise entry/exit signals, dynamic stop-loss and scale-out, and highly visual trade guidance.
🧠 Key Features
・Dual EMA crossover system (applied to both symbol and external index)
・Dow Theory-based swing high/low detection for trend confirmation
・Visual overlay of higher timeframe swing trend (htfTrend)
・RSI filter to avoid overbought/oversold entries
・Dynamic partial take-profit when trend weakens
・Custom stop-loss (%) control
・Visualized trade PnL labels directly on chart
・Alerts for entry, stop-loss, partial exit
・Gradient background zones for swing zones and trend visualization
・Auto-tracked metrics: APR, drawdown, win rate, equity curve
⚙️ Input Parameters
| Parameter | Description |
| ------------------------- | -------------------------------------------------------- |
| Fast EMA / Slow EMA | Periods for detecting local trend via EMAs |
| Index Fast EMA / Slow EMA | EMAs applied to external reference index |
| StopLoss | Maximum loss threshold in % |
| ScaleOut Threshold | Scale-out percentage when trend changes color |
| RSI Period / Levels | RSI period and overbought/oversold levels |
| Swing Detection Length | Number of bars used to detect swing highs/lows |
| Stats Display Options | Toggle PnL labels and position of statistics table |
🧭 About htfTrend (Higher Timeframe Trend)
The script includes a higher timeframe trend (htfTrend) calculated using Dow Theory (pivot highs/lows).
This trend is only used for visual guidance, not for actual entry conditions.
Why? Strictly filtering trades by higher timeframe often leads to missed opportunities and low frequency.
By keeping htfTrend visual-only, traders can still refer to macro structure but retain trade flexibility.
Use it as a contextual tool, not a constraint.
ストラテジー説明
📘 概要
本ストラテジーは、EMAクロスオーバー、ダウ理論によるスイング判定、**上位足トレンドの視覚表示(htfTrend)**を組み合わせた複合型の短期トレーディング戦略です。
仮想通貨・FX・株式・指数など幅広いアセットに対応し、デイトレード〜スキャルピング用途に適しています。
動的な利確/損切り、視覚的にわかりやすいエントリー/イグジット、統計表示を搭載しています。
🧠 主な機能
・対象銘柄+外部インデックスのEMAクロスによるトレンド判定
・ダウ理論に基づいたスイング高値・安値検出とトレンド判断
・上位足スイングトレンド(htfTrend)の視覚表示
・RSIフィルターによる過熱・売られすぎの回避
・トレンドの弱まりに応じた部分利確(スケールアウト)
・**損切り閾値(%)**をカスタマイズ可能
・チャート上に損益ラベル表示
・アラート完備(エントリー・決済・部分利確)
・トレンドゾーンを可視化する背景グラデーション
・勝率・ドローダウン・APR・資産増加率などの自動表示
| 設定項目名 | 説明内容 |
| --------------------- | -------------------------- |
| Fast EMA / Slow EMA | 銘柄に対して使用するEMAの期間設定 |
| Index Fast / Slow EMA | 外部インデックスのEMA設定 |
| 損切り(StopLoss) | 損切りラインのしきい値(%で指定) |
| 部分利確しきい値 | トレンド弱化時にスケールアウトする割合(%) |
| RSI期間・水準 | RSI計算期間と、過熱・売られすぎレベル設定 |
| スイング検出期間 | スイング高値・安値の検出に使用するバー数 |
| 統計表示の切り替え | 損益ラベルや統計テーブルの表示/非表示選択 |
🧭 上位足トレンド(htfTrend)について
本スクリプトには、上位足でのスイング高値・安値の更新に基づく**htfTrend(トレンド判定)が含まれています。
これは視覚的な参考情報であり、エントリーやイグジットには直接使用されていません。**
その理由は、上位足を厳密にロジックに組み込むと、トレード機会の損失が増えるためです。
このスクリプトでは、**判断の補助材料として「表示のみに留める」**設計を採用しています。
→ 裁量で「利確を早める」「逆張りを避ける」判断に活用可能です。

Multi-Method Moving Average v6.0Multi-Methods Moving Average Indicator is a versatile tool designed for traders who want to identify key price levels that can act as support and resistance in the market. This indicator utilizes multiple moving averages (MAs) to help visualize price trends and potential reversal points, aiding traders in making informed decisions.
Features
Multiple Moving Averages: The indicator calculates and displays six different moving averages (MA1 to MA6) based on user-defined periods. This allows traders to analyze short-term and long-term trends effectively.
Customizable Inputs: Users can customize the periods for each moving average and select the type of moving average (SMA, EMA, WMA) that best suits their trading strategy.
Price Source Selection: The indicator allows users to choose the price source (Open, Close, High, Low, or the average of Open and Close) for calculating the moving averages, providing flexibility in analysis.
Color-Coded Signals: The moving averages are color-coded based on the current price relative to the moving average, helping traders quickly identify bullish or bearish conditions.
How to Use
Adding the Indicator:
Open TradingView and navigate to the chart you wish to analyze.
Click on the "Indicators" button at the top of the chart.
Search for "Multi-Methods Moving Average" and select the indicator to add it to your chart.
Customizing Settings:
Click on the gear icon next to the indicator's name in the chart legend to open the settings menu.
Adjust the periods for each moving average to fit your trading style. Common settings include 9, 26, 52, 100, 200, and 500 periods.
Choose the type of moving average you prefer (SMA, EMA, or WMA).
Select the price source that aligns with your trading strategy.
Interpreting the Indicator:
Moving Averages: Observe the position of the moving averages relative to the price. If the price is above the moving average, it indicates a bullish trend; if below, it suggests a bearish trend.
Crossover Signals: Look for crossovers between the moving averages. A crossover where a shorter moving average crosses above a longer moving average may signal a potential buy opportunity, while a crossover in the opposite direction may indicate a sell opportunity.
Support and Resistance Levels: Use the moving averages as dynamic support and resistance levels. Price often reacts at these levels, providing potential entry and exit points for trades.
Risk Management:
Always combine the insights from this indicator with other forms of analysis, such as price action, volume analysis, and market sentiment.
Set stop-loss and take-profit levels based on the identified support and resistance levels to manage your risk effectively.
Conclusion
The Support & Resistance Indicator is an essential tool for traders looking to enhance their market analysis. By leveraging multiple moving averages and customizable settings, traders can gain a clearer understanding of market trends and make more informed trading decisions.

15m EMA 50 CloudDescription:
The 15m EMA 50 Cloud is a simple but powerful tool designed for scalpers and intraday traders who hunt for low timeframe patterns while staying anchored to higher timeframe trend context.
This indicator displays the 50-period EMA and its volatility cloud from the 15-minute chart on any timeframe - including 1m, 3m, or 5m. The cloud adapts dynamically and remains visible even when you zoom into lower timeframes, helping you instantly see whether price is trading above, below or within the 15m trend structure.
Features:
* Plots the 15-minute 50 EMA Cloud on any chart, regardless of your selected timeframe.
* Cloud width is based on 15m price volatility (standard deviation), inspired by the popular "Traders Reality" indicator.
* Option to enable or hide the EMA line for a cleaner look.
* Customizable colors for the cloud fill, border, and EMA line.
* Works with all markets and all symbols.
How to Use:
* Perfect for scalpers who want to spot micro patterns (e.g., on 1m or 3m charts) while keeping
the 15m EMA cloud as a visual "road map".
* Use the cloud as a dynamic support/resistance zone or to define higher timeframe trend bias.
* Combine with your favorite price action or orderflow setups for multi-timeframe confluence.
Settings:
* Toggle EMA line ON/OFF.
* Adjust cloud and border colors for your chart style.
For educational purposes only. This indicator does not provide financial advice or signals. Always use proper risk management.
⚠️ Important Notice
This tool is provided for educational and informational purposes only . It is designed to assist in technical analysis learning and visual chart study.
It is not intended to be used as financial advice, a buy/sell signal, or any form of investment recommendation .
By using this indicator, you acknowledge that all actions you take are your own and you assume full responsibility for any decisions made.

Auto Intelligence Selective Moving Average(AI/MA)# 🤖 Auto Intelligence Moving Average Strategy (AI/MA)
**AI/MA** is a state-adaptive moving average crossover strategy designed to **maximize returns from golden cross / death cross logic** by intelligently switching between different MA types and parameters based on market conditions.
---
## 🎯 Objective
To build a moving average crossover strategy that:
- **Adapts dynamically** to market regimes (trend vs range, rising vs falling)
- **Switches intelligently** between SMA, EMA, RMA, and HMA
- **Maximizes cumulative return** under realistic backtesting
---
## 🧪 materials amd methods
- **MA Types Considered**: SMA, EMA, RMA, HMA
- **Parameter Ranges**: Periods from 5 to 40
- **Market Conditions Classification**:
- Based on the slope of a central SMA(20) line
- And the relative position of price to the central line
- Resulting in 4 regimes: A (Bull), B (Pullback), C (Rebound), D (Bear)
- **Optimization Dataset**:
- **Bybit BTCUSDT.P**
- **1-hour candles**
- **2024 full-year**
- **Search Process**:
- **Random search**: 200 parameter combinations
- Evaluated by:
- `Cumulative PnL`
- `Sharpe Ratio`
- `Max Drawdown`
- `R² of linear regression on cumulative PnL`
- **Implementation**:
- Optimization performed in **Python (Pandas + Matplotlib + Optuna-like logic)**
- Final parameters ported to **Pine Script (v5)** for TradingView backtesting
---
## 📈 Performance Highlights (on optimization set)
| Timeframe | Return (%) | Notes |
|-----------|------------|----------------------------|
| 6H | +1731% | Strongest performance |
| 1D | +1691% | Excellent trend capture |
| 12H | +1438% | Balance of trend/range |
| 5min | +27.3% | Even survives scalping |
| 1min | +9.34% | Robust against noise |
- Leverage: 100x
- Position size: 100%
- Fees: 0.055%
- Margin calls: **none** 🎯
---
## 🛠 Technology Stack
- `Python` for data handling and optimization
- `Pine Script v5` for implementation and visualization
- Fully state-aware strategy, modular and extendable
---
## ✨ Final Words
This strategy is **not curve-fitted**, **not over-parameterized**, and has been validated across multiple timeframes. If you're a fan of dynamic, intelligent technical systems, feel free to use and expand it.
💡 The future of simple-yet-smart trading begins here.

MA Signal IndicatorMA Signal Indicator
The MA Signal Indicator is a customizable designed to identify potential trading opportunities based on price interactions with a Simple Moving Average (SMA). It incorporates risk management features such as stop-loss (SL), take-profit (TP), and breakeven levels, calculated using the Average True Range (ATR). The indicator is visually intuitive, overlaying trade signals, price levels, and colored zones directly on the chart.
Key Features:
1. Moving Average-Based Signals:
• Generates buy (long) signals when the price crosses above a user-defined SMA (default: 55 periods).
• Generates sell (short) signals when the price crosses below the SMA.
• Long and short trades can be independently enabled or disabled via input settings.
2. Risk Management:
• Stop-Loss (SL): Set as a multiple of the ATR (default: 1x ATR) below the entry price for long trades or above for short trades.
• Take-Profit (TP): Set as a multiple of the ATR (default: 5x ATR) above the entry price for long trades or below for short trades.
• Breakeven Level: A trigger level (default: 2x ATR) where traders may choose to move their stop-loss to breakeven, optionally displayed on the chart.
3. Visual Feedback:
• SMA Line: Plotted in orange (default: 55-period SMA) for trend reference.
• Trade Zone: Highlights the area between the stop-loss and take-profit levels with a semi-transparent green (long) or red (short) background.
• Price Lines: Displays entry price (white), stop-loss (red), take-profit (green), and breakeven level (gray, optional) as horizontal lines during active trades.
• Signal Markers: Triangular markers indicate entry points (green triangle up for long, red triangle down for short).
• Exit Markers: Labels show when a trade hits the take-profit (green checkmark) or stop-loss (red cross).
4. Trade Logic:
• Only one trade is active at a time (long or short).
• Trades are exited when either the stop-loss or take-profit is hit, resetting the indicator for the next signal.
• Ensures signals are only triggered when not already in a trade, avoiding duplicate entries.
Inputs:
• MA Period: Length of the SMA (default: 55).
• ATR Period: Period for ATR calculation (default: 5).
• SL Multiplier: ATR multiplier for stop-loss (default: 1.0).
• TP Multiplier: ATR multiplier for take-profit (default: 5.0).
• Move to Breakeven After: ATR multiplier for breakeven trigger (default: 2.0).
• Show Break Even Line: Option to display the breakeven level (default: true).
• Allow Long Trades: Enable/disable long signals (default: true).
• Allow Short Trades: Enable/disable short signals (default: true).
Use Case:
This indicator is ideal for trend-following traders who want a clear, visual system for entering and exiting trades based on SMA crossovers, with predefined risk and reward levels. It suits both manual and automated trading strategies, providing flexibility to adjust parameters for different markets or timeframes.
Notes:
• The indicator is overlaid on the price chart for easy integration with other analysis tools.
• Users should test and adjust parameters (e.g., MA length, ATR multipliers) to suit their trading style and market conditions.
• The breakeven line is a visual guide; manual adjustment of stops is required as the indicator does not automatically modify trade positions.
This indicator provides a robust framework for disciplined trading with clear entry, exit, and risk management visuals.
ATR Trend Strategy + KAMA FilterATR Trend Strategy with XMA KAMA Filter
Strategy Description
This strategy combines a dynamic ATR trailing stop with an XMA KAMA filter to precisely detect trends and generate reliable entry signals.
It uses a two-step trend confirmation system:
1️⃣ ATR Trailing Stop
Based on the Average True Range (ATR), this trailing stop automatically adapts to market volatility.
It determines whether the market is in a bullish or bearish phase by comparing the current price to the ATR trailing stop level.
2️⃣ KAMA Filter (XMA Version)
KAMA (Kaufman Adaptive Moving Average) provides an additional trend filter.
This XMA version of KAMA avoids the traditional fast/slow parameters and instead dynamically calculates the ratio of signal to market "noise", helping to reduce false signals and over-sensitivity.
How It Works
Long Signal:
Price is above both the ATR trailing stop and the KAMA (XMA) line.
Short Signal:
Price is below both the ATR trailing stop and the KAMA (XMA) line.
What Makes This Strategy Different?
Unlike many classic strategies that rely on simple moving averages, this system uses an adaptive KAMA filter that responds better to changing market conditions and volatility.
The ATR trailing stop automatically adjusts to current market volatility, providing an extra layer of protection against false breakouts.
By combining these tools, this strategy offers:
Precise trend filtering
Avoidance of false breakouts and noise
Dynamic adjustment to market conditions
How to Use
Apply the strategy to any market chart (Forex, stocks, crypto, indices, etc.)
Adjust the ATR and KAMA parameters to match your trading plan
Use the TradingView Strategy Tester to evaluate performance before live trading
Who Is This For?
Swing traders and trend followers
Traders looking for clean, filtered signals with reduced noise
Medium-term traders seeking a system that adapts to market dynamics
Additional Info: Heikin Ashi Compatibility
This strategy is fully compatible with Heikin Ashi candles.
By applying it to a chart with Heikin Ashi candles, traders can further reduce market noise and enhance trend visualization.
The combination of ATR trailing stop + XMA KAMA filter + Heikin Ashi smoothing provides an even cleaner trend-following system, minimizing false signals and improving decision-making clarity.

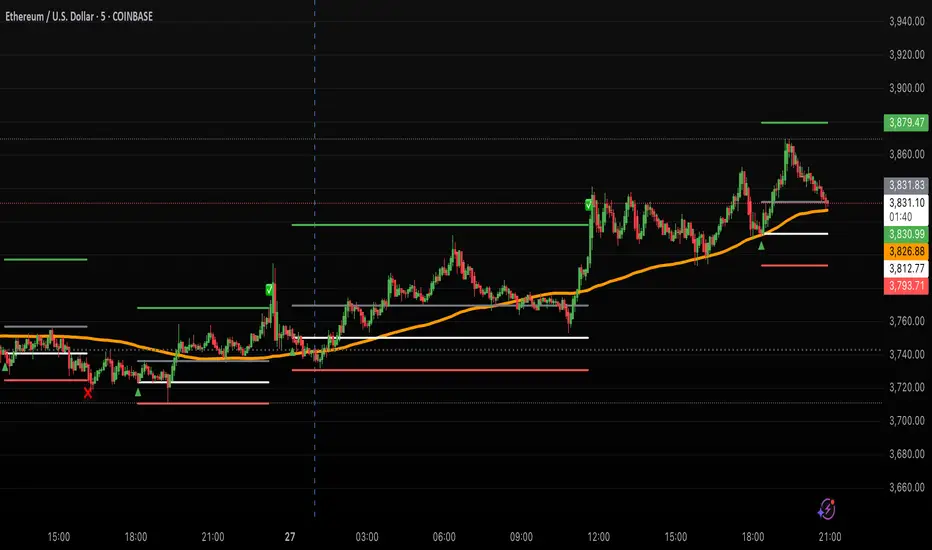
LANZ Strategy 5.0 [Backtest]🔷 LANZ Strategy 5.0 — Rule-Based BUY Logic with Time Filter, Session Limits and Auto SL/TP Execution
This is the backtest version of LANZ Strategy 5.0, built as a strategy script to evaluate real performance under fixed intraday conditions. It automatically places BUY and SELL trades based on structured candle confirmation, EMA trend alignment, and session-based filters. The system simulates real-time execution with precise Stop Loss and Take Profit levels.
📌 Built for traders seeking to simulate clean intraday logic with fully automated entries and performance metrics.
🧠 Core Logic & Strategy Conditions
✅ BUY Signal Conditions:
Price is above the EMA200
The last 3 candles are bullish (close > open)
The signal occurs within the defined session window (NY time)
Daily trade limit has not been exceeded
If all are true, a BUY order is executed at market, with SL and TP set immediately.
🔻 SELL Signal Conditions (Optional):
Exactly inverse to BUY (below EMA + 3 bearish candles). Disabled by default.
🕐 Operational Time Filter (New York Time)
You can fully customize your intraday window:
Start Time: e.g., 01:15 NY
End Time: e.g., 16:00 NY
The system evaluates signals only within this range, even across midnight if configured.
🔁 Trade Management System
One trade at a time per signal
Trades include a Stop Loss (SL) and Take Profit (TP) based on pip distance
Trade result is calculated automatically
Each signal is shown with a triangle marker (BUY only, by default)
🧪 Backtest Accuracy
This version uses:
strategy.order() for entries
strategy.exit() for SL and TP
strategy.close_all() at the configured manual closing time
This ensures realistic behavior in the TradingView strategy tester.
⚙️ Flow Summary (Step-by-Step)
On every bar, check:
Is the time within the operational session?
Is the price above the EMA?
Are the last 3 candles bullish?
If conditions met → A BUY trade is opened:
SL = entry – X pips
TP = entry + Y pips
Trade closes:
If SL or TP is hit
Or at the configured manual close time (e.g., 16:00 NY)
📊 Settings Overview
Timeframe: 1-hour (ideal)
SL/TP: Configurable in pips
Max trades/day: User-defined (default = 99 = unlimited)
Manual close: Adjustable by time
Entry type: Market (not limit)
Visuals: Plotshape triangle for BUY entry
👨💻 Credits:
💡 Developed by: LANZ
🧠 Strategy logic & execution: LANZ
✅ Designed for: Clean backtesting, clarity in execution, and intraday logic simulation

LANZ Strategy 5.0🔷 LANZ Strategy 5.0 — Intraday BUY Signals, Dynamic Lot Size per Account, Real-Time Dashboard and Smart Execution
LANZ Strategy 5.0 is a powerful intraday tool designed for traders who need a visual-first, data-backed BUY system, enhanced with risk-aware lot size calculation and a real-time performance dashboard. This indicator intelligently detects strong momentum setups and provides visual and statistical clarity throughout the session.
📌 This is an indicator, not a strategy — It does not place trades automatically but provides precise conditions, alerts, and visual guides to support execution.
🧠 Core Logic & Features
BUY Entry Conditions (Signal Engine)
A BUY signal is triggered when:
The current price is above the EMA200 (trend filter)
The last 3 candles are bullish (candle body close > open)
You are within the defined session window (NY time)
When all conditions are met and you haven’t reached the daily trade limit, a signal appears on the chart and an optional alert is triggered.
Operational Hours Filter (NY Time)
You define:
Start time (e.g., 01:15 NY)
End time (e.g., 16:00 NY)
The system only evaluates and executes signals within this period. If a BUY setup occurs outside the window, it’s ignored. The chart is also highlighted with a transparent teal background to visually show active trading hours.
Lot Size Panel with Per-Account Risk Management
Designed for traders managing multiple accounts or capital sources. You can enable up to 5 accounts, each with:
Its own capital
Its own risk percentage per trade
The system uses the defined SL in pips, plus the instrument’s pip value, to calculate the lot size per account. All values are shown in a dedicated panel at the bottom-right, automatically updating with each new trade.
The emojis (🐣🦊🦁🐲🐳) distinguish each account visually.
Trade Visualization with Customizable Lines
When a signal is triggered:
An Entry Point (EP) line is drawn at the candle’s close.
A Stop Loss (SL) line is placed X pips below the entry.
A Take Profit (TP) line is placed Y pips above the entry.
All three lines are fully customizable in style, color, and thickness. You define how many bars the lines should extend.
Outcome Tracking & Real-Time Dashboard
Each trade outcome is measured:
SL hit = –1.00%
TP hit = +3.00%
Manual close = calculated dynamically based on price at close time
Each result is labeled on the chart near its level, and stored.
The top-right dashboard updates in real time:
✅ Number of trades
📈 Cumulative % gain/loss of the day (color-coded)
Alerts You Can Trust:
You’ll get a Buy Alert when a valid signal is formed
You’ll get a Trade Executed Alert when the visual operation is plotted
You’ll get a SL/TP Hit Alert with price and result
You’ll get a Manual Close Alert if the configured time is reached and the trade is still active
⚙️ Step-by-Step Execution Flow
At every bar, the system checks:
Are we within the session time window?
Is price above EMA?
Are the last 3 candles bullish?
✅ If yes:
A BUY signal is plotted
Entry/SL/TP lines are drawn
Lot sizes are calculated and displayed
Trade is added to the daily count
🕐 At the configured Manual Close time (e.g., 16:00 NY):
If the trade is still open, it's closed
A label is added with the exact result in %
💡 Ideal For:
Intraday traders who operate within fixed time sessions
Traders managing multiple accounts or capital pools
Anyone who wants full visual clarity of every decision point
Traders who appreciate dynamic lot size calculation and clean execution tracking
👨💻 Credits:
💡 Developed by: LANZ
🧠 Strategy concept & execution model: LANZ
🧪 Tested on: 1H charts with visual-only execution
📈 Designed for: Clarity, adaptability, and full intraday control

TeeLek-BestPositionThis indicator is used to indicate the best buying and selling points.
This indicator will calculate the best buying points (blue) and selling points (orange). The working principle is that the blue point is the point where the RSI is Over Sold, the orange point is the point where the RSI is Over Bought. After that, we will use the Highest Line 100 and Lowest Line 100 to filter the points another layer. And because when Over Bought/Over Sold occurs, there will be continuous signals that are repeated, causing confusion. Therefore, there is a feature to leave a time frame. Set the default value to 24 hours. If a signal occurs, it will be left out.
The appropriate point for buying is:
The point where Over Sold occurs and Closes lower than the Lowest Line 100.
Leave a time frame for 24 hours before a new signal occurs.
The appropriate point for selling is:
The point where Over Bought occurs and Closes higher than the Highest Line 100.
Leave a time frame for 24 hours before a new signal occurs.
It helps us to gradually buy and collect/sell for profit easily without confusion.
อินดิเคเตอร์นี้ใช้ สำหรับบอกจุดซื้อจุดขายที่ดีที่สุด
อินดิเคเตอร์นี้ จะคำนวณจุดซื้อ (สีฟ้า) และจุดขาย (สีส้ม) ที่ดีที่สุดมาให้ โดยหลักการทำงาน คือ จุดสีฟ้า คือจุดที่ RSI Over Sold จุดสีส้ม คือจุดที่ RSI Over Bought หลังจากนั้นเราจะใช้เส้น Highest Line 100 และ Lowest Line 100 เพื่อกรองจุดอีกชั้นหนึ่ง และเนื่องจากเมื่อเกิด Over Bought/Over Sold แล้ว มันจะเกิดสัญญาณต่อเนื่องซ้ำๆ ทำให้สับสน จึงได้มีฟีเจอร์ในการเว้นระยะเวลา ตั้งค่าไว้เริ่มต้นที่ 24 ชั่วโมง ถ้าเกิดสัญญาณแล้วก็จะเว้นระยะออกไป
จุดที่เหมาะสมกับการซื้อ คือ
จุดที่เกิด Over Sold และ Close ต่ำกว่าเส้น Lowest Line 100
เว้นระยะไป 24 ชั่วโมงจึงจะเกิดสัญญาณใหม่อีกครั้ง
จุดที่เหมาะสมกับการขาย คือ
จุดที่เกิด Over Bought และ Close สูงกว่าเส้น Highest Line 100
เว้นระยะไป 24 ชั่วโมงจึงจะเกิดสัญญาณใหม่อีกครั้ง
ช่วยให้เราสามารถ ทยอยซื้อเก็บสะสม/ทยอยขายทำกำไร ได้ง่ายไม่สับสน

7 EMA CloudThe "7 EMA Cloud" script was likely flagged because it reuses the core concept of EMA clouds (shading areas between multiple EMAs to visualize trends, support/resistance, and momentum) without crediting the original inventor, Ripster (author ripster47 on TradingView). This concept is prominently associated with Ripster's "EMA Clouds" indicator, which popularized filling spaces between EMA pairs for trading signals. TradingView's house rules require crediting authors when reusing open-source ideas or code, even if not a direct copy-paste, and mandate significant improvements where the original forms a small proportion of the script. Your version adds features like multiple color modes (Classic rainbow, Monochrome, Heatmap), customizable signal sizes, and crossover alerts between the first and last EMA, which are enhancements, but the foundational EMA ribbon/cloud idea needs explicit attribution in the description and ideally code comments to comply.
Additionally, the description might be seen as not fully self-contained (e.g., it uses promotional language like "Advanced" and "Adaptive Trend & Signal Suite" without deeply explaining calculations or use cases), potentially violating rules against relying on code or external references for clarity.
To fix this, republish a new version with proper credits, ensure the description is detailed and standalone, and emphasize your improvements (e.g., the 7 Fibonacci-based EMAs, color modes, and signals). Do not reuse the flagged script—create a fresh one. Here's a compliant description you can use:
7 EMA Cloud Indicator
Overview
The 7 EMA Cloud overlays seven exponential moving averages (EMAs) with Fibonacci-inspired periods and fills the spaces between them with customizable "clouds" to visually represent trend strength, direction, and convergence/divergence. It includes crossover signals between the shortest and longest EMAs for potential entry/exit points, with adjustable visual modes for different trading styles. This helps traders identify bullish/bearish momentum, support/resistance zones, and overextensions in trending or ranging markets.
This script builds on the EMA cloud concept popularized by Ripster (ripster47) in their "EMA Clouds" indicatortradingview.com, where areas between EMA pairs are shaded for trend analysis. Improvements include a fixed set of 7 Fibonacci EMAs, multiple color schemes (Classic rainbow, Monochrome grayscale, Heatmap for intensity), user-selectable signal sizes, and transparency controls. Released under the Mozilla Public License 2.0.
Key Features
7 EMAs with Clouds: EMAs at periods 8, 13, 21, 34, 55, 89, and 144; clouds filled between consecutive pairs to show alignment (tight clouds for consolidation, wide for trends).
Color Modes:
Classic: Rainbow gradients (blue to purple) for vibrant distinction.
Monochrome: Grayscale shades for minimalistic charts.
Heatmap: Red-to-blue spectrum to highlight "hot" (volatile) vs. "cool" (stable) areas.
Crossover Signals: Triangle markers (up for bullish, down for bearish) when the shortest EMA crosses the longest; sizes from Tiny to Huge.
Display Options: Toggle EMA lines on/off, adjust cloud transparency (0-100%), and enable alerts for crossovers.
Alerts: Notifications for "Bullish EMA Crossover" (EMA1 > EMA7) and "Bearish EMA Crossover" (EMA1 < EMA7).
How It Works
EMA Calculations: Each EMA is computed using ta.ema(close, period), with periods based on Fibonacci sequences for natural market rhythm alignment.
Clouds: Filled via fill() between plot pairs, with colors derived from the selected mode and transparency applied.
Signals: Detected with ta.crossover(ema1, ema7) and ta.crossunder(ema1, ema7), plotted as shapes with mode-specific colors (e.g., green/lime for bull, red for bear).
Customization: Inputs grouped into EMA Settings (periods), Display Settings (visibility, colors, transparency), and Signal Settings (size).
Customization Options
EMA Periods: Individually adjustable (defaults: 8, 13, 21, 34, 55, 89, 144).
Show EMAs: Toggle to hide lines and focus on clouds.
Cloud Transparency: 0% for solid fills, 100% for invisible (default 80%).
Color Mode: Switch between Classic, Monochrome, or Heatmap.
Signal Size: Tiny, Small, Normal, Large, or Huge for crossover markers.
Ideal Use Case
Suited for swing or trend-following on any timeframe (e.g., 15m-1h for intraday, daily for swings) and assets (stocks, forex, crypto, futures). Enter long on bullish crossovers above aligned clouds; exit on bearish signals or cloud widenings. Use Monochrome for clean charts or Heatmap for volatility emphasis. Combine with volume or RSI for confirmation.
Why It's Valuable
By expanding Ripster's EMA cloud idea with multi-mode visuals and integrated signals, this indicator provides a versatile, at-a-glance tool for trend assessment—reducing noise while highlighting key shifts. It's more adaptive than basic MA ribbons, with Fibonacci periods adding a layer of harmonic analysis.
Note: Test on historical data or demo accounts. Not financial advice—incorporate risk management. Optimized for Pine Script v5; some features may vary on non-overlay charts.

TMA Lock - Triple Moving Averages with Timeframe ControlKeep your 50, 100, and 200-day moving averages consistent across all chart timeframes! No more recalculating MAs when switching from daily to hourly charts.
Key Features:
Timeframe Lock - MAs stay true to your selected timeframe (daily, weekly, etc.) regardless of chart view
Fully Customizable - Adjust periods, colors, line styles, and smoothing strength

Auto-Calculated Pivot Line/Zone (Based on Time Range)Automatically Calculated Pivot Line/Zone
Harness the power of precision with this Custom Time Range Average Line indicator—designed to pinpoint key equilibrium and pivot levels within consolidation zones after a breakout. Select any start and end time to capture the critical price action shaping the market structure between swings, and calculate the true average price using your choice of open, close, high, low, or midpoint.
Once the defined period concludes, the indicator freezes the average and extends it forward as a clear horizontal ray, acting as a powerful reference for fair value and market balance. This dynamic line shines brightest within consolidation phases, helping traders identify pivot points and equilibrium zones that often serve as magnets for price after a breakout.
Customize the line width to suit your style—use a thinner line width input for a precise single average line, or increase the width to visually represent a broader range or zone. Fully adjustable line color and thickness options ensure this tool integrates seamlessly into any chart setup.
Elevate your trading edge by visualizing the hidden balance points between market swings—turning consolidation chaos into clear, strategic opportunities!

MACD + 1m EMA Zone FilterFeature Description
Run on Any Chart Works on any timeframe — 5m, 15m, 1h, etc.
MACD Crosses Detected on the current chart's timeframe
EMA Logic All EMA20/50/100/200 come from 1-minute timeframe
Buy Signal MACD crossover + all EMAs (1m) above EMA200
Sell Signal MACD crossunder + all EMAs (1m) below EMA200
Chart Arrows BUY/SELL arrows plotted at each signal
Alerts Configurable alerts for Buy/Sell conditions

STMD Indicator PROThe STMD Indicator PRO is designed for traders looking to capture strong trends using moving average alignment and the powerful Elephant Bar pattern, popularized by Oliver Velez.
📋 How it works?
✔ Simple Moving Averages:
SMA 8 (Black)
SMA 13 (Purple)
SMA 20 (Blue)
SMA 200 (Red, optional filter)
✔ Signal conditions:
All SMAs aligned and trending in the same direction
Price near the short-term SMAs
A strong candle (Elephant Bar) with a big body and small opposite wick
Signal only on the first or second consecutive candle of the same color
✅ Features
✔ Background color showing trend bias
✔ Alerts ready: STMD Buy and STMD Sell
✔ Optional SMA 200 filter for higher timeframe confirmation
📌 Disclaimer: This script is for educational purposes only. Not financial advice.

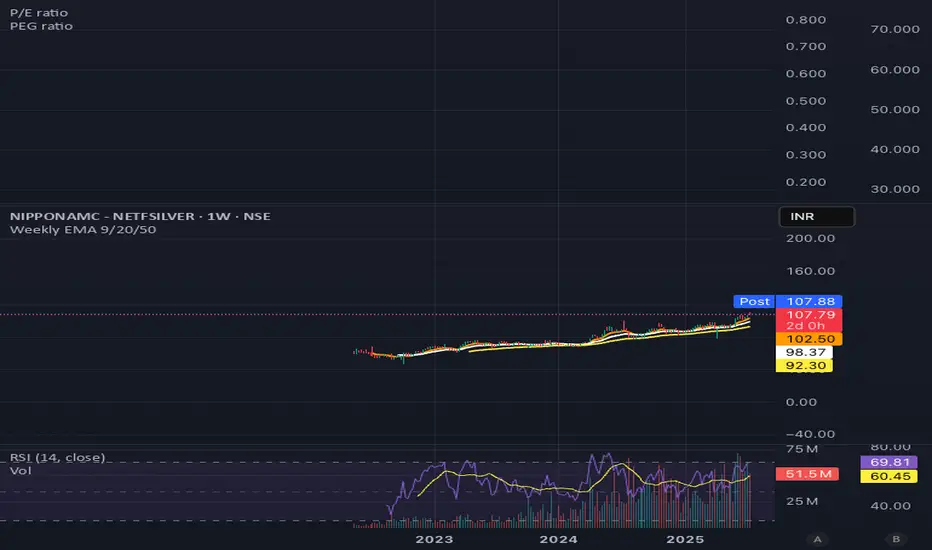
Weekly EMA 9/20/50Weekly EMA for 9, 20 and 50 weeks for any security.
This will show the trends that are otherwise not visible on the daily chart.
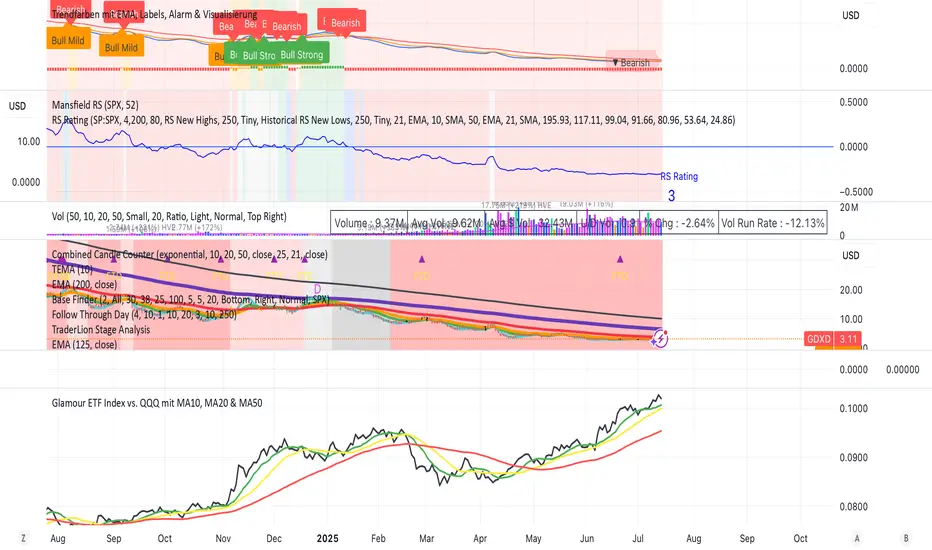
Glamour ETF Index vs. QQQ mit MA10, MA20 & MA50Stan Weinstein uses the term "Glamour Index" as a sentiment indicator to assess how speculative or overheated the stock market is. The Glamour Index measures the relationship between so-called "glamour stocks" (trendy stocks, hyped stocks with high media attention and sometimes extreme price increases) and solid, more conservative stocks. Weinstein uses this index to: 1) Analyze market sentiment – particularly whether the market is in a speculative euphoria phase.
2) Identify warning signs of a potential top formation or an impending downturn.
My basket compares performance against the QQQ (alternatively, SPY or any other benchmark is also possible).
My basket consists of the ETFs in the ARK universe, as well as other growth ETFs such as IPO, FFTY, and QQQJ.
TeeLek-HedgingLineIf we are DCA some assets and it happens to be in a downtrend, sitting and waiting is the best way, but it is not easy to do. There are other ways that allow us to buy DCA and keep collecting more. While the market is falling, don't be depressed. The more you buy, the more it drops. Should you continue buying? Plus, if it goes back to an uptrend, you will also get extra profit. Let's go check it out.
ถ้าเรา DCA ทรัพย์สินอะไรซักอย่างนึงอยู่ แล้วมันดันเป็นขาลงพอดี จะนั่งรอเฉยๆ เป็นวิธีที่ดีที่สุด แต่ไม่ได้ทำกันได้ง่ายๆ นะ ยังมีวิธีอื่นอีก ที่ให้เราสามารถ ซื้อ DCA เก็บของเพิ่มได้เรื่อยๆ ระหว่างที่ตลาดร่วง ไม่จิตตก ยิ่งซื้อ ยิ่งลง จะซื้อต่อดีไหม? แถมถ้า กลับมาเป็นขาขึ้น ยังมีกำไรแถมให้ด้วยนะ ไปหาดูกัน

Multi-Timeframe EMAs & WMAsMulti-Timeframe EMAs & WMAs (MTF EMAWMA)
The Multi-Timeframe EMAs & WMAs (MTF EMAWMA) indicator is a comprehensive tool designed to provide a multi-dimensional view of market trends by plotting various Exponential Moving Averages (EMAs) and Weighted Moving Averages (WMAs) from different timeframes onto your current chart. This allows traders to quickly assess confluent support and resistance levels, identify trend strength, and gain a broader market perspective without switching timeframes.
Key Features:
Multiple EMAs and WMAs:
This indicator includes:
- EMA 200: Plotted from H1 and M15 timeframes.
- EMA 100: Plotted from H1, M30, and M15 timeframes.
- EMA 50: Plotted from H4, H1, M30, and M15 timeframes.
- WMA 720: Plotted from H4, H1, M30, M15, and M1 timeframes.
Multi-Timeframe Analysis: By displaying moving averages from various timeframes, the indicator helps in understanding the interplay of different trends and their potential impact on price action.
Visual Distinction : Each moving average type and its timeframe representation are color-coded and styled (solid vs. dashed lines) for easy identification and clarity on the chart.
EMA 200: Dark Red
EMA 100: Cyan/Teal
EMA 50: SaddleBrown
WMA 720: Orange
Recommended Usage:
This indicator is specifically tailored for XAU/USD (Gold). It is intended to be used as a confluence tool to complement your existing trading strategies and indicators. It is not designed to be used solely as an entry or exit signal. Instead, leverage the information provided by these multi-timeframe moving averages to:
- Identify major trend directions: Observe the alignment and slope of longer-term moving averages.
- Spot potential support and resistance zones: Price often reacts to these key moving average levels from higher timeframes.
- Confirm trade bias: Use the higher timeframe moving averages to confirm the direction of your trades on lower timeframes.
- Enhance risk management: Understand where strong levels might exist to place stop-losses or take-profits.
Always combine this indicator with other forms of analysis, such as price action, chart patterns, volume analysis, or other technical indicators, to make informed trading decisions.
Remark: The script and description were created by AI.

StockMarketWolf 9/20 EMA VWAP MACD StrategyThis strategy is all about catching momentum in the market by combining some of the most trusted technical indicators—moving averages, VWAP, and MACD—to help you spot better trade opportunities with more confidence.
Here’s the simple idea:
Use the 9 and 20 EMA crossover to spot when the short-term trend is turning up or down.
Check that the price is trading above or below the VWAP (the average price weighted by volume for the day) to confirm the overall market sentiment.
Use the MACD to make sure momentum is supporting your trade—no point jumping in if momentum isn’t backing it up.
How it works:
Go long when the 9 EMA crosses above the 20 EMA, price is above VWAP, and MACD is signaling positive momentum.
Go short when the 9 EMA crosses below the 20 EMA, price is below VWAP, and MACD shows bearish momentum.
Exit the trade when these signals flip or momentum fades.
Why it’s useful:
It helps you avoid trading against the trend by using the VWAP filter.
The MACD momentum check cuts down on fake breakouts.
It’s straightforward and works well on popular day trading charts like the 5-minute timeframe.
Great for high-volume stocks and futures like SPY, QQQ, or ES futures.
Things to keep in mind:
It doesn’t throw out signals all day — you get quality over quantity.
Like any strategy, it’s not perfect and can struggle during sideways markets.
Sticking to the rules and having patience is key.
All in all, this is a solid, no-nonsense strategy that mixes trend and momentum in a way that makes trading feel a bit more clear and less noisy. Perfect if you want a systematic approach without overcomplicating things.

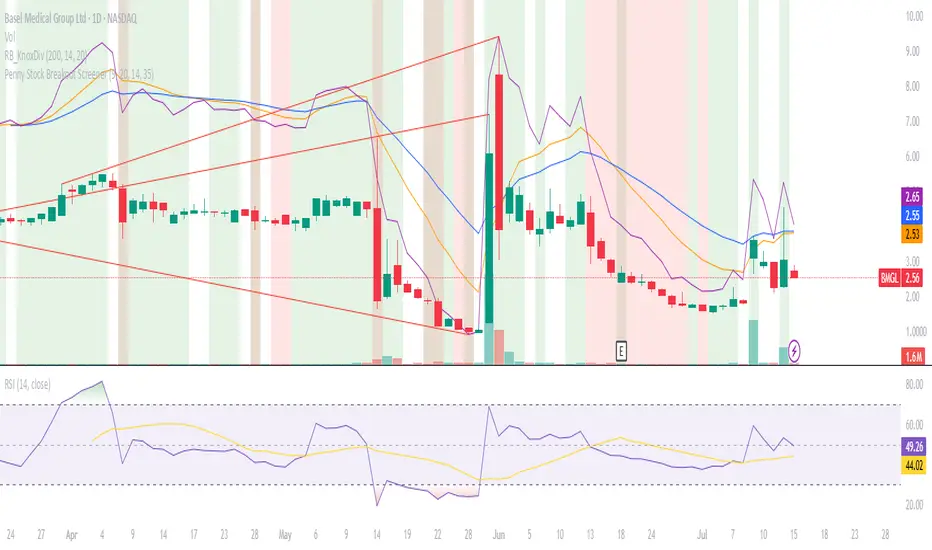
Penny Stock Breakout ScreenerLive Conditions Your Script Is Monitoring:
🔵 Bullish (Green Background = Entry Opportunity):
Breakout Pivot High
✅ Trigger: Price is breaking above the highest close of the last 20 candles (shows momentum).
🔔 Alert: "Price breaking above recent pivot high!"
Price Above VWAP
✅ Trigger: Price is currently above the VWAP (shows buyers are in control).
🔔 Alert: "Price is above VWAP - bullish control!"
EMA 9 > EMA 20 Crossover
✅ Trigger: 9-period EMA crosses above 20 EMA (trend shifting bullish).
🔔 Alert: "EMA9 has crossed above EMA20"
RSI Recovery
✅ Trigger: RSI (14) crosses above 35, indicating a bounce from oversold.
🔔 Alert: "RSI is rising from oversold - bounce incoming"
Volume Spike
✅ Trigger: Current volume is 1.5x greater than 20-day average (buying interest).
🔔 Alert: "Volume > 1.5x 20-day avg - possible breakout"
3 EMA Indicator3 EMA Indicator Description
The 3 EMA Indicator is a customizable TradingView indicator designed to plot three Exponential Moving Averages (EMAs) on a price chart. It helps traders analyze trends, identify potential trading signals, and monitor price momentum through the interaction of three EMAs with user-defined periods.
Features
Three EMAs: Displays three EMAs with default periods of 9, 21, and 50, which can be adjusted via input settings.
Customizable Parameters:
Source: Choose the price data (e.g., close, open, hlc3) for EMA calculations (default: close).
EMA Periods: Set custom lengths for each EMA (minimum 1).
Colors: Assign unique colors to each EMA for clear visualization (default: red, blue, green).
Line Width: Adjust the thickness of EMA lines (default: 2).
Dynamic Label: A label on the last bar displays the configured EMA periods (e.g., "EMA1: 9, EMA2: 21, EMA3: 50") for easy reference.
Overlay: Plots directly on the price chart, making it intuitive to compare EMAs with price action.
Usage
Trend Analysis: Use the relative positions of the EMAs to identify bullish (e.g., shorter EMA above longer EMA) or bearish trends.
Crossover Signals: Monitor EMA crossovers (e.g., 9-period EMA crossing above the 21-period EMA) for potential buy or sell signals.
Customization: Adjust periods, colors, and line width through the indicator’s settings to match your trading strategy.
How to Apply
Open TradingView’s Pine Editor.
Copy and paste the indicator’s Pine Script code.
Add the indicator to your chart.
Customize settings (periods, source, colors, line width) via the indicator’s input panel.
This indicator is ideal for traders seeking a simple yet flexible tool to track price trends and momentum using multiple EMAs.
Multi-Timeframe 200 SMAs (2m, 5m, 10m, 1H, 1D)Intraday 200 SMA Multi-Timeframe Overlay
This indicator displays the 200-period Simple Moving Averages (SMA) from the 2-minute, 5-minute, 10-minute, 1-hour, and 1-day timeframes on any chart — providing powerful multi-timeframe context for intraday trading.
Each moving average is color-coded and labeled for quick reference, helping traders identify dynamic support and resistance levels across key timeframes without needing to switch charts. Designed specifically for day traders, this tool enhances situational awareness and assists in aligning trades with broader trend direction.
Features:
2-minute 200 SMA (Yellow)
5-minute 200 SMA (Light Orange)
10-minute 200 SMA (Dark Orange)
1-hour 200 SMA (Red)
1-day 200 SMA (Purple)
Displayed on any intraday chart
Clean line styles with optional labels for timeframe reference
Perfect for scalpers and intraday swing traders who rely on higher timeframe moving averages for confluence and trade validation.
