PTSEPTSE Indicator Overview
Core Functionality:
PTSE (Price Trend Strength Evaluator) is a multi-level trend assessment tool that dynamically visualizes Exponential Moving Averages (EMAs) based on price position. It assigns a "strength level" (1-6) reflecting the trend's momentum and selectively displays relevant EMAs to reduce chart clutter.
Who Should Use PTSE & Why?
Trend Traders: Ideal for swing/position traders using EMAs to gauge trend strength.
Price-Action Analysts: Helps confirm trend stages (early/mature) via EMA clusters.
Inverse Market Traders: Optional invertLogic adapts the tool for bearish/short-selling strategies.
Key Use Cases:
Identify trend acceleration/deceleration.
Spot potential reversals when levels drop.
Simplify multi-EMA analysis.
Advantages & Disadvantages
Pros Cons
▶ Reduces visual noise (auto-hides non-relevant EMAs) ▶ Lagging (EMA-based) – less effective in sideways markets.
▶ Objective trend-strength quantification (Levels 1-6) ▶ Whipsaws during volatile price action.
▶ Customizable labels for readability ▶ Does not predict reversals; confirms existing trends.
Complementary Indicators
Combine PTSE with:
RSI/MACD: Validate overbought/oversold conditions.
Volume Oscillators: Confirm breakout strength at key levels.
Support/Resistance Lines: Identify confluence at PTSE level transitions.
How PTSE Works
Core Mechanics:
EMA Tiers: Tracks 12, 24, 50, 100, and 200-period EMAs.
Level Logic:
Level 1 → 6: Price must hold above/below* sequential EMAs (e.g., Level 3 = price > 50 EMA + lower EMAs).
invertLogic=true flips rules for bearish trends.
EMA Visibility: Only EMAs qualifying for the current level appear (e.g., Level 4 shows 12, 24, 50, 100 EMAs).
When to Use:
Level 1-2: Early trend – monitor for potential entry.
Level 4-5: Strong trend – ride momentum.
Level Drops: Warning of weakening trend (e.g., Level 5 → 4).
Level Interpretation
Level Meaning Visible EMAs
1 Weak trend (price near fastest EMA) 12-EMA only
2-3 Developing trend 12, 24, (50 for L3)
4-5 Strong trend 12, 24, 50, 100
6 Extremely strong trend All EMAs (12-200)
EMA Visibility Rules:
Visible: EMA is active for the current level (e.g., Level 3 shows 12/24/50 EMAs).
Hidden: EMA not relevant to the current strength level (e.g., 100/200 EMAs hidden at Level 3).
Practical Usage
Setup: Apply to chart; toggle invertLogic for bearish markets.
Entry/Exit Signals:
Long: Level rises (e.g., 2 → 3) + price above visible EMAs.
Exit/Short: Level drops (e.g., 4 → 3) + price breaks key EMA.
Label Tracking: Position the level label (e.g., "Top Right") to monitor strength without distractions.
Key Insight
PTSE transforms traditional EMA analysis into a phased trend-strength system. By dynamically hiding "irrelevant" EMAs, it emphasizes price position within the trend structure, allowing traders to focus on high-probability momentum shifts. Always combine with volume/price-action confirmation for optimal results.
Moving Averages

ORB Screener-Multiple IndicatorsThis custom screener is designed to identify high-probability intraday breakout opportunities across the top 40 NSE stocks by market capitalization. It is built on the proven Opening Range Breakout (ORB) concept and enhanced with a powerful combination of momentum and trend filters.
✅ Key Features:
Opening Range (09:15–09:20) detection with automatic status: Abv High, Blw Low, BTW
Real-time scanning of 40 pre-loaded NSE stocks (configurable)
Composite scoring system (0–100) based on:
RSI > 55
Price above VWAP
Volume Surge (vs 20-period SMA)
ADX > 20
MACD Histogram (positive and rising)
ORB Breakout Direction
Color-coded screener table to highlight top-scoring stocks
Buy/Sell suggestions shown alongside score
Manual sorting toggle for ranked display
Fully customizable watchlist with checkboxes
🛠️ Best Use:
Ideal for intraday traders looking for momentum trades.
Focus on stocks with score ≥ 75 and green highlight for long trades.
Designed to be lightweight despite scanning 40 instruments.
⚠️ Notes:
This script does not plot on the chart; it only renders a dynamic screener table.
No alerts are configured—manual review required.
You can edit the top 40 symbols as needed.

YZH super wma modelYZH Super WMA Model
Overview
The "YZH Super WMA Model" is a customizable technical analysis indicator built in Pine Script v5 for TradingView. It generates trading signals using three configurable moving averages (MA1, MA2, MA3) and a wick-based filter to enhance signal accuracy. The indicator is overlaid on the price chart and supports multiple MA types: SMA, EMA, WMA, HMA, RMA, and VWMA.
Features
Flexible Moving Averages:
Three MAs (MA1, MA2, MA3) with customizable types and periods.
Default settings: MA1 (50-period SMA), MA2 (200-period HMA), MA3 (100-period EMA).
Adjustable visibility, colors, and line widths.
Wick-Based Filter:
Uses a wick ratio threshold (default: 0.5) to filter signals based on candle wick size.
Enhances signal reliability by focusing on significant wick patterns.
Signal and Trend Logic:
Signal MA (default: MA1) generates entry signals; trend MA (default: MA2) filters trend direction.
Long signals: Price crosses above signal MA, closes above trend MA, with sufficient lower wick.
Short signals: Price crosses below signal MA, closes below trend MA, with sufficient upper wick.
Signals confirmed within a user-defined bar range (default: 5).
Visualization:
Long signals: Green upward triangles below bars, labeled "L".
Short signals: Red downward triangles above bars, labeled "S".
Optional setup points and information table for enhanced analysis.
Alerts:
Triggers alerts on confirmed signals with detailed messages including signal type, MA settings, and price.
Recommended Settings
SMA20-SMA200: For swing trading, capturing short-term vs. long-term trends.
SMA50-HMA200: For trend-following, balancing medium-term signals with smooth long-term trends.
WMA48-WMA200: For volatile markets, emphasizing recent price action.
WMA174-SMA200: For higher time frame (HTF) trend following, ideal for long-term analysis.
Use Cases
Trend following, reversal trading, and customizable strategies.
Suitable for various markets (stocks, forex, crypto) and timeframes.
How to Use
Add to TradingView chart.
Configure MA types, periods, and colors.
Adjust wick threshold and trigger bars.
Enable visualizations and alerts as needed.
Conclusion
The "YZH Super WMA Model" is a robust tool for traders seeking reliable, customizable signals. Backtest the recommended settings to optimize for your market and timeframe.

TrendWave Pro EMATrendWave Pro EMA is your ultimate all-in-one trend trading toolkit! 🛠️ Designed for clarity and power, this indicator provides crystal-clear buy & sell signals, advanced confirmation tools, and rock-solid risk management features. It’s built around a dynamic EMA channel and a powerful ATR algorithm to help you catch and ride market trends like a pro.
If you're looking for a single indicator to define trends, generate entry signals, spot choppy markets, and manage trades with a visual Stop Loss system, your search is over.
📈 Recommended Timeframe: For peak performance and accuracy, use this indicator on 15-minute timeframes or higher (e.g., 1-hour, 4-hour).
⚙️ How It Works: Core Components
This indicator combines several powerful modules into one seamless trading system.
1. EMA Trend Band (The "TrendWave") 🌊
This is the engine of the indicator. It features a 100-period EMA of the close, hugged by an upper band (from the high) and a lower band (from the low).
🔵 Blue Midline: Signals a potential uptrend or bullish momentum.
🔴 Red Midline: Signals a potential downtrend or bearish momentum.
⚪ Gray Midline: Suggests a consolidating or neutral market.
The vibrant fill between the bands gives you an instant read on the current trend.
2. ATR-Based Buy & Sell Signals 🎯
The "Buy" and "Sell" labels are powered by a smart Chandelier Exit logic using the Average True Range (ATR). This is designed to capture momentum while filtering out distracting market noise.
🟢 Buy Signal: Appears when the price shows strong upward thrust and breaks above the calculated trailing stop.
🔴 Sell Signal: Appears when the price shows strong downward pressure and breaks below the calculated trailing stop.
3. Visual Stop Loss System 🛡️
Risk management made easy! This critical feature plots your stop loss directly on the chart, activating automatically with every new signal. Choose your style:
💰 Fixed Amount: Set a precise price distance for your SL (e.g., $3.11).
📊 Percentage: Use a percentage of your entry price (e.g., 2%).
📈 ATR Trailing: A dynamic trailing stop that follows the price to lock in profits. It moves up in an uptrend and down in a downtrend, but never against you!
💎 Additional Confirmation Tools
To boost your confidence and trade accuracy, TrendWave Pro EMA comes packed with optional tools:
🔗 Three Customizable Moving Averages: Add up to three of your favorite MAs (EMA, SMA, WMA, etc.) for extra confluence.
🛰️ Super SSL Channel: A secondary trend-following channel. A green line confirms bullish sentiment, while a red line confirms bearish control.
😴 Range Detector: This unique tool automatically highlights boring, sideways markets. Avoid trading when the price is trapped in the green "no-trade" zone! The box flips blue on a bullish breakout and red on a bearish one.
🕯️ Price Action Candlesticks: Get extra confirmation by automatically detecting key patterns:
Pin Bars: 🔵 for bullish, 🔴 for bearish
Shaved Bars: 💧 for bullish, 🌺 for bearish
Inside Bars: 🟡
Outside Bars: 🟠
📖 How to Use
Identify the Main Trend: Use the color of the EMA Trend Band and the Super SSL Channel to see the big picture.
Wait for a Signal: Look for a "Buy" signal in an uptrend or a "Sell" signal in a downtrend.
Seek Confirmation: For A+ setups, look for confirming factors like a bounce from an MA or a strong candlestick pattern.
Avoid Ranging Markets: See the green Range Detector box? That's a sign to sit on your hands and wait for a clear breakout.
Manage Your Risk: Use the Visual Stop Loss line that appears with your signal. Set it and forget it!
👋 Feedback and Suggestions
This indicator is always evolving. For any feedback, questions, or cool ideas, hit me up on Telegram: @Nisar847

Contrarian with 5 Levels5 Levels application was inspired and adapted from Predictive Ranges indicator developed by Lux Algo. So much credit to their work.
Indicator Description: Contrarian with 5 Levels
Overview
The "Contrarian with 5 Levels" indicator is a powerful tool designed for traders seeking to identify potential reversal points in the market by combining contrarian trading principles with dynamic support and resistance levels. This indicator overlays a Simple Moving Average (SMA) shadow and five adaptive price levels, integrating Institutional Concepts of Structure (ICT) such as Break of Structure (BOS) and Market Structure Shift (MSS) to provide clear buy and sell signals. It is ideal for traders looking to capitalize on overextended price movements, particularly on the daily timeframe, though it is adaptable to other timeframes with proper testing.
How It Works
The indicator operates on two core components:
Contrarian SMA Shadow: A shaded region between the SMA of highs and lows (default length: 100) acts as a dynamic zone to identify overbought or oversold conditions. When the price moves significantly outside this shadow, it signals potential exhaustion, aligning with contrarian trading principles.
Five Adaptive Levels: Using a modified ATR-based calculation, the indicator plots five key levels (two resistance, one average, and two support) that adjust dynamically to market volatility. These levels serve as critical zones for potential reversals.
ICT Structure Analysis: The indicator incorporates BOS and MSS logic to detect shifts in market structure, plotting bullish and bearish breaks with customizable colors for clarity.
Buy and sell signals are generated when the price crosses key levels while outside the SMA shadow, indicating potential reversal opportunities. The signals are visualized as small circles above (sell) or below (buy) the price bars, making them easy to interpret.
Mathematical Concepts
SMA Shadow: The indicator calculates the SMA of the highest highs and lowest lows over a user-defined period (default: 100). This creates a dynamic range that highlights extreme price movements, which contrarian traders often target for reversals.
Five Levels Calculation: The five levels are derived using a volatility-adjusted formula based on the Average True Range (ATR). The average level (central pivot) is calculated as a smoothed price, with two upper (resistance) and two lower (support) levels offset by a multiple of the ATR (default multiplier: 6.0). This adaptive approach ensures the levels remain relevant across varying market conditions.
ICT BOS/MSS Logic: The indicator identifies pivot highs and lows on a user-defined timeframe (default: daily) to detect structural breaks. A BOS occurs when the price breaks a prior pivot high (bullish) or low (bearish), while an MSS signals a shift in market direction, providing context for potential reversals.
Entry and Exit Rules
Buy Signal (Blue Dot Below Bar): Triggered when the closing price is below both the SMA shadow (smaLow) and the average level (avg), and the price crosses under either the first or second support level (prS1 or prS2). This suggests the market may be oversold, indicating a potential reversal upward.
Sell Signal (White Dot Above Bar): Triggered when the closing price is above both the SMA shadow (smaHigh) and the average level (avg), and the price crosses over either the first or second resistance level (prR1 or prR2). This suggests the market may be overbought, indicating a potential reversal downward.
Recommended Usage
This indicator is optimized for the daily timeframe, where it has been designed to capture significant reversal opportunities in trending or ranging markets. However, it can be adapted to other timeframes (e.g., 1H, 4H, 15M) with proper testing of settings such as SMA length, ATR multiplier, and structure timeframe. Users are encouraged to backtest and optimize parameters to suit their trading style and asset class.
Customization Options
SMA Length: Adjust the SMA period (default: 100) to control the sensitivity of the shadow.
Five Levels Length and Multiplier: Modify the length (default: 200) and ATR multiplier (default: 6.0) to fine-tune the support/resistance levels.
Timeframe Settings: Set separate timeframes for structure analysis and five levels to align with your trading strategy.
Color and Signal Display: Customize colors for BOS/MSS lines and toggle buy/sell signals on or off for a cleaner chart.
Why Use This Indicator?
The "Contrarian with 5 Levels" indicator combines the power of contrarian trading with dynamic levels and market structure analysis, offering a unique perspective for identifying high-probability reversal setups. Its intuitive design, customizable settings, and clear signal visualization make it suitable for both novice and experienced traders. Whether you're trading forex, stocks, or cryptocurrencies, this indicator provides a robust framework for spotting potential turning points in the market.
We hope you find the "Contrarian with 5 Levels" indicator a valuable addition to your trading toolkit! Happy trading!
Please leave feedback in the comments section.

Scanner Candles v2.01The "Scanner Candle v.2.01" is an indicator classifies candles based on the body/range ratio: indecisive (small body, ≤50%), decisive (medium body), explosive (large body, ≥70%). It includes EMAs to identify trends and "Reset Candles" (RC), small-bodied candles near EMAs, signaling potential reversals or continuations. Useful for analyzing volatility, breakouts, reversals, and risk management.
Description of the indicator:
The "Scanner Candle v.2.01" indicator classifies candles into three categories based on the proportion of the candle's body to its range (high-low):
Indecisive: candles with a small body (≤ set threshold, default 50%), indicating low volatility or market uncertainty.
Decisive: candles with a medium body, reflecting a clear but not extreme price movement.
Explosive: candles with a large body (≥ set threshold, default 70%), signaling strong directional moves.
Additionally, the indicator includes:
Customizable exponential moving averages (EMAs) to identify trends and support/resistance levels.
Detection of "Reset Candles" (RC), specific candles (e.g., dojis, ) with a small bodies body near EMAs, useful for identifying potential reversal or continuation points.
Coloring and visualization:
Candles are colored by category (white for indecisive, orange for decisive, purple for explosive).
Reset Candles are marked with circles above/below the candle (green for bullish, red for bearish).
Potential uses:
Volatility analysis: Identifying uncertain (indecisive), directional (decisive), or impulsive (explosive) market phases.
Breakout trading: Explosive candles can signal entry opportunities on strong moves.
Reversal detection: Reset Candles near EMAs can indicate turning points or trend continuation.
Trend-following support: Integrated EMAs contextualize candles within the main trend.
Risk management: Indecisive candles suggest avoiding trades in low-directionality phases.
The indicator is customizable (thresholds, colors, thresholdsEMAs, ) and adaptable to various timeframes and strategies, from day trading to swing trading.
Reset Candles:
Reset Candles (RC) are specific candles signaling potential reversals or continuations, often near EMAs. They are defined by:
Small body: Body < 5% of the range of the last 10 candles, indicating low volatility (e.g., doji).
EMA proximity: The candle is near or crosses a defined EMA (e.g., 10, 60, or 223 periods).
Trend conditions: Follows a red candle, with the close of the previous previous candles above a specific EMA, suggesting a potential bullish resumption or stabilization.
Limited spike: The candle has minimal tails (spikes, ) below a set threshold (default 1%).
Minimum timeframe: Appears on timeframes ≥ set value (default 5 minutes) or daily charts.
Non-consecutive: Not preceded by other RCs in the last 3 candles.
Types:
Doji_fin: Green circle above, signaling a bullish bullish setup near longer EMAs.
Dojifin_2: Yellow Red circle below, signaling a bearish setup near shorter EMAs.
Trading uses:
Reversal: RCs near EMAs signal bounces or rejections, ideal for counter-trend trades.
Continuation: In trends, RCs indicate pauses before trend resumption, offering low-risk entries.
Support/resistance confirmation: EMA proximity strengthens the level's significance.
Risk management: Small bodies and EMA proximity allow tight stop-losses.
Limitations:
False signals: Common in volatile or sideways markets; use with additional confirmation.
Timeframe dependency: More reliable on higher timeframes (e.g., 1-hour or daily).
Customization needed: Thresholds (e.g., spike, timeframe) must be tailored to the market.
Conclusion:
Reset Candles highlight low-volatility moments near technical levels (EMAs) that may precede significant moves. They are ideal for precise entries with tight stops in reversal or continuation strategies but require clear market context and additional confirmation for optimal effectiveness.
#ema #candlepattern #scalping

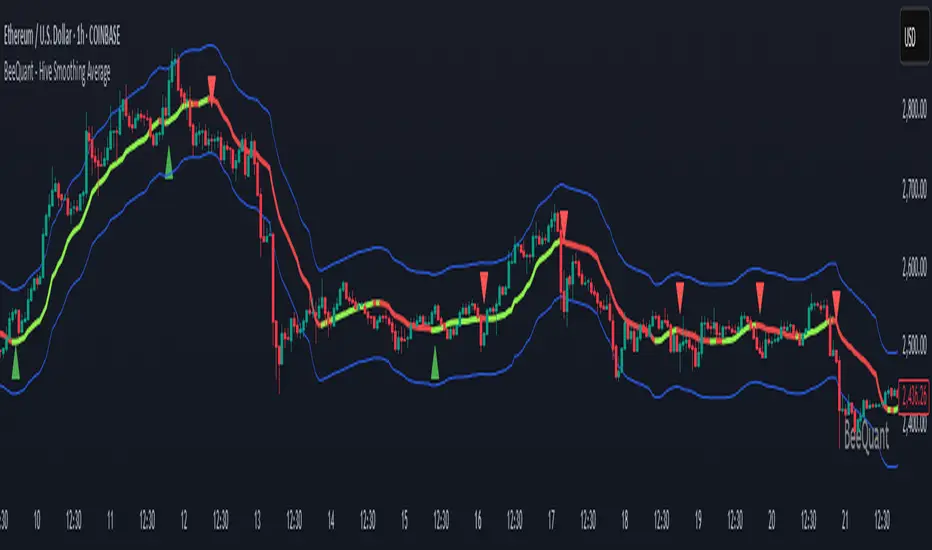
BeeQuant - Hive Smoothing Average🔶 OVERVIEW
The "Hive Smoothing Average" is your gateway to crystal-clear market insights, a truly advanced tool that cuts through confusing price "noise" to reveal the true underlying trend. Imagine having a panoramic view of the market's true direction, unclouded by minor ups and downs. This powerful indicator dynamically filters out market distractions, presenting you with a highly refined line that not only shows you the genuine path of price but also changes color. It’s built for traders who demand clarity and want to confidently spot opportunities that others might miss in messy charts.
__________________________________________________________________________
🧠 CONCEPTS
At its heart, the "Hive Smoothing Average" employs a sophisticated multi-stage processing system to transform raw price data into an incredibly smooth and responsive smoothed moving average line. It's designed to give you an unparalleled view of market direction and momentum.
⬜ Synthesizes multiple smoothing layers to deliver a balanced representation of underlying price action.
⬜ Offers enhanced visual consistency by filtering volatility distortion without delay-based lag.
⬜ Presents color-coded transitions and signal markers to aid in directional conviction and structural flow.
⬜ Embeds a modular smoothing core adaptable across market environments and asset classes.
Hive Smoothing Average doesn't forecast, it refines. It provides a more coherent view of price evolution, allowing for higher-confidence discretion and more robust strategy overlays.
__________________________________________________________________________
✨ FEATURES
Hive Smoothing Average is loaded with flexibility and visual power to enhance your decision-making:
🔹Customizable Smoothing
Tailor the indicator’s core behavior using a wide range of smoothing algorithms — from classic to advanced — to match your trading tempo and asset dynamics.
🔹 Intelligent Color Feedback
The line color dynamically shifts to reflect meaningful trend transitions, offering at-a-glance clarity without crowding your chart.
🔹 Trend Signal Markers
Built-in arrow markers highlight potential transitions in price momentum, acting as subtle nudges to investigate further.
🔹 Multi-Timeframe Ready
Designed to operate cleanly across all timeframes, from scalping micro-trends to monitoring macro cycles.
🔹 External Source Collaboration
Hive Smoothing Average includes two flexible input channels that can seamlessly connect with other indicators on your chart.
🔹 Adaptive Bands
A powerful enhancement to the Hive framework, the optional Standard Deviation Bands add dynamic context to price behavior by highlighting how far price is moving relative to its recent average volatility.
Length: Controls the lookback period for volatility calculation.
Lower values (e.g., 20 – 50) make the bands highly reactive Higher values (e.g., 200 – 500) smooth out the bands (classic envelope systems )
These bands offer valuable visual cues for both volatility expansion and mean reversion potential, especially when combined with Hive’s core candle coloration logic.
🔹Non-Repainting Logic for Historical Reliability
Each "Hive Smoothing Average" is plotted only when its internal reconstruction conditions are fully met and confirmed. This ensures that the historical display of Hive Smoothing Average does not repaint, providing a high degree of reliability and trust in past signals and visualizations.
🔹Cross-Market Versatility
This indicator is engineered to perform with precision across all major markets—whether you're trading forex, commodities, stocks, or indices. Its adaptive logic automatically aligns with the unique volatility and structure of each asset class, delivering consistently reliable insights no matter where you trade.
__________________________________________________________________________
⚙️ USAGE
Getting started with Hive Smoothing Average is seamless and intuitive:
✨ Apply to Any Chart
Simply add the indicator to any asset or timeframe and see immediate transformation in chart clarity.
💹 Source Data Flexibility
Choose your preferred price data source for each smoothing stage (e.g., Close, Open, High, Low), providing complete control over the input feeding the sophisticated smoothing algorithms.
🛠️ Adjust Smoothing Behavior
Choose your preferred initial and final smoothing types (EMA, HMA, ALMA, etc.), and tweak lengths for desired responsiveness or smoothness.
📐 Use Bands for Confluence
Enable the Bands mode to visualize dynamic zones around your smoothed price. Useful for breakout validation and fade zones.
🟩 Green Smoother Line
Indicates strengthening bullish bias and upward progression.
🟥 Red Smoother Line
Suggests weakening or shifting trend toward bearish territory.
📈 Arrow Signals
Upward or downward triangles appear when directional bias changes — confirming subtle pivots in trend behavior.
🎯 Offset Adjustment
Fine-tune the visual positioning of the smoothed line and bands on your chart with a convenient "Offset" input.
📏 Lookback Filter
Activate the “Lookback Filter” setting to remove weaker signals based on custom historical logic. By checking recent candle behavior, it filters out low-quality transitions and only keeps strong, confirmed shifts — helping you avoid noise and stay focused on reliable breakouts.
Experiment with settings based on your trading timeframe. Short-term traders may prefer fast-reactive configurations, while swing or positional traders can explore higher-period smoothings for structural signals.
__________________________________________________________________________
⚠️ LIMITATIONS
While Hive Smoothing Average delivers incredible trend clarity, it’s essential to use it within its designed purpose:
👉 Visual Clarity, Not Trade Calls: This tool enhances visibility of market behavior, not automatic signals. Use it as a trusted lens — not a standalone system.
👉 Reactive, Not Predictive: Hive Smoothing Average responds to price action with refined smoothing. It is not a forecasting model.
👉 Config-Sensitive Output: Different smoothing setups can produce different levels of sensitivity or delay. Calibration matters — explore what fits your asset and style.
👉 Focuses on Price Action Only: It does not integrate volume, fundamentals, or external market influences. It’s engineered purely for price structure refinement.
█ ▒▒▒▒▒▒▒▒▒▒▒▒▒▒▒▒▒▒▒▒▒▒▒ 『•••• ✎ ••••』 ▒▒▒▒▒▒▒▒▒▒▒▒▒▒▒▒▒▒▒▒▒▒▒▒ █
🎯 CONCLUSION
Hive Smoothing Average provides a high-performance, low-noise framework to view price with remarkable clarity. With its adaptive smoothing layers, bands support, and intelligent signal markers, it becomes a powerful tool to enhance your trend confidence and charting efficiency. By furnishing immediate, data-driven feedback on the market's core momentum and signaling critical turning points, it profoundly empowers traders to rapidly ascertain nascent market shifts and identify pivotal directional changes. Seamlessly integrate this sophisticated visual tool within your pre-existing technical analysis architecture to acquire a sharper, more insightful perspective, and fundamentally elevate your strategic acumen, optimizing your decision-making processes to a degree previously unattainable. It's about experiencing the market's true rhythm.
▣▣▣▣▣▣▣▣▣▣▣▣▣▣▣▣▣▣▣▣▣▣▣▣▣▣▣▣▣▣▣▣▣▣▣▣▣▣▣▣▣▣▣▣▣▣▣▣▣▣▣
🚨 RISK DISCLAIMER
Engagement in financial market speculation inherently carries a substantial degree of inherent risk, and the potential for capital diminution, potentially exceeding initial deposits, is a pervasive and non-trivial consideration. All content, algorithmic tools, scripts, articles, and educational materials disseminated by "Hive Smoothing Average" are exclusively purposed for informational and pedagogical objectives, strictly for reference. Historical performance data, whether explicitly demonstrated or implicitly suggested, offers no infallible assurance or guarantee of future outcomes. Users bear sole and ultimate accountability for their individual trading decisions and are emphatically urged to meticulously assess their financial disposition, risk tolerance parameters, and conduct independent due diligence prior to engaging in any speculative market activity.
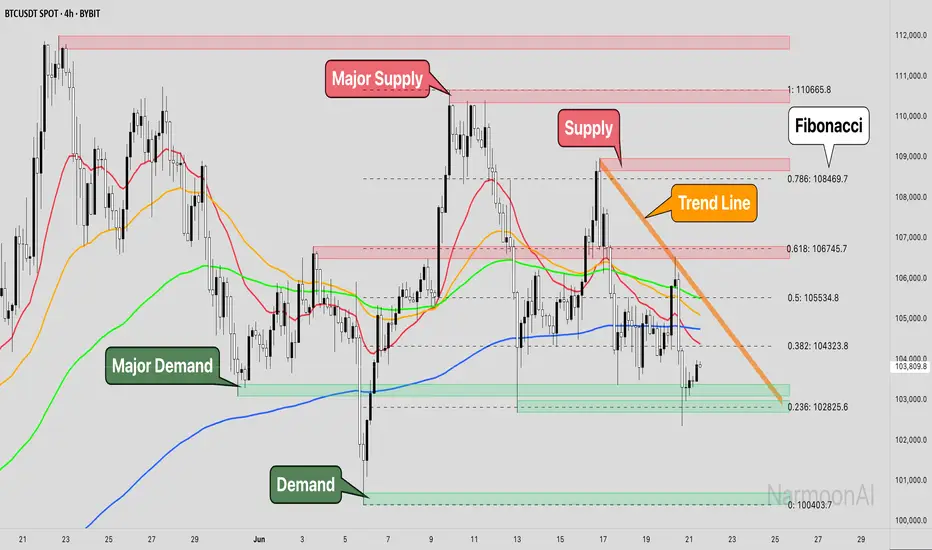
Smart Money Concepts + Fibonacci + EMA - AI Enhanced Analysis### █ OVERVIEW
This indicator is not just another "all-in-one" tool; it's a **specialized data visualization layer designed for the new era of AI-driven chart analysis**. The primary purpose of the **"NarmoonAI"** indicator is to structure and display key market information in a clean, consistent, and machine-readable format.
Standard charts can be noisy and ambiguous for AI Vision models (like Google's Gemini or OpenAI's GPT-4). This script solves that problem by consolidating the most crucial technical analysis concepts—Smart Money Concepts, Trend Analysis, and Key Levels—into a clear visual language that an AI can easily interpret from a single screenshot.
This approach allows traders to leverage the power of artificial intelligence for faster, more objective, and deeper market analysis. It's designed to work seamlessly with our custom AI assistant, the **NarmoonAI Telegram Bot**, but can be used with any modern AI vision tool.
---
### █ CORE COMPONENTS & LOGIC
This indicator is a "mashup" with a clear purpose: to create a comprehensive yet clean analytical framework. Here is how each component contributes to the overall goal of AI-enhanced analysis:
**1. Smart Money Concepts (Supply & Demand Zones):**
* **How it works:** The script automatically identifies significant market turning points by detecting swing highs and lows using `ta.pivothigh` and `ta.pivotlow` over a user-defined `Swing Length`. These pivots form the basis of our Supply (resistance) and Demand (support) zones.
* **The "Smart" Edge:** To filter out weaker zones, the indicator analyzes the volume profile. Zones that are formed during periods of high volume (defined as >1.5x the 20-period simple moving average of volume) are highlighted in a stronger, more vibrant color. This signals areas of high institutional interest, a key concept in Smart Money analysis.
**2. Multi-Layered Trend Analysis (Exponential Moving Averages - EMAs):**
* **How it works:** We've included a customizable suite of four essential EMAs (20, 50, 100, and 200). These are not just random lines; they provide an instant visual reference for short, medium, and long-term trend direction and dynamic support/resistance.
* **Why it's useful for AI:** An AI can instantly parse the order and slope of these EMAs. For example, it can identify a strong uptrend when the price is above the 20 EMA, which is above the 50 EMA, and so on.
**3. Automatic Fibonacci Retracement:**
* **How it works:** Manually drawing Fibonacci levels is subjective and time-consuming. This script automates the process by identifying the highest high and lowest low over a `Fibonacci Lookback Period` (defaulting to 100 bars) and automatically plots the key retracement levels (0.236, 0.382, 0.5, 0.618, 0.786).
* **Why it's useful for AI:** It provides objective, universally recognized potential support and resistance levels without any manual drawing, ensuring a clean and consistent chart for analysis.
**4. Dynamic Trend Channels:**
* **How it works:** The indicator automatically draws trend channels by connecting the two most recent significant pivot highs (for a downtrend channel) or pivot lows (for an uptrend channel).
* **The "Dynamic" Edge:** The width of the channel is not fixed. It's dynamically calculated using the Average True Range (ATR), allowing the channel to expand and contract based on the market's current volatility. This provides a much more adaptive and realistic view of the trend's boundaries.
---
### █ HOW TO USE THIS INDICATOR
There are two primary ways to use the NarmoonAI indicator:
**A) For AI-Powered Analysis (Recommended):**
1. Apply the **NarmoonAI** indicator to any chart.
2. Take a clean screenshot of your chart.
3. Upload the image to your preferred AI Vision model (e.g., Gemini, ChatGPT) or, for the best results, use our specialized **NarmoonAI Telegram bot**.
4. Ask the AI for a detailed analysis. **Example Prompts:**
* *"Based on this chart, what is the current market structure? Identify key support and resistance levels."*
* *"Is there a potential long setup forming according to the information from the NarmoonAI indicator?"*
* *"Summarize the trend direction and strength using the EMAs and trend channels shown."*
**B) For Manual Trading:**
Traders can use the confluence of signals for high-probability setups:
* **High-Probability Long:** Look for the price to enter a **Strong Demand Zone** that aligns with a key **Fibonacci level** (e.g., 0.618) and is respected by a major **EMA** (e.g., the 50 or 100 EMA).
* **High-Probability Short:** Look for the price to test a **Strong Supply Zone** near the top of a **descending trend channel**, with EMAs confirming the bearish momentum.
---
*This script was created by NarmoonAI to bridge the gap between traditional technical analysis and the powerful capabilities of modern artificial intelligence. We believe this is the future of trading analysis.*
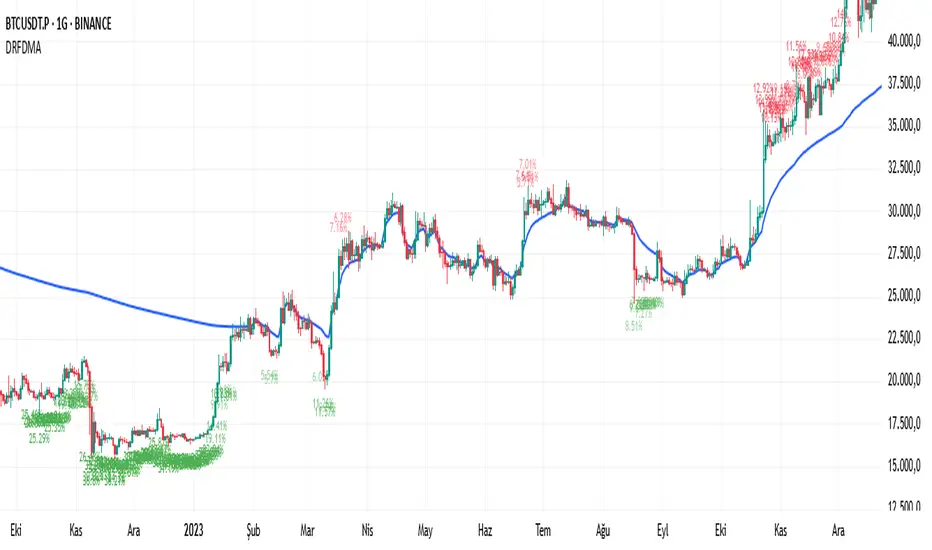
Deviation Rate From Dynamic MAThis indicator does the following; starting from the first bar (including the first bar) it calculates the average of the closings of the following bars, until the closing of a bar reaches the average. If the price has returned to the average, the starting bar for the average calculation is reset, that is, it starts calculating the average again from the bar where the return to the average (intersection) occurred.
If the deviation is greater than the entered percentage value (3% by default), it shows the deviation rate for each bar on the chart with a label. The color of the label text is shown as darker as the deviation rate increases, and more transparent as it decreases. You can change these settings according to your own preferences from the codes. You can create alarm conditions such as "If the deviation rate from the average is greater than x" to enter the transaction.
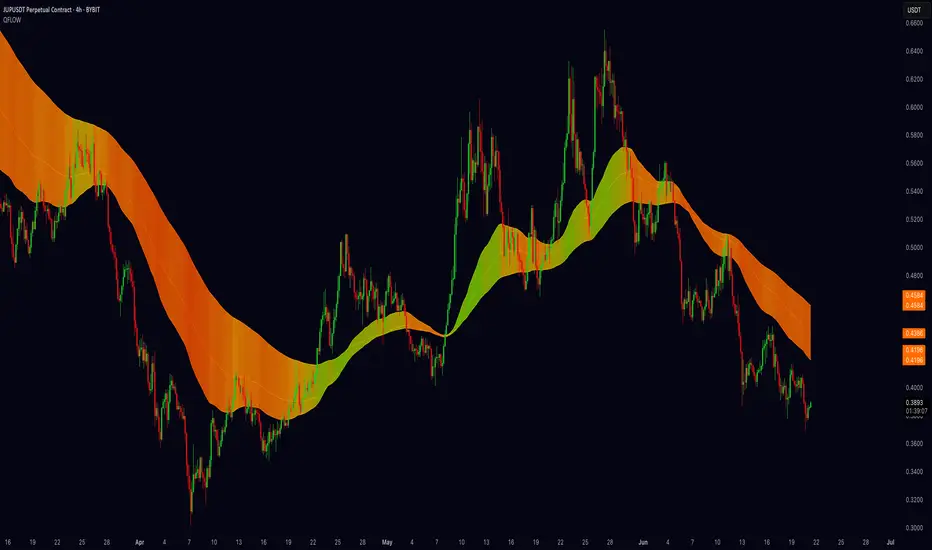
Quantum Fibonacci Flow
Quantum Fib Ribbon (QFLOW)
📖 How It Works
A three-band ribbon built from Fibonacci-scaled moving averages, filled and colored to reflect current momentum strength and direction.
Green when bullish flow is strong, red when bearish flow dominates, and orange in between to highlight slowing momentum.
⚙️ Key Controls
* Base Length: Adjusts the ribbon’s overall lookback.
* Ribbon Opacity: How solid or translucent the fill appears.
* Momentum Scale & Exponent: Fine-tune how sensitively the ribbon reacts to price speed versus volatility.
* Override Threshold: Determines at what momentum level the ribbon “snaps” to full green or red.
🚨 Over-Extension Logic
When price extends significantly above or below the ribbon, it often signals exhaustion.
The first return to the ribbon after such an extension frequently acts as strong support or resistance — offering high-probability trade setups.
🔺 Optional Trade Signals
Enable the over-extension alert to mark these key areas:
* A green triangle shows price extended below the ribbon, then retested → potential long.
* A red triangle shows price extended above, then retested → potential short.
🎯 How to Trade
• Breakout-Retest Setup: Watch for over-extended price moves. The first comeback to the ribbon often marks key levels of interest for a reversal or continuation.
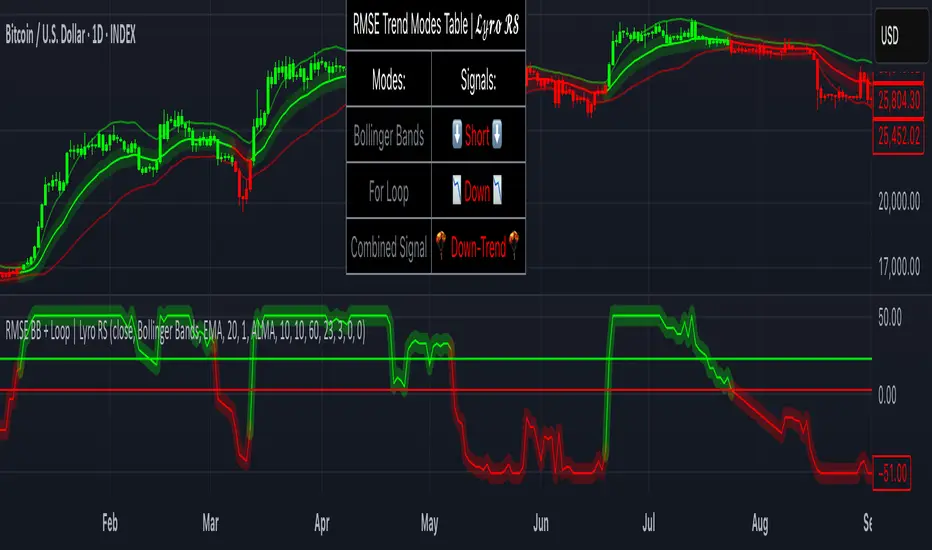
RMSE Bollinger Bands + Loop | Lyro RSRMSE Bollinger Bands + Loops
Overview
The RMSE Bollinger Bands + Loops is a sophisticated technical analysis tool designed to identify and quantify market trends by combining dynamic moving averages with statistical measures. This indicator employs a multi-model approach, integrating Bollinger-style RMSE bands, momentum scoring, and a hybrid signal system to provide traders with adaptive insights across varying market conditions.
Indicator Modes
Bollinger-style RMSE Bands: this mode calculates dynamic volatility bands around the price using the following formula:
Upper Band = Dynamic Moving Average + (RMSE × Multiplier)
Lower Band = Dynamic Moving Average - (RMSE × Multiplier)
These bands adjust to market volatility, helping identify potential breakout or breakdown points.
For-Loop Momentum Scoring, momentum is assessed by analyzing recent price behavior through a looping mechanism. A rising momentum score indicates increasing bullish strength, while a declining score suggests growing bearish momentum.
Hybrid Combined Signal: this mode assigns a directional score to the other two modes:
+1 for bullish (green)
–1 for bearish (red)
An average of these scores is computed to generate a combined signal, offering a consolidated market trend indication.
Practical Application
Signal Interpretation: A buy signal is generated when both the RMSE Bands and For-Loop Momentum Scoring align bullishly. Conversely, a sell signal is indicated when both are bearish.
Trend Confirmation: The Hybrid Combined Signal provides a consolidated view, assisting traders in confirming the prevailing market trend.
Note: Always consider additional technical analysis tools and risk management strategies when making trading decisions.
⚠️Disclaimer
This indicator is a tool for technical analysis and does not provide guaranteed results. It should be used in conjunction with other analysis methods and proper risk management practices. The creators of this indicator are not responsible for any financial decisions made based on its signals.
Cycle Composite 3.6 WeightedThe Cycle Composite is a multi-factor market cycle model designed to classify long-term market behavior into distinct phases using normalized and weighted data inputs.
It combines ten key on-chain, dominance, volatility, sentiment, and trend-following metrics into a single composite output. The goal is to provide a clearer understanding of where the market may stand in the broader cycle (e.g., accumulation, early bull, late bull, or euphoria).
This version (3.4) introduces flexible weighting, trend strength markers, and additional context-aware signals such as risk-on confirmations and altseason flags.
Phases Identified:
The model categorizes the market into one of five zones:
Euphoria (> 85)
Late Bull (70 – 85)
Mid Bull (50 – 70)
Early Bull (30 – 50)
Fear (< 30)
Each phase is determined by a smoothed EMA of the weighted composite score.
Data Sources and Metrics Used (10 total):
BTC Dominance (CRYPTOCAP:BTC.D)
Stablecoin Dominance (USDT + USDC average) (inverted for risk-on)
ETH Dominance (CRYPTOCAP:ETH.D)
BBWP (normalized Bollinger Band Width % over 1-year window)
WVF (Williams VIX Fix for volatility spike detection)
NUPL (Net Unrealized Profit/Loss, external source)
CMF (Chaikin Money Flow, smoothed volume accumulation)
CEX Open Interest (custom input from DAO / external source)
Whale Inflows (custom input from whale exchange transfer data)
Google Trends Average (BTC, Crypto, Altcoin terms)
All inputs are normalized over a 200-bar window and combined via weighted averaging, where each weight is user-configurable.
Additional Features:
Phase Labels: Labels are printed only when a new phase is entered.
Bull Continuation Marker: Triangle up when composite makes higher highs and NUPL increases.
Weakening Marker: Triangle down when composite rolls over in Late Bull and NUPL falls.
Risk-On Signal: Green circle appears when CMF and Google Trends are both rising.
Altseason Flag: Orange diamond appears when dominance of "others.d" exceeds BTC.D and ETH.D and composite is above 50.
Background Shading: Each phase is shaded with a semi-transparent background color.
Timeframe-Aware Display: All markers and signals are shown only on weekly timeframe for clarity.
Intended Use:
This script is intended for educational and macro-trend analysis purposes.
It can be used to:
Identify macro cycle position (accumulation, bull phases, euphoria, etc.)
Spot long-term trend continuation or weakening signals
Add context to price action with external on-chain and sentiment data
Time rotation events such as altseason risk
Disclaimer:
This script does not constitute financial advice.
It is intended for informational and research purposes only.
Users should conduct their own due diligence and analysis before making investment decisions.

Didi Index Pro – NNFX Trend Indicator [UTS]📈 Uber Didi Index Pro – NNFX Trend Indicator
A Top 100 NNFX-Compliant Trend Indicator – Refined for Rule-Based Traders
This enhanced Didi Index is a purpose-built trend indicator optimized for No Nonsense Forex (NNFX) systems. It reimagines the classic Brazilian Didi Index with powerful upgrades designed for serious, rules-based trading.
🔍 What Makes This Version Unique?
✅ NNFX-Adjusted Logic
• Removes short/fast MAs to reduce noise
• Designed to work only with long-period moving averages – as per VP’s recommendations
🔁 Inverted & Zero-Centered
• Deviations are plotted relative to the medium MA baseline at zero
• Inverted formula offers better signal clarity (e.g., rising above zero = uptrend)
🎛️ Customizable with 25+ Moving Average Types
• Choose SMA, EMA, WMA, VWMA, Hull, LSMA, and more
• Tune each line individually to match your system rules
📢 Alerts Built In
• Set alerts for crossovers, entering/exiting zones, or custom signal events
• Works as a primary confirmation, secondary confirmation or even exit indicator
🎯 Clean Signals, Fast Readability
• Removed the "Curta" and relies on the better "Longa" line relative to a zero centered "Media" line
• Great for confirming higher timeframe trends or filtering false entries
🕰️ History & Context
Originally developed by Brazilian trader Odir “Didi” Aguiar, the Didi Index compares short, medium, and long moving averages to spot market compression and expansions. This version repurposes the idea for trend-following, not mean reversion, and fully aligns with NNFX methodology.
📎 How to Use in NNFX Systems
Use this indicator as part of your C1 or C2 (confirmation) indicator:
When the Longa line is above zero → Bias = Long
When the Longa line is below zero → Bias = Short
Avoid trades when both lines are tightly compressed near zero
✅ Designed by traders who follow the rules.
✅ Built for traders who want clarity, consistency, and compliance.
🚀 Moving Averages
Trend-determining method offers 26 high quality Moving averages to choose.
"SMA", Simple Moving Average, R. H. Hooker, 1901
"EMA", Exponential Moving Average, P. N. Haurlan, early 1960s
"MDMA", McGinley Dynamic MA, John R. McGinley, 1990s
"DSEMA", Double Smoothed EMA, William Blau, year unknown
"DEMA", Double EMA, Patrick G. Mulloy, 1994
"TEMA", Triple EMA, Patrick G. Mulloy, 1994
"WMA", Weighted MA, Author and year unknown
"PWMA", Parabolic Weighted MA, Author and year unknown
"VWMA", Volume Weighted MA, Author and year unknown
"HULL", Hull MA, Alan Hull, 2005, year unknown
"TMA", Triangular MA, Author and year unknown
"B2P", Two Pole Ehlers Butterworth, John F. Ehlers, 2004
"S2P", Two Pole Ehlers Smoother, John F. Ehlers, year unknown
"S3P", Three Pole Ehlers Smoother, John F. Ehlers, year unknown
"SINE", Sine Weighted MA, Author and year unknown
"LINREG", Linear Regression Value (LSMA), Author and year unknown
"ILINREG", Integral of Linear Regression Slope, Author and year unknown
"NLMA", Non Lag MA, Author and year unknown
"ZLMA", Zero Lag MA, Author and year unknown
"KIJUN", Kijun-Sen Ichimoku, Goichi Hosoda, late 1930s
"SSM", Super Smoother, John F. Ehlers, year unknown
"ALMA", Arnaud Legoux MA, Arnaud Legoux, year unknown
"KAMA", Kaufman Adaptive MA, Perry J. Kaufman, 1998
"FRAMA", Fractal MA, John F. Ehlers, year unknown
"RMA", Running MA, J. Welles Wilder Jr., 1978
"JMA", Jurik Moving Average, Mark Jurik, year unknown
🚥 Signals
The indicator displays buy/sell signals, Beyond-ATR signals, and recommends when a pullback entry is possible.
Long Signal
Short Signal
📢 Alerts
Each chart signal can trigger an alert with the same name. To avoid multiple alerts being triggered within a single candle, it is recommended to wait for the candle to close and use the 'Once Per Bar Close' setting.
Long Signal
Short Signal
🗃️ About
Name: Uber Didi Index Pro – NNFX Trend Indicator
Created: 2025/06/20
PineScript: v6

HMA Swing Levels [BigBeluga]An advanced swing structure and trend-following tool built on Hull Moving Average logic, designed to detect major reversals and track dynamic support/resistance zones.
This indicator analyzes price swings using pivot highs/lows and a smoothed HMA trend baseline. It highlights key reversal levels and keeps them active until breached, giving traders a clear visual framework for price structure and trend alignment. The pivots are calculated in real-time using non-lagging logic, making them highly responsive to market conditions.
🔵 CONCEPTS
Combines a fast-reacting Hull Moving Average (HMA) with pivot logic to capture precise directional changes.
Detects non-lagging reversal highs and lows when pivot points form and the HMA direction flips.
Projects these reversal levels forward as horizontal support/resistance lines until broken by price.
Active trend is shown with a step-style trail line that reflects HMA bias over time.
🔵 FEATURES
Swing Level Detection:
Identifies high/low reversals when trend direction changes and plots horizontal zones.
Non-lagging logic of swing points detection:
if h == high and high < h and change > 0
// Detected Swing High
if l == low and low > l and change < 0
// Detected Swing Low
Persistent Support & Resistance Lines:
Each detected swing high or low is extended forward until price invalidates the level. Dotted style is applied once breached.
Color-Coded Trend Trail:
Displays a stepped trend trail using HMA slope: lime = uptrend, blue = downtrend.
Automatic Labeling:
Each reversal level is labeled with its price for clear reference.
Age-Based Line Thickness:
Every level increases in thickness every 250 bars. The longer the level lasts, the stronger it is.
🔵 HOW TO USE
Use green (support) and blue (resistance) levels to frame key reaction zones.
Trade with the trend defined by the trail color: lime for bullish bias, blue for bearish.
Explore where buy or sell orders are stacked
Look for breaks of swing lines to anticipate trend shifts or breakout setups.
Adjust the "Trend Change" input to tune the sensitivity of swing detection.
Adjust the "SwingLevels" input to define how far back to search for valid pivots.
🔵 CONCLUSION
HMA Swing Levels offers a hybrid approach to structural and trend-based trading. With automated non-lagging swing detection, persistent support/resistance tracking, and intuitive HMA-based trend coloring, it provides a powerful visual system for discretionary and systematic traders alike.

Fourier Weighted Moving Average-(FWMA)Fourier Weighted Moving Average (FWMA)
About Fourier and His Theory
Joseph Fourier (1768–1830) was a French mathematician and physicist best known for his work on heat transfer and periodic functions. His most significant contribution to science is what we now call Fourier Analysis.
What Is Fourier's Theory?
Fourier’s theory states that:
Any repeating (periodic) signal or pattern can be broken down into a sum of simple sine and cosine waves.
This idea became the foundation of signal processing, modern physics, and data smoothing techniques — including those used in financial markets.
Key Concepts of Fourier’s Theory
1. Decomposition of Signals
Complex waveforms can be expressed as combinations of basic sine waves with different frequencies and amplitudes.
2. Frequency Domain View
Instead of viewing data in time (or price), you can analyze its frequency — how often certain movements repeat.
3. Smoothing and Filtering
By focusing only on certain frequencies (e.g., slower or longer cycles), Fourier methods allow you to filter out short-term noise and focus on the trend.
4. Applications in Finance
In trading, Fourier principles help design indicators that:
* Remove short-term market noise
* Emphasize dominant cycles
* Provide cleaner trend direction
Why It Matters for This Indicator
The Fourier Weighted Moving Average (FWMA) used in this indicator applies a custom weight derived from a sin² function, inspired by Fourier’s work on wave behavior. This gives more influence to the mid-section of the price data, making the average line smoother and more stable than traditional methods like SMA or EMA.
Unlike basic moving averages, the FWMA reacts to price changes more fluidly while reducing whipsaws, which is especially useful for trend-following strategies.
Input Settings and Controls
This section outlines all configurable fields and buttons available in the indicator, grouped for clarity:
Main Settings
* Source
Defines the price source used in the FWMA calculation. Options typically include close, open, hl2, etc.
* FWMA – 1 (Length)
Sets the period for the first Fourier Weighted Moving Average. Shorter lengths produce faster, more sensitive lines.
* FWMA – 2 (Length)
Sets the period for the second FWMA, typically used as a slower or long-term trend filter.
* Weight Epsilon
A small constant added to the weight formula to prevent division by zero and improve numeric stability in the FWMA formula.
Slope Sensitivity
* Slope Sensitivity (Bars)
This field defines the number of bars used to calculate the slope of each FWMA. The slope determines whether the line is rising or falling and is used to change the line color accordingly.
* Enable Slope Coloring (Toggle)
When enabled, both FWMA lines change color based on their slope:
* Positive slope = trend up color
* Negative slope = trend down color
If disabled, lines are shown in a neutral (gray) color.
Ribbon Settings (Group: Ribbon)
* Enable Ribbon for FWMA-2 (Toggle)
Turns the ribbon feature on or off. When enabled, the script plots two additional lines slightly above and below FWMA-2.
* Ribbon Thickness
Controls the line width of the ribbon above and below FWMA-2. Values from 1 to 100 are allowed, giving full control over ribbon visual prominence.

PulseMA OscillatorOverview
PulseMA Oscillator is a technical analysis tool that transforms the relationship between price and a base moving average (EMA) into an oscillator fluctuating around a zero line. It is based on counting consecutive candles closing above or below the EMA and factoring in the slope of the average to gauge trend momentum.
This indicator helps assess not only the direction of the market but also the strength of the movement and potential exhaustion, making it useful for identifying trade entry and exit points.
Key Features
PulseMA Oscillator: Calculates a value based on the number of consecutive candles above or below an EMA and the angle (slope) of that EMA. Positive values indicate bullish dominance; negative values indicate bearish pressure.
Smoothing (SMA): A moving average of the oscillator to highlight the broader trend and reduce noise.
Zero Line: Acts as a baseline to distinguish between bullish and bearish conditions.
Use Cases
PulseMA Oscillator is designed for technical traders who want to:
Determine the direction and strength of the trend based on candle positioning relative to an EMA.
Identify potential market reversals or exhaustion when the oscillator reaches extreme values.
Generate trade signals when:
The oscillator crosses above/below its smoothed version.
The oscillator crosses the zero line.
The smoothed line (PulseMA MA) crosses the zero line, confirming a shift in the longer-term trend.
Analyze trend momentum with a fresh perspective — different from traditional oscillators like RSI or MACD.
How to Use
Add the indicator to your chart: Search for "PulseMA Oscillator" in the indicators library.
Adjust parameters as needed:
EMA Length (PulseMA Length) – default: 50
SMA Length (Smoothing) – default: 20
Interpretation
Positive values: A series of candles are closing above the EMA — indicates bullish momentum.
Negative values: A series of candles are closing below the EMA — indicates bearish momentum.
Cross of PulseMA above SMA: Potential buy signal.
Cross of PulseMA below SMA: Potential sell signal.
Crossing the zero line by PulseMA: May indicate trend shift.
Crossing the zero line by PulseMA MA: May confirm a more sustained trend change.
Notes
Best used in trending markets. In sideways/consolidating conditions, consider combining with other filters.
Using a higher EMA length (e.g., 100) results in a smoother and more long-term trend representation.
Fine-tuning the parameters to your specific asset and timeframe can greatly improve effectiveness.

DP_MoneyFlow_Osc_V4**DP_Moneyflow_Osc_V4** is a custom, volume‐weighted momentum oscillator built around the classic Money Flow Index (MFI), with a few twists to help you spot more reliable reversal points:
***Best way to use it is to take the signals as alert points, to understand when money is starting to flow in or starting to flow out. It is not intended to be a Buy or Sell signal at the point of entry where the label is printed.***
1. **Core Calculation**
* Computes the standard MFI on your chart’s native timeframe:
* Money Flow = typical price (H+L+C)/3 × volume
* Segregates positive vs. negative flow based on whether price rose or fell on each bar
* Smooths each with an N-bar SMA, forms the ratio, and maps it into a 0–100 scale
2. **Inversion & Smoothing**
* You can **invert** the oscillator around 50 (so peaks become troughs and vice versa) with the **Reverse MFI** toggle.
* Applies two layers of smoothing (one for raw noise reduction, another for longer-term trend stability).
3. **Dynamic Coloring**
* Above Overbought (OB) threshold → solid red; below Oversold (OS) → solid green.
* In between, it linearly fades from red/green toward black as it approaches the 50 midpoint.
* **Invert Colors** flips the hue logic (red ↔ green) if you prefer.
4. **Overbought/Oversold Zones**
* Plots horizontal lines at your chosen OB/OS levels.
* Optionally fills the zone between them for quick visual reference.
5. **Peak/Trough Signal Labels**
* Detects **true extremes** by finding when the oscillator reverses direction right at or beyond your OB/OS levels.
* Prints a tiny “OB” or “OS” label **exactly at that pivot bar**, so you see the high or low of the swing.
6. **Alternation Toggle**
* Prevents two consecutive “OS” or “OB” labels by enforcing strict Buy/Sell alternation—turn this on or off via **Enable Signal Alternation**.
---
**Use-Case**: This oscillator excels at pinpointing the *tops* and *bottoms* of strong volume‐backed moves, giving you clear pivot markers rather than every threshold crossover. Tweak the smoothing and threshold inputs to calibrate sensitivity to your market and timeframe.

Bitcoin Macro Oscillator | [DeV]The Bitcoin Macro Oscillator (BMO) is a sophisticated fundamental indicator designed to provide a comprehensive view of Bitcoin’s market conditions by combining four key on-chain metrics: the Market Value to Realized Value (MVRV) Ratio, Volume-Weighted Average Price (VWAP) Ratio, Cumulative Value-Days Destroyed (CVDD) Ratio, and Sharpe Ratio. These metrics are individually z-scored and weighted according to user-defined preferences, then averaged to produce a single oscillating value, the BMO Z-score. This helps users identify whether Bitcoin is in a bullish (above zero) or bearish (below zero) phase, offering insights into potential market tops, bottoms, and overall trend strength. Inspired and reverse engineered from the BMO of Woonomics, this indicator is enhanced with a customizable moving average.
Market Value to Realized Value (MVRV) Ratio
The MVRV Ratio compares Bitcoin’s current market capitalization (price multiplied by circulating supply) to its realized capitalization (the value of all coins at the price they were last moved on the blockchain). Calculated as MVRV = Market Cap / Realized Cap, it is then z-scored over a user-defined lookback period (default 120 days). This metric tracks whether Bitcoin is overvalued (high MVRV, suggesting a market top) or undervalued (low MVRV, indicating a potential bottom), providing a gauge of investor profitability and market sentiment.
Volume-Weighted Average Price (VWAP) Ratio
The VWAP Ratio measures Bitcoin’s current price against its volume-weighted average price, which is computed by summing the product of price and volume over a lookback period (default 120 days) and dividing by total volume, with a fallback to the current price if volume is zero. The ratio is z-scored to standardize it. This tracks the relationship between price and the average price paid with volume consideration, helping identify overbought or oversold conditions—high values may signal tops, while low values suggest bottoms.
Cumulative Value-Days Destroyed (CVDD) Ratio
The CVDD Ratio is based on the CVDD metric, which estimates the total value of Bitcoin that has been “destroyed” (spent at a loss) over time, approximated here using a longer-term simple moving average (SMA) of the price over twice the lookback period. The ratio is calculated as the current price divided by this CVDD price, then z-scored. It tracks the accumulation of value destruction, with low values indicating bearish exhaustion and high values suggesting bullish momentum.
Sharpe Ratio
The Sharpe Ratio assesses Bitcoin’s risk-adjusted return by comparing the average return (calculated as the natural log of the price change) to its volatility (standard deviation of returns) over a user-defined Sharpe lookback period (default 180 days). If volatility is zero, it defaults to zero to avoid errors. This z-scored value tracks whether Bitcoin’s price movements offer a favorable return for the risk taken—positive values indicate good risk-adjusted performance, while negative values suggest caution.
Together, the MVRV, VWAP, CVDD, and Sharpe Ratio metrics provide a multi-faceted view of Bitcoin’s market health, with each contributing unique insights into valuation, volume, value destruction, and risk-adjusted performance. Their weighted combination into the BMO Z-score balances these inputs to offer a unified signal, enhanced by a customizable moving average (default 90-period EMA) that smooths the Z-score for trend confirmation—rising when bullish, falling when bearish. Credit to Woonomics for inspiring this robust framework, which adapts their BMO concept into a flexible, user-tailored tool.

Money NoodleMoney Noodle Indicator - How It Works
The Money Noodle indicator is a trend-following and support/resistance tool that combines multiple exponential moving averages (EMAs) with dynamic volatility-based bands to create a comprehensive trading system.
Core Components
1. Triple EMA System ("The Noodles")
Fast EMA (12): Most responsive to price changes, shows short-term momentum
Medium EMA (21): Intermediate trend direction
Slow EMA (35): Main trend line that acts as the central reference point
The "noodle" effect comes from how these three EMAs weave around each other and the price action, creating curved, flowing lines that resemble noodles.
2. Dynamic Volatility Bands
Upper Band: Main EMA + (ATR × Band Multiplier)
Lower Band: Main EMA - (ATR × Band Multiplier)
Uses a 20-period ATR (Average True Range) to measure market volatility
Band width automatically adjusts - wider during volatile periods, tighter during consolidation
How It Functions
Trend Identification:
When all three EMAs are aligned (fast > medium > slow), it indicates a strong uptrend
When EMAs are inverted (fast < medium < slow), it signals a downtrend
EMA crossovers provide early trend change signals
Support & Resistance:
The bands act as dynamic support and resistance levels
Price tends to bounce off the bands during trending markets
Band breaks often signal strong momentum moves or trend changes
Volatility Assessment:
Band width indicates market volatility - wider bands = higher volatility
ATR-based calculation makes the bands adaptive to current market conditions
The 0.0125 multiplier provides optimal sensitivity for most timeframes
Trading Applications
Entry Signals:
Buy when price bounces off the lower band with EMA alignment
Sell when price bounces off the upper band against the trend
Breakout trades when price decisively breaks through bands
Trend Following:
Use the main EMA (35) as your trend filter
Trade in the direction of EMA alignment
The "noodles" help identify trend strength - tighter = stronger trend
Risk Management:
Bands provide natural stop-loss levels
Band width helps size positions (wider bands = smaller size due to higher volatility)
The indicator works best on daily timeframes and provides a visual, intuitive way to read market structure, trend direction, and volatility all in one tool.

Supply/Demand Zones (Synthetic SMA Candles)Supply/Demand Zones (Synthetic SMA Candles)
Created by The_Forex_Steward
This indicator highlights institutional-style supply and demand zones using synthetic SMA-based candles rather than raw price data. It provides a smoother, more refined view of price action to help identify key imbalance areas where price is likely to react.
Features:
- Uses SMA-smoothed synthetic candles to detect bullish and bearish engulfing structures
- Draws demand zones after bullish breakouts and supply zones after bearish breakouts
- Zones are persistent for a customizable number of bars
- Mitigated zones can optionally be removed from the chart
- Includes alerts for breakout and mitigation events
- Optional plotting of synthetic candles over price for visual clarity
How It Works:
When a synthetic candle closes above the high of a previous bearish candle, a bullish engulfing is detected, and a demand zone is created from that bearish candle’s high and low. Conversely, when price closes below the low of a previous bullish candle, a supply zone is formed. These zones stay on the chart for the user-defined duration or until they are mitigated by price, at which point they can be removed automatically.
How to Use:
- Adjust the SMA Length to control how smooth the synthetic candles appear
- Enable or disable Show Supply Zones and Show Demand Zones as needed
- Set the Zone Duration to control how long each zone persists
- Use Delete Mitigated Zones to automatically remove zones when price returns to them
- Optionally enable Show Synthetic SMA Candles to see the candle logic used in detection
- Use the built-in alerts to stay notified of new zone creation or mitigation
Note: This tool is most effective when combined with structure or trend-based strategies for confirmation.

PineConnector [Extension] | FractalystWhat is the PineConnector Extension?
The PineConnector Extension is a sophisticated bridge indicator designed to seamlessly connect Quantify trading signals with PineConnector's automated execution system.
This extension transforms manual signal monitoring into fully automated trading by interpreting Quantify's signal outputs and converting them into executable PineConnector commands.
Unlike standalone trading indicators, this extension serves as a communication layer between your signal generation (Quantify indicator) and trade execution (PineConnector), enabling hands-free trading across multiple timeframes and instruments.
How does the signal processing work?
The extension processes four distinct signal types from Quantify indicators:
Signal Values:
1 = Buy/Long signal - Opens bullish positions
-1 = Sell/Short signal - Opens bearish positions
0.5 = Close Long - Closes all long positions
-0.5 = Close Short - Closes all short positions
The script continuously monitors the "Signal Source" input, which should be connected to any Quantify indicator's output. When a signal is detected, the extension automatically generates the corresponding PineConnector command with your configured parameters.
What are the available order types and how do they work?
The extension supports three order execution modes:
Market Orders:
- Execute immediately at current market price
- Highest execution probability
- Subject to slippage during volatile conditions
Limit Orders:
- Execute only when price reaches a more favorable level
- Buy limits placed below current price
- Sell limits placed above current price
- Dynamic pip offset calculated using ATR-based volatility
Stop Orders:
- Execute when price breaks beyond specified levels
- Buy stops placed above current price
- Sell stops placed below current price
- Useful for breakout strategies
Dynamic Pricing Calculation:
The extension calculates optimal entry prices using volatility-adjusted pip offsets:
priceVolatility = ta.atr(14) / close * 100
volatilityFactor = math.min(math.max(priceVolatility / 0.1, 0.5), 2.0)
pipsOffset = 10 * volatilityFactor
How does the risk management system work?
Risk Percentage:
The extension uses percentage-based position sizing where you specify the risk per trade (0.1% to 10.0%). This value is passed to PineConnector, which calculates the exact position size based on:
- Account balance
- Stop loss distance
- Instrument specifications
- Broker settings
Stop Loss Integration:
- The "Stop Source" input connects to external stop loss levels from Quantify or other indicators. - This ensures:
- Consistent risk-reward ratios
- Dynamic stop placement based on market structure
- Automatic position sizing calculations
Multi-Asset Compatibility:
The extension automatically detects instrument types and adjusts pip calculations:
Forex: mintick * 10
Crypto: mintick * 10
Other assets: mintick * 1
What does the information display table show?
The real-time status table provides essential configuration monitoring:
Status Indicators:
- License: Shows PineConnector license ID status (Blue = Set, Red = Missing)
- Security: Displays secret key status (Blue = Set, Orange = Disabled)
- Comment: Shows trade comment or timeframe if empty
- Symbol: Current trading symbol (manual override or chart symbol)
- Order Type: Active execution mode (Market/Limit/Stop)
- Risk: Risk percentage with color coding (Blue ≤1%, Orange >1%)
- Signal: Connection status (Blue = Connected, Red = Not Set)
- Stop: Stop loss source status (Blue = Connected, Red = Not Set)
Color Coding System:
Blue: Optimal/Connected
Orange: Warning/Moderate risk
Red: Error/Not configured
How do I connect this to my Quantify indicator?
Step-by-Step Connection:
Add the PineConnector Extension to your chart containing Quantify indicator
Configure Signal Source:
In the extension settings, locate "Signal Source"
Click the dropdown and select your Quantify indicator's signal output
The extension will automatically detect custom sources vs. default price data
Configure Stop Source:
Connect "Stop Source" to your Quantify indicator's stop loss output
This enables dynamic position sizing based on stop distance
Verify Connection:
Check the information table for "Signal" and "Stop" status
Blue indicates successful connection
Red indicates default price data (not connected)
Compatible Quantify Indicators:
- Quantify Trading Model
- Any indicator outputting standardized signals (1, -1, 0.5, -0.5)
What PineConnector setup is required?
Prerequisites:
- Active PineConnector License - Required for all functionality
- MetaTrader 4/5 or supported broker platform
- PineConnector EA installed and configured
- TradingView Pro/Pro+/Premium for alert functionality
Configuration Steps:
- License ID: Enter your PineConnector license ID in the extension
- Secret Key: Optional security layer for command verification
- Symbol Mapping: Ensure symbol names match between TradingView and broker
- Alert Setup: Create TradingView alerts using this indicator
- Webhook Configuration: Point alerts to your PineConnector webhook URL
Security Features:
- Optional secret key encryption
- Symbol-specific commands
- Debug mode for testing and validation
What makes this extension unique?
Seamless Integration:
- Unlike manual signal copying, this extension provides:
- Zero-latency signal translation
- Automated parameter passing
- Consistent execution across timeframes
- No human intervention required
Dynamic Adaptability:
Volatility-adjusted pricing for limit/stop orders
Automatic symbol detection and conversion
Multi-asset pip calculations
Intelligent timeframe formatting
Professional Risk Management:
- Percentage-based position sizing
- External stop loss integration
- Multi-order type support
- Real-time status monitoring
Robust Architecture:
- Error-resistant signal processing
- Comprehensive input validation
- Debug and testing capabilities
- Security features for live trading
Installation and Setup Guide
Quick Start:
- Add "PineConnector | Fractalyst" to your chart
- Configure your PineConnector license ID
- Connect Signal Source to your Quantify indicator
- Connect Stop Source to your stop loss indicator
- Set your preferred risk percentage
- Choose order type (Market recommended for beginners)
- Create TradingView alert using this indicator
- Ensure PineConnector EA is running on your trading platform
Advanced Configuration:
- Custom symbol mapping for cross-platform trading
- Secret key implementation for enhanced security
- Comment customization for trade tracking
- Debug mode for strategy validation
Legal Disclaimers and Risk Acknowledgments
Trading Risk Disclosure
This PineConnector Extension is provided for informational, educational, and automation purposes only and should not be construed as financial, investment, or trading advice. The extension facilitates automated trading connections but does not guarantee profitable outcomes, successful trade execution, or positive investment returns.
Automated trading systems carry substantial risks including but not limited to total capital loss, system failures, connectivity issues, and adverse market conditions. The extension's performance depends on multiple third-party services including PineConnector, MetaTrader platforms, TradingView infrastructure, and broker execution quality, any of which may experience downtime, technical failures, or service interruptions that could affect trading performance.
System Dependency Acknowledgment
The extension requires continuous operation of multiple interconnected systems: TradingView charts and alerts, PineConnector services and Expert Advisors, MetaTrader platforms, broker connectivity, and stable internet connections. Any interruption or malfunction in these systems may result in missed signals, failed executions, or unexpected trading behavior.
Users acknowledge that neither the seller nor the creator of this extension has control over these third-party services and cannot guarantee their availability, accuracy, or performance. Market conditions, broker execution policies, slippage, and technical factors may significantly affect actual trading results compared to theoretical or backtested performance.
Liability Limitation
By utilizing this extension, users acknowledge and agree that they assume full responsibility and liability for all trading decisions, financial outcomes, and potential losses resulting from the use of this automated trading system. Neither the seller nor the creator shall be liable for any unfavorable outcomes, financial losses, missed opportunities, or damages resulting from the development, use, malfunction, or performance of this extension.
Past performance of connected indicators, strategies, or the extension itself does not guarantee future results. Trading outcomes depend on numerous factors including market conditions, economic events, broker execution quality, network connectivity, and proper system configuration, all of which are beyond the control of the extension creator.
User Responsibility Statement
Users are solely responsible for understanding the risks associated with automated trading, properly configuring all system components, maintaining adequate capitalization and risk management, and regularly monitoring system performance. Users should thoroughly test the extension in demo environments before live deployment and should never risk more capital than they can afford to lose.
This extension is designed to automate signal execution but does not replace the need for proper risk management, market understanding, and trading discipline. Users should maintain active oversight of their automated trading systems and be prepared to intervene manually when necessary.

Trend Blend
Trend blend is my new indicator. I use it to identify my bias when trading and filter out fake setups that are going in the wrong direction.
Trend blend utilises the 9 EMA (Red), 21 EMA (Black), and if you trade futures or Bitcoin, you can also use the VWAP (Blue).
There is also a table at the top right that displays the chart time frame bias
I prefer to use the 1-hour time frame for bias and execute the trades on 5-minute charts, mainly, and sometimes on the 1-minute for a smaller stoploss.
Here's an example of the trade I took during the London session on XAU/USD
1 hour bias was Bearish
Price broke out of the range
I waited for the London session to open, where I ended up taking a short on the 5-minute time frame as we broke out of the pre-London range
Entry was at the Fair Value Gap (5-minute bias was also Bearish as price traded into the FVG)
Stoploss was at the last high
Take Profit was the next major support level
Another set that I like to trade with the Trend blend is when price is trending bullish and price trades inside the 9 and 21 EMA, and there is a bullish candle closer above the 9 EMA with Stoploss below the low of the bullish candle and Take profit between 1-2 Risk to Reward
Same when there's a bearish trend, I wait for price to trade inside the 9 and 21 EMA, and I'll take sells when a bearish candle closes below the 9 EMA.
This setup works best in strong trends, or it can be used to enter a trade on a pullback or to scale into an existing trade.

PulseMA + MADescription
The PulseMA + MA indicator is an analytical tool that combines the analysis of the price relationship to a base Exponential Moving Average (EMA) with a smoothed Simple Moving Average (SMA) of this relationship. The indicator helps traders identify the direction and momentum of market trends and generates entry signals, displaying data as lines below the price chart.
Key Features
PulseMA: Calculates trend momentum by multiplying the number of consecutive candles above or below the base EMA by the slope of this average. The number of candles determines trend strength (positive for an uptrend, negative for a downtrend), while the EMA slope reflects the rate of change of the average. The PulseMA value is scaled by multiplying by 100.
Smoothed Average (PulseMA MA): Adds a smoothed SMA, facilitating the identification of long-term changes in market momentum.
Dynamic Colors: The PulseMA line changes color based on the price position relative to the base EMA (green for price above, red for price below).
Zero Line: Indicates the area where the price is close to the base EMA.
Applications
The PulseMA + MA indicator is designed for traders and technical analysts who aim to:
Analyze the direction and momentum of market trends, particularly with higher PulseMA Length values (e.g., 100), which provide a less sensitive EMA for longer-term trends.
Generate entry signals based on the PulseMA color change or the crossover of PulseMA with PulseMA MA.
Anticipate potential price reversals to the zero line when PulseMA is significantly distant from it, which may indicate market overextension.
How to Use
Add the Indicator to the Chart: Search for "PulseMA + MA" in the indicator library and add it to your chart.
Adjust Parameters:
PulseMA Length: Length of the base EMA (default: 50).
PulseMA Smoothing Length: Length of the smoothed SMA (default: 20).
Interpretation:
Green PulseMA Line: Price is above the base EMA, suggesting an uptrend.
Red PulseMA Line: Price is below the base EMA, indicating a downtrend.
PulseMA Color Change: May signal an entry point (recommended to wait for 2 candles to reduce noise).
PulseMA Crossing PulseMA MA from Below: May indicate a buy signal in an uptrend.
Zero Line: Indicates the area where the price is close to the base EMA.
Significant Deviation of PulseMA from the Zero Line: Suggests a potential price reversal to the zero line, indicating possible market overextension.
Notes
The indicator generates trend signals and can be used to independently identify entry points, e.g., on PulseMA color changes (waiting 2 candles is recommended to reduce noise) or when PulseMA crosses PulseMA MA from below.
In sideways markets, it is advisable to use the indicator with a volatility filter to limit false signals.
Adjusting the lengths of the averages to suit the specific instrument can improve signal accuracy.
