F&O Time Zones – Final Fixed📌 This indicator highlights high-probability intraday time zones used in Indian F&O (Futures & Options) strategies. Ideal for scalping, breakout setups, and trap avoidance.
🕒 Covered Time Zones:
• 9:15 – 9:21 AM → Flash Trades (first 1-minute volatility)
• 9:21 – 9:30 AM → Smart Money Trap (VWAP fakeouts)
• 9:30 – 9:50 AM → Fake Breakout Zone
• 9:50 – 10:15 AM → Institutional Entry Timing
• 10:15 – 10:45 AM → VWAP Range Scalps
• 10:45 – 11:15 AM → Second Trap Zone
• 11:15 – 1:00 PM → Trend Continuation Window
• 1:00 – 1:45 PM → Volatility Compression
• 1:45 – 2:15 PM → Institutional Exit Phase 1
• 2:15 – 2:45 PM → Trend Acceleration / Reversals
• 2:45 – 3:15 PM → Expiry Scalping Zone
• 3:15 – 3:30 PM → Dead Zone (square-off time)
🔧 Features:
✓ Clean vertical lines per zone
✓ Optional label positions (top or bottom)
✓ Adjustable line style, width, and color
🧠 Best used on: NIFTY, BANKNIFTY, FINNIFTY (5-min or lower)
---
🔒 **Disclaimer**:
This script is for **educational purposes only**. It is not financial advice. Trading involves risk. Please consult a professional or do your own research before taking any positions.
—
👤 Script by: **JoanJagan**
🛠️ Built in Pine Script v5
Nseindia

ATR Trailing Stop by GideonMATR Trailing Stop Indicator
This ATR Trailing Stop Indicator is designed for traders who wish to enhance their exit strategies by leveraging volatility-based stops. It offers a systematic approach to trend management and risk control, enabling traders to capture extended trends while protecting their capital during market reversals. Works on Indian Indices as well.
Overview:
The ATR Trailing Stop indicator is a dynamic trend-following tool that adjusts stop levels based on market volatility. By incorporating the Average True Range (ATR), the indicator provides a flexible exit strategy that adapts to changing market conditions, helping traders lock in profits during trends and limit losses during reversals.
How It Works:
True Range and ATR Calculation:
The indicator first calculates the True Range (TR) for each bar, defined as the maximum of:
The difference between the high and low,
The absolute difference between the high and the previous close, and
The absolute difference between the low and the previous close.
Using the TR values, the ATR is computed over a user-defined period (default is 14 bars) with an option to use either a Simple Moving Average (SMA) or an Exponential Moving Average (EMA) as the smoothing method.
Trailing Stop Determination:
Two potential stop levels are calculated:
For an uptrend, the stop is determined as:
Stop = Close – (Multiplier × ATR)
For a downtrend, the stop is:
Stop = Close + (Multiplier × ATR)
The indicator maintains a persistent trailing stop that dynamically adjusts:
In an uptrend, the trailing stop only moves upward (or remains flat) to secure gains.
In a downtrend, it only moves downward, thereby protecting the position from excessive losses.
A reversal in trend is identified when the price crosses the trailing stop level, at which point the indicator flips the trend and resets the stop level accordingly.
Rationale:
Utilizing the ATR for trailing stops ensures that the stop levels are directly influenced by market volatility. This dynamic adjustment helps accommodate the natural price fluctuations of the market, providing a more adaptive risk management tool compared to fixed stop-loss levels. The approach is particularly useful in volatile markets where traditional static stops might be triggered prematurely.
Customization:
Key parameters that can be adjusted include:
ATR Period: The number of bars used to calculate the ATR.
ATR Multiplier: The factor that determines how far the trailing stop is set from the current price.
Smoothing Method: Option to choose between SMA and EMA for ATR calculation, allowing traders to tailor the sensitivity of the indicator to their specific trading style.

Trend & ADX by Gideon for Indian MarketsThis indicator is designed to help traders **identify strong trends** using the **Kalman Filter** and **ADX** (Average Directional Index). It provides **Buy/Sell signals** based on trend direction and ADX strength. I wanted to create something for Indian markets since there are not much available.
In a nut-shell:
✅ **Buy when the Kalman Filter turns green, and ADX is strong.
❌ **Sell when the Kalman Filter turns red, and ADX is strong.
📌 **Ignore signals if ADX is weak (below threshold).
📊 Use on 5-minute timeframes for intraday trading.
------------------------------------------------------------------------
1. Understanding the Indicator Components**
- **Green Line:** Indicates an **uptrend**.
- **Red Line:** Indicates a **downtrend**.
- The **line color change** signals a potential **trend reversal**.
**ADX Strength Filter**
- The **ADX (orange line)** measures trend strength.
- The **blue horizontal line** marks the **ADX threshold** (default: 20).
- A **Buy/Sell signal is only valid if ADX is above the threshold**, ensuring a strong trend.
**Buy & Sell Signals**
- **Buy Signal (Green Up Arrow)**
- Appears **one candle before** the Kalman line turns green.
- ADX must be **above the threshold** (default: 20).
- Suggests entering a **long position**.
- **Sell Signal (Red Down Arrow)**
- Appears **one candle before** the Kalman line turns red.
- ADX must be **above the threshold** (default: 20).
- Suggests entering a **short position**.
2. Best Settings for 5-Minute Timeframe**
For day trading on the **5-minute chart**, the following settings work best:
- **Kalman Filter Length:** `50`
- **Process Noise (Q):** `0.1`
- **Measurement Noise (R):** `0.01`
- **ADX Length:** `14`
- **ADX Threshold:** `20`
- **(Increase to 25-30 for more reliable signals in volatile markets)**
3. How to Trade with This Indicator**
**Entry Rules**
✅ **Buy Entry**
- Wait for a **green arrow (Buy Signal).
- Kalman Line must **turn green**.
- ADX must be **above the threshold** (strong trend confirmed).
- Enter a **long position** on the next candle.
❌ **Sell Entry**
- Wait for a **red arrow (Sell Signal).
- Kalman Line must **turn red**.
- ADX must be **above the threshold** (strong trend confirmed).
- Enter a **short position** on the next candle.
**Exit & Risk Management**
📌 **Stop Loss**:
- Place stop-loss **below the previous swing low** (for buys) or **above the previous swing high** (for sells).
📌 **Take Profit:
- Use a **Risk:Reward Ratio of 1:2 or 1:3.
- Exit when the **Kalman Filter color changes** (opposite trend signal).
📌 **Avoid Weak Trends**:
- **No trades when ADX is below the threshold** (low trend strength).
4. Additional Tips
- Works best on **liquid assets** like **Bank Nifty, Nifty 50, and large-cap stocks**.
- **Avoid ranging markets** with low ADX values (<20).
- Use alongside **volume analysis and support/resistance levels** for confirmation.
- Experiment with **ADX Threshold (increase for stronger signals, decrease for more trades).**
Best of Luck traders ! 🚀

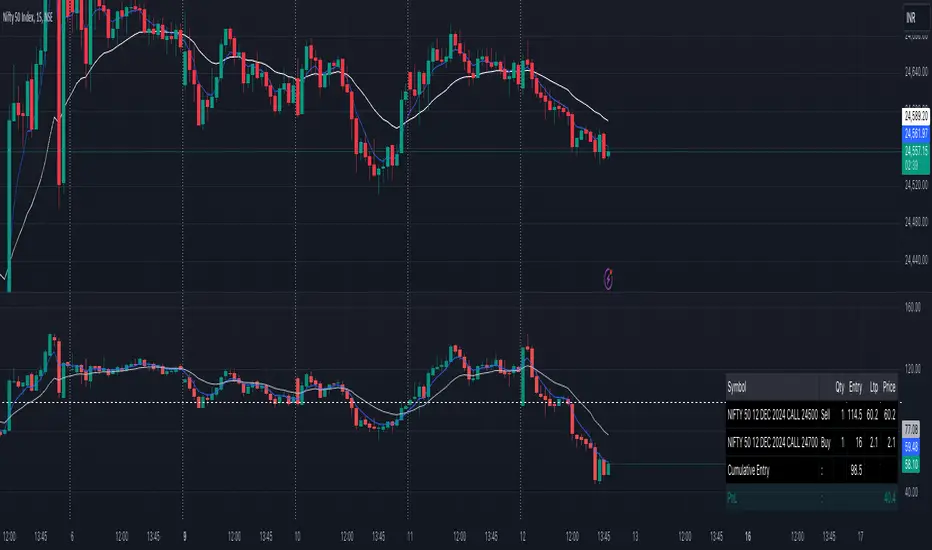
Options Cumulative Chart AnalysysThis Pine Script is a comprehensive tool designed for traders analyzing options data on TradingView. It aggregates multiple symbols to calculate and visualize cumulative performance, providing essential insights for decision-making.
Key Features:
Symbol and Strike Price Configuration:
Supports up to four configurable symbols (e.g., NIFTY options).
Allows defining buy/sell actions, quantities, and entry premiums for each symbol.
Customizable Chart Display:
Plot candlesticks and line charts for cumulative data.
Configurable Exponential Moving Averages (EMAs) for technical analysis.
Entry and price lines with customizable colors.
Timeframe Management:
Supports higher timeframe (HTF) candles.
Ensures compatibility with the current chart timeframe to maintain accuracy.
Dynamic Coloring and Visualization:
Red, green, and gray color schemes for body and wicks of candlesticks based on price movements.
Customizable positive and negative color schemes.
Table for Data Representation:
Displays an info table showing symbols, quantities, entry prices, and latest traded prices (LTP).
Adjustable table position, overlay, and styling.
Premium and Profit/Loss Calculations:
Calculates cumulative open, high, low, and close prices considering premiums and quantities.
Tracks the profit and loss dynamically based on cumulative premiums and market prices.
Alerts and Notifications:
Alerts triggered on specific conditions, such as when the profit/loss turns negative.
Modular Functions:
Functions for calculating high/low/open/close values, combining premiums, and drawing candlesticks.
Utilities for symbol management and security requests.
Custom Settings:
Includes a wide range of input options for customization:
Timeframes, EMA lengths, colors, table configurations, and more.
Error Handling:
Validates timeframe inputs to ensure compatibility and prevent runtime errors.
This script is designed for advanced traders looking for a customizable tool to analyze cumulative options data efficiently. By leveraging its modular design and visual elements, users can make informed trading decisions with a holistic view of market movements.
Stocksgeeks MBIThis indicator displays the Stocksgeeks market breadth dashboard for NSE (India) stocks.
Market breadth provides insights into the participation of stocks in a market's movement & the conviction in the overall mood of the underlying index. Various interpretations of market breadth exist, including gauging the quantity of new highs and new lows, or the number of advancing & declining stocks, or the percentage of stocks above or below certain moving averages.
This dashboard includes the following metrics:
4R
A count or ratio of advancing & declining stocks objectively depicts their participation in an index or stock universe. A positive market breadth is said to happen when more stocks are advancing than are declining.
The 4R column is based on 4% advances & declines.
The advances are calculated as the number of stocks having a daily percentage change ≥ 4% divided by the total number of stocks having a daily percentage change < -4%.
4R is the ratio between NSE (India) stocks advancing or declining by 4% daily.
4 chg is the % change from yesterday’s 4R value to today’s 4R value.
20R
When most of the stocks are trading above a specific moving average, the market breadth is termed strong. This dashboard uses 20-day EMA for short-term timeframes.
20R is the ratio between the % of NSE (India) stocks above & below the 20-day moving average.
20 chg is the % change from yesterday’s 20R value to today’s 20R value.
50R
For medium to long-term timeframes, this dashboard uses 50-day EMA.
50R is the ratio between the % of NSE (India) stocks above & below the 50-day moving average.
50 chg is the % change from yesterday’s 50R value to today’s 50R value.
52WH &52WL
These 2 columns display the net number of stocks on NSE (India) making new 52-week highs or new 52-week lows. A market is considered strong (bullish) when new highs exceed new lows.
Interpretation
The 52 week highs must be greater than 52 weeks lows for a bullish bias.
This is how the individual columns are coded:
4R: above 200 is green, below 50 is red
20R: above 75 is green, below 50 is red
50R: above 85 is green, below 60 is red
For all the changes (4 chg, 20 chg, 50 chg): above 20 is green and below -20 is red
To decide the overall color for the day, we subtract the number of red boxes from the number of green boxes for the day. If the output is greater than equal to 3, then the day color is green, and if this is less than equal to -3 then the day color is red. In case of no consensus, the overall day color is neutral.
The color of the 20R & 50R indicates the trend (green is uptrend, & red is downtend). The color of the 4R column & the chg columns (4 chg, 20 chg, 50 chg) indicates the strength of the trend.
Features
⦿ Expanded mode : This is the default state & displays the market breadth for the past 10 days.
⦿ Mini mode : This displays only the overall color for the day.
⦿ One-day mode : Turning off both the expanded & the mini mode displays the one-day mode, which displays the market breadth columns for the current day only.
⦿ Dark mode : One-click dark mode, as usual.
Dependency
The script uses the Pine Seeds service to import custom data hosted in a GitHub repository and accesses it via TradingView as the frontend. So, the number of bars appearing on charts is fully dependent on the amount of historical data available. Any error or omission, if there, is a reflection of the hosted data, & not that of Tradingview.
Limitations
Such data has some limitations, like it can only be updated at EOD (End-of-Day), & only daily-based timeframes can be applied to such data. Irrespective of the intraday changes, only the last saved value on the chart is seen. So, it's best to use this script as EOD, rather than intraday. At the time of publication of this script, 375 days of historical data was available.
Credits
The Stocksgeeks interpretation of the market breadth is from Umang , who has graciously allowed his concepts to be coded into a script for TradingView. This script uses the NSE Market Breadth data from Chhirag_Kedia via a pine seed from EquityCraze . Hats off to these amazing individuals, without whose efforts, such scripts wouldn't have seen the light of this day!

Gann Intraday Retracement Levels, by PVSharmaOne of the greatest technical analyst the world has seen, was The Legendary William Delbert Gann. He had simple, creative principles based on astronomical computations. Although he wasn't an intraday trader, his theories produced outcomes that are just as impressive as delivery trading.
On the basis of his approach, I have created an indicator based on intraday trades that offers high profits at extremely brief stop-losses.
This indicator has been well evaluated, and I can declare with confidence that its excellent performance are based on "buy at dip and sell on peak" principle. Although this indicator has been tested, it does not perform well enough in some instruments, such as Forex, some cryptocurrencies, and a few international commodities.
Please take note that this indicator is excellent for speculating on NSE indexes and is applicable to practically all NSE instruments (apart from Forex). I'm also working on several errors, that I plan to remedy and present to you in the near future

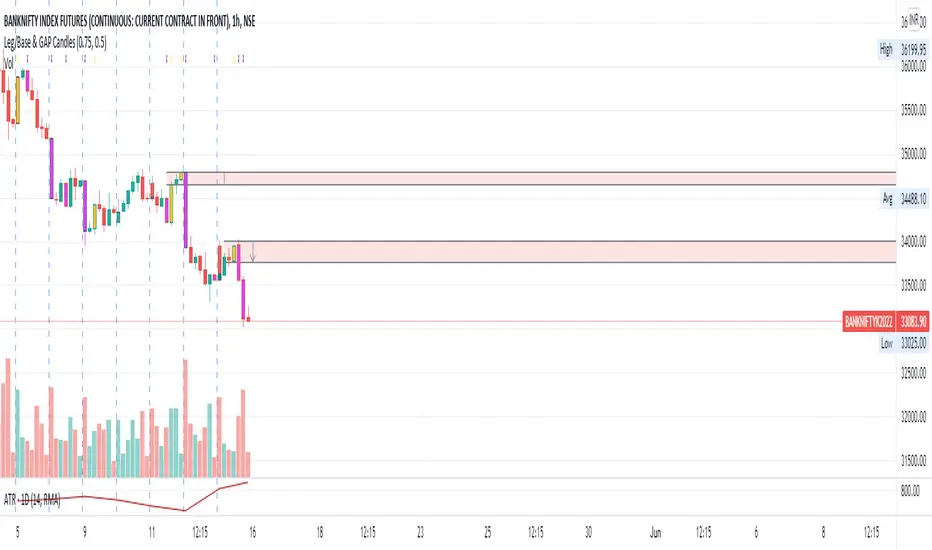
Leg/Base & GAP CandlesThis script, redraws the Minute, Hourly, Daily, Weekly, Monthly candles for gap up and gap down situation. Also this candle marks the LEG candles and BASE Candles with different colors to mark the supply and demand zone.
This script is only for Indian NSE markets (09:15 to 15:30) for GAP up/GAP down redraw.
This script is most beneficial for TradeLegend students.
This script is originally made by me, and no code has been modified or copied from anywhere else except Pinescript documentation.
Future TimevalueThis indicator plots a chart of future timevalue for all NSE index and NSE FNO Stock. It plots the difference of future and spot's 1min candle close price.
Just open any index or stock spot chart in 1 min timeframe(works with higher tf also) and add the indicator.

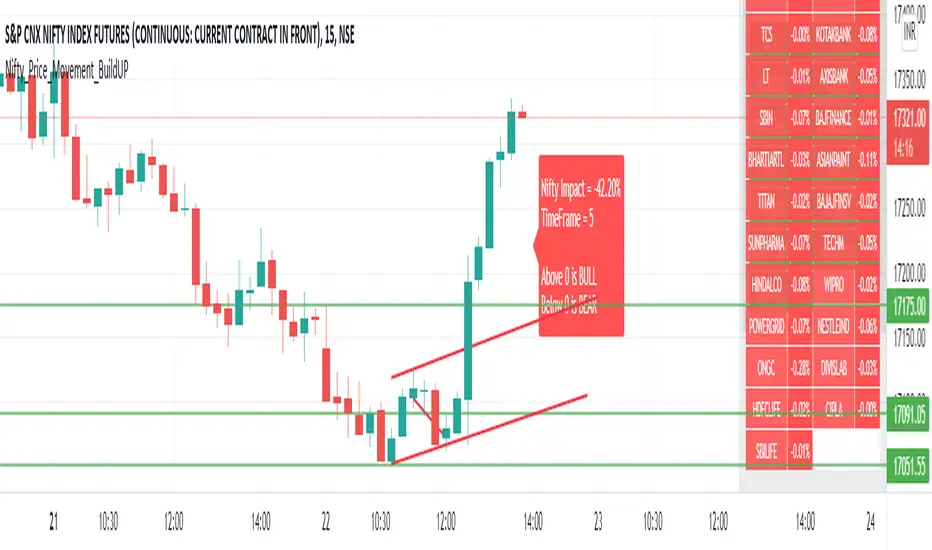
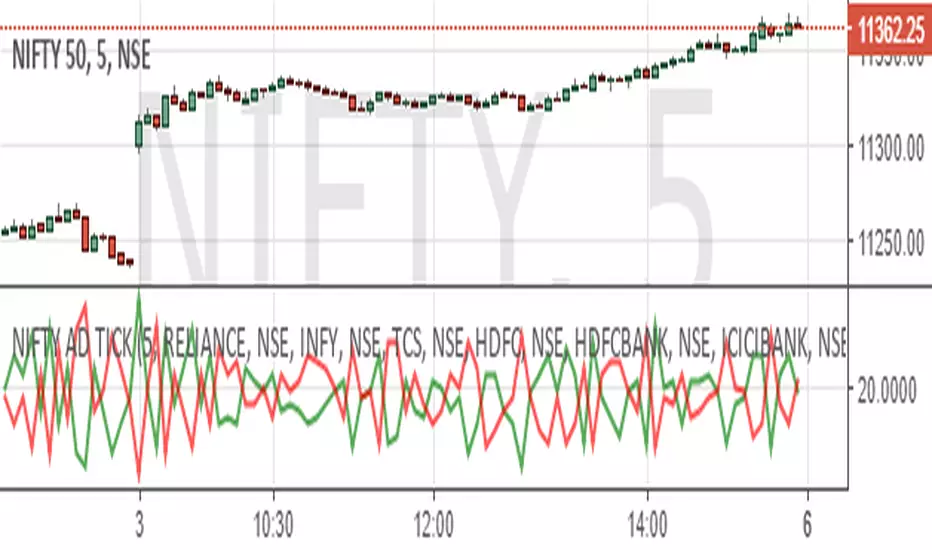
Nifty_Price_Movement_BuildUPDashboard to see Price Momentum Build-Up at Nifty.
It cumulates all prices and their respective weightage.
During initial of a candle, we are not aware of volume is High or Not, we only get it in later buildup. But Price buildup will display it at the same instant that what is going with the price of all stocks.
The logic used here is that
1) If a stock close > open at a particular instant it will add that stock multiplied with its weightage in Nifty to the list of stocks that are positive.
2) If a stock close < open at a particular instant it will add that stock multiplied with its weightage in Nifty to the list of stocks that are negative.
3) Above two will give you data that how many of them are positive and are negative at a particular instant and how they are going to affect Nifty.
In one of the many possible ways, it is superior than that of Volume buildup is that, to determine volume is higher than previous volume, we have to wait for first few seconds/minutes/hours (depending on timeframe you are in) to see volume buildup. The Volume buildup function based indicator is kind of lagging, though volume itself being instant.
Volume Indicator NSE + BSE + Future Current & Next MonthThis indicator combines all the volumes from both the NSE & BSE exchanges as well as Future volumes ( Current Month & Next Month) if the symbol is available in FnO
Indicator shows 3 volumes
Total Volume = NSE + BSE + Current Month + Next Month
Stock Volume = NSE + BSE
Future volume = Current Month + Next Month
Benefits
As shown in the chart above, price shot up as the volume appeared in BSE but not NSE. These conditions can be caught easily and right decisions can be made
Since Future volumes are also combined, it gives an accurate picture of volumes on any given instrument during last of week of monthly expiries when contract rollovers happen
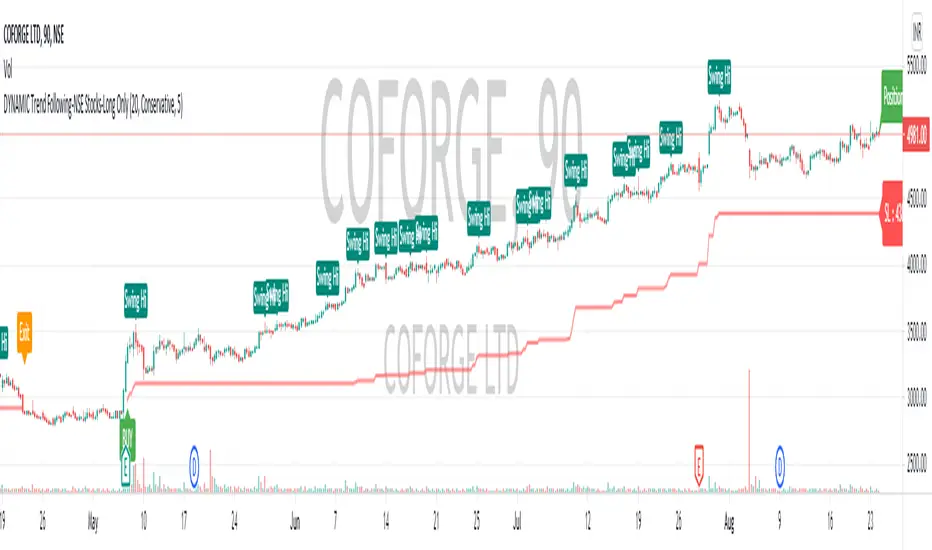
DYNAMIC Trend Following-NSE Stocks-Long OnlyMotivation
The momentum feature is well known and researched in the market. Momentum trades/signals often result in out sized positive returns when trades go well in their favor. At the same time, almost all momentum methods/signals suffer from frequent, small and multiple losses.
Dynamic indicator/system is a proprietary systematic method designed to capture momentum on Indian Indices of NIFTY and BANKNIFTY . It aims to identify bullish / bearish patterns in a systematic manner and uses volatility adjusted entry levels and trailing points. The method employs a proprietary method to filter out market noise from an underlying trend to ensure whipsaws arising from a trend-following method are removed. These patterns can be found in several well known books such as those of LA Little and Market Wizards series. We have combined well known existing patterns into a proprietary pattern that improves the performance. It is similar to combining Moving Average and RSI to get confirmations into a single system.
The current indicator is a Long-Only investment strategy for NSE(INDIA) Stocks.
Trade Usage
The indicator can be used either as a standalone indicator/method or can be used as an additional confirmation to your stock analysis. If you have a knack of picking stocks or if you deploy any other system to pick stocks, this can add systematic entry and exits to your Stock Analysis.
Time Frame
This indicator can work best if you use a bit of Multi-Time Frame analysis. Depending on your expected holding period, here are a few suggestions:
Investing - Holding period of a few Weeks to Months - Use Daily Charts and 2-Hr Charts
Swing Trading - Holding period of a few Days to Weeks - Use 90-Minute Charts and 30-Minute Charts
You can use any other time frame combinations that may suit your style.
Elements of the indicator
BUY - They depict the BUY Signal at the open of that bar.
Scale-In (Optional) - If your risk appetite permits, you can potentially scale-in at these times. These are signals which come only when a prior Buy signal is on.
Stop Loss - Anytime the system generates a Buy Signal, it will also generate an initial SL level. This SL level is updated at close of each bar and adapts to volatility and trend in the market.
Customizable Parameters
Here are a few things that can be customized:
Input Parameters:
Volatility Lookback - The lookback period that affects the trailing SL and entry exit signals. Default value is 20 Bars, but you may want to edit on the basis of your time frame.
Risk Mode - This comes with three options - Conservative, Moderate, Aggressive. It is a good idea to Enter Positions on Conservative Mode and then trail it on Moderate. Aggressive should rarely be used.
Colors - All labels and plots on the chart can be customized for colors. Look under 'Style' settings.
How to obtain access?
Please PM the publisher of script to request access or refer to details in signature below.
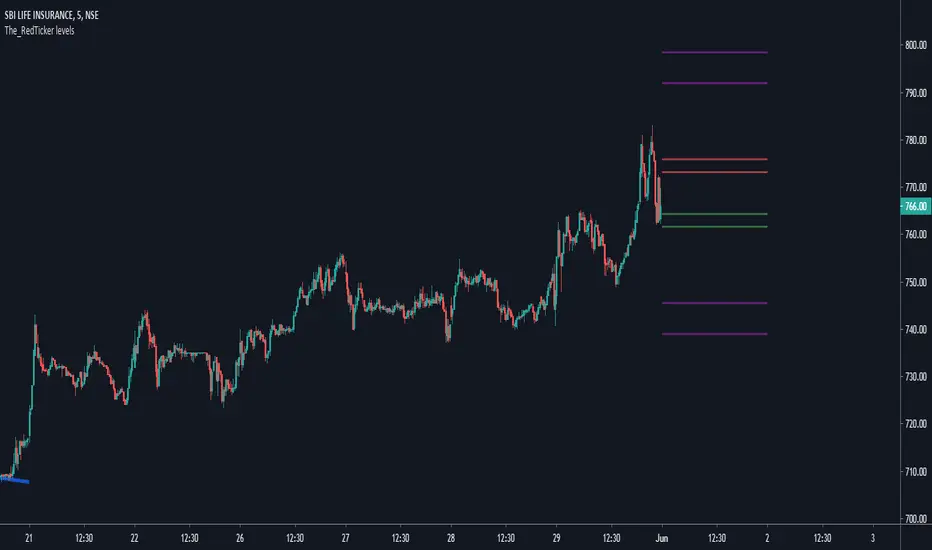
The_Redticker's Intraday IndicatorThis is a simplistic indicator capable of predicting Intraday Reversal regions for almost any chart on NSE/BSE (Indian Stock Exchanges)
Notes for Usage:
Best works when used on both indexes NIFTY and NIFTYBANK simultaneously in correlation. Its easy to understand that correlation, any one using it should spot it in a few days
Also, should only be used on 3 or 5 mins timeframe.
ENTRY:
The Inner regions marked by Red and Green lines are to be used for entries. Can look for both long and short reversal on either zones, can be teamed with other oscillators for better understanding.
Basically, when the CMP enters either Red or Green Zone, look for a long or short entry at the close outside the zone on 3 or 5 mins timeframe with the other side of the zone as stoploss trigger price.
While the Purple line on either side indicates the target zones.
P.s. If entering Short reversal at the Red Zone, then Green zone can also serve as first target and Purple zone as the final target depending on Market momentum. Vice-versa for entry at Long reversal at Green zone too.
Note: This indicator is most of the time absolutely correct, but needs to corrected every few months for VIX change. If and when that is done next will update it to show a NOTE on chart regarding that.
Look at any Index ideas on my profile to see live examples.


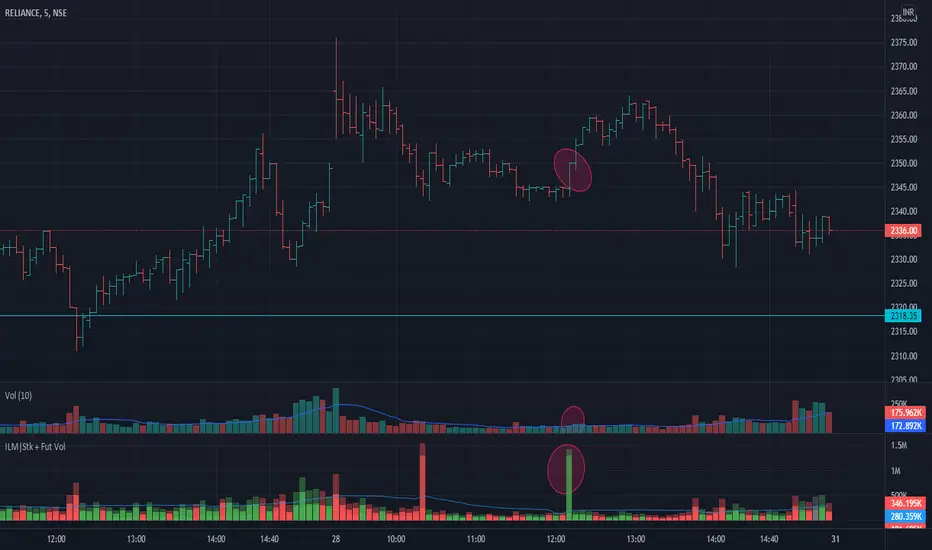
ChartAdvise_Action_ReactionThis script has finetuned the dynamic shifting of prices seen in the previous script.
