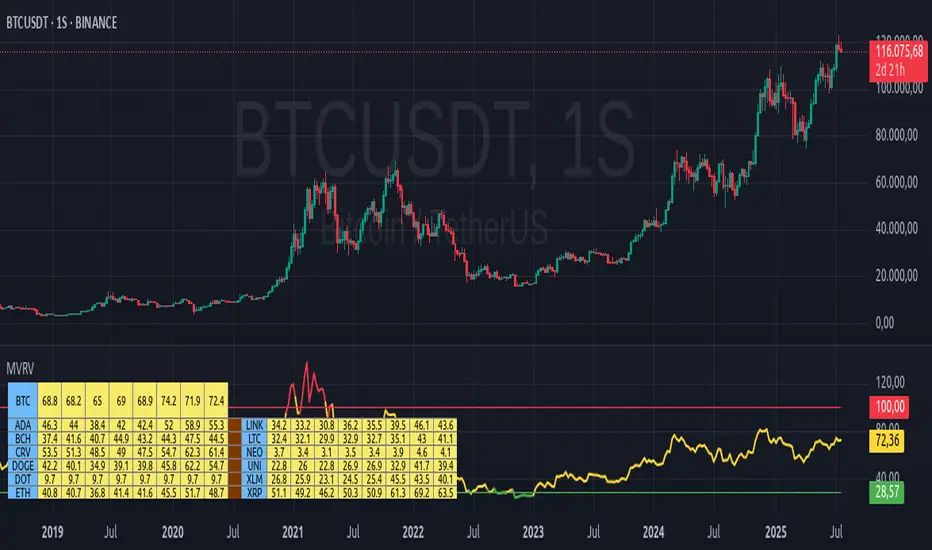
MVRV Altcoins📌 Technical Description of Indicator: MVRV Altcoins
This advanced script calculates the Market Value to Realized Value (MVRV) ratio across multiple cryptocurrencies simultaneously. It offers two analytical modes: Normal and Z-Score, optimized for visual comparison and real-time monitoring of up to 13 predefined assets. If a user applies the indicator to a symbol that is not among the 13 programmed assets, the default behavior displays the Bitcoin chart as a fallback reference.
🔍 What Is MVRV and Why Is It Important?
MVRV is an on-chain metric designed to assess whether a cryptocurrency is overvalued or undervalued by comparing its market capitalization to its realized capitalization.
- Market Cap: The total circulating supply multiplied by the current market price.
- Realized Cap: The sum value of all coins based on the price at the time they last moved on-chain, offering a time-weighted valuation.
Normal Calculation:
MVRV_Normal = Market Cap / Realized Cap
This version reflects investor profitability and identifies potential accumulation or distribution zones.
📊 Z-Score Calculation:
MVRV_ZScore = (Market Cap − Realized Cap) / Standard Deviation of Market Cap
This formula evaluates how extreme the current market conditions are compared to historical norms. It normalizes the difference using statistical dispersion, turning it into a volatility-aware metric that better reflects valuation extremes.
🔎 How Market Cap Is Computed
Unlike conventional indicators relying on consolidated feeds, this script uses modular components from CoinMetrics to construct the active capitalization more accurately, especially for altcoins. Here's the breakdown:
Active Capitalization = MARKETCAPFF + MARKETCAPACTSPLY
Realized Capitalization = MARKETCAPREAL
Component Definitions:
- MARKETCAPFF: Market Cap Free Float — total valuation based only on truly circulating coins.
- MARKETCAPACTSPLY: Capitalization from actively circulating supply — filters dormant or locked coins.
- MARKETCAPREAL: Realized Cap — historical valuation weighted by the last on-chain movement of each coin.
This method offers enhanced precision and compatibility across assets that may lack comprehensive data from centralized providers.
⚙️ User-Configurable Parameters
- MVRV Mode: Choose between Normal and Z-Score.
- Percentage Scale View: If enabled, visual output is scaled using predefined divisors (100 / 3.5 or 100 / 6).
- Thresholds for Analysis:
- Normal mode: Define overbought and oversold levels (default 1.0 and 3.5).
- Z-Score mode: Configure statistical boundaries (default 0.0 and 6.0).
- Table Controls:
- Adjustable position on screen (9 options).
- Font size customization: tiny, small, normal, large.
- Color scheme personalization:
- Header: text and background
- Body: text and background
- Central column separator color
📊 Multicrypto Table Architecture
The indicator renders a high-performance visual table displaying data from up to 13 assets simultaneously. Each asset is represented as a vertical column featuring eigth historical data points plus the most recent value.
- Assets are displayed in two blocks separated by a decorative column.
- Each value is rounded to one decimal place for clarity.
- Cells are styled dynamically based on user settings.
🎨 Decorative Column Separator
Since the entire table is built as a unified structure, a color-configurable empty column is inserted mid-table to act as a visual divider. This approach improves readability and aesthetic balance without duplicating code or splitting table logic.
🔁 Default Behavior on Unsupported Assets
If the active chart is not one of the 13 predefined assets, the indicator will automatically display Bitcoin’s data. This ensures the chart remains functional and informative even outside the target asset group.
🎯 Color Interpretation by Condition
The MVRV value for each asset is highlighted using a traffic light system:
- Green: Undervalued (below oversold threshold)
- Red: Overvalued (above overbought threshold)
- Yellow: Neutral zone
This coding simplifies decision-making and visual scanning across assets.
Final Notes
This indicator is modular and fully adaptable, with well-commented sections designed for efficient customization. Its multiactive architecture makes it a valuable tool for crypto analysts tracking diversified portfolios beyond Bitcoin and Ethereum.
It supports visual storytelling across assets, comparative historical evaluation, and identification of strategic zones — whether for accumulation, distribution, or monitoring on-chain sentiment.
Indicators and strategies
MACD 衰减信号For Max's MACD Decay Signal
A non-repainting signal based on MACD histogram momentum decay combined with price structure divergence. This script helps traders identify potential trend reversal points using multi-wave analysis.
📈 Bullish Signal
Triggered when:
MACD histogram prints three weakening red waves (histogram bars are rising toward zero)
Price makes lower lows, while MACD histogram rises (bullish divergence)
Histogram just turns green
🟢 Label: "MACD多头" appears below the candle
📢 Alert: "MACD 多头信号"
📉 Bearish Signal
Triggered when:
MACD histogram prints three weakening green waves (histogram bars falling toward zero)
Price makes higher highs, while MACD histogram falls (bearish divergence)
Histogram just turns red
🔴 Label: "MACD空头" appears above the candle
📢 Alert: "MACD 空头信号"
⚙️ Features
Adjustable MACD parameters: Fast, Slow, Signal lengths
Uses arrays to track momentum and price shift patterns
Built to avoid repainting, works on all timeframes
Comes with alert conditions for automation or manual notifications
✅ Best For
Catching early trend reversal opportunities
Combining with price action or support/resistance levels
Traders who value momentum + structure-based signals

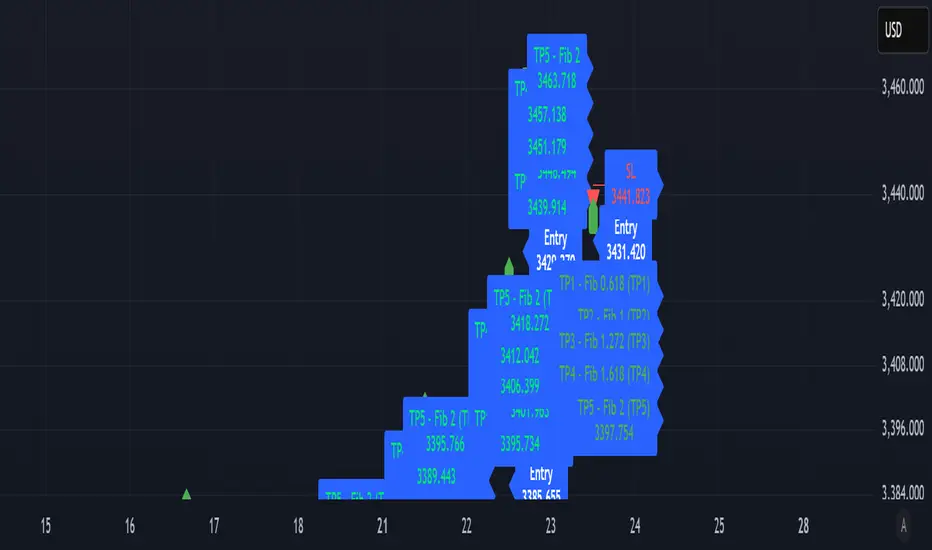
Confirmed Entry Grid Pro//@version=5
indicator("Confirmed Entry Grid Pro", overlay=true,
max_lines_count=500, max_labels_count=500,
title="Confirmed Entry Grid Pro")
// === إعدادات المستخدم ===
showImpulse = input.bool(true, "Show Impulse Wave")
showShrinkWarning = input.bool(true, "Shrink Warning")
minConfirmations = input.int(5, "Minimum Confirmations", minval=3, maxval=10)
// === المتوسطات ===
ma9 = ta.sma(close, 9)
ma21 = ta.sma(close, 21)
ma200 = ta.sma(close, 200)
// === الاتجاه ===
trendBull = close > ma200
trendBear = close < ma200
// === الزخم ===
rsi = ta.rsi(close, 14)
rsiBull = rsi > 50
rsiBear = rsi < 50
// === الحجم ===
volMA = ta.sma(volume, 20)
volHigh = volume > volMA
// === شموع ابتلاعية ===
bullEngulf = close > open and open < close and close > open
bearEngulf = close < open and open > close and close < open
// === بولنجر باند ===
basis = ta.sma(close, 20)
dev = ta.stdev(close, 20)
upper = basis + 2 * dev
lower = basis - 2 * dev
bbBreakUp = close > upper
bbBreakDown = close < lower
// === دعم / مقاومة ديناميكية ===
support = ta.lowest(low, 20)
resistance = ta.highest(high, 20)
nearSupport = math.abs(close - support) / close < 0.015
nearResistance = math.abs(close - resistance) / close < 0.015
// === تقاطع المتوسطات ===
crossUp = ta.crossover(ma9, ma21)
crossDown = ta.crossunder(ma9, ma21)
// === ATR ===
atr = ta.atr(14)
atrActive = atr > ta.sma(atr, 14)
// === SMC: BOS + CHOCH + Impulsive Wave ===
bosUp = high > high and low > low
bosDown = low < low and high < high
chochUp = close > high and close < high
chochDown = close < low and close > low
smcBuy = bosUp and chochUp
smcSell = bosDown and chochDown
// === الموجة الدافعة (مؤشر اختياري لإشارة دخول قوية)
impulseWaveSell = close <= close and close <= close and close <= close and close < open
impulseWave = close >= close and close >= close and close >= close and close > open
// === مناطق السيولة ===
liqHigh = ta.highest(high, 30)
liqLow = ta.lowest(low, 30)
liquidityBuyZone = close < liqLow
liquiditySellZone = close > liqHigh
// === حساب النقاط لكل صفقة ===
buyScore = (trendBull ? 1 : 0) + (rsiBull ? 1 : 0) + (volHigh ? 1 : 0) + (bullEngulf ? 1 : 0) + (smcBuy ? 1 : 0) + (bbBreakUp ? 1 : 0) + (nearSupport ? 1 : 0) + (crossUp ? 1 : 0) + (atrActive ? 1 : 0) + (liquidityBuyZone ? 1 : 0)
sellScore = (trendBear ? 1 : 0) + (rsiBear ? 1 : 0) + (volHigh ? 1 : 0) + (bearEngulf ? 1 : 0) + (smcSell ? 1 : 0) + (bbBreakDown ? 1 : 0) + (nearResistance ? 1 : 0) + (crossDown ? 1 : 0) + (atrActive ? 1 : 0) + (liquiditySellZone ? 1 : 0)
// === شروط الإشارات مع منع التكرار خلال آخر 5 شموع ===
var int lastBuyBar = na
var int lastSellBar = na
canBuy = buyScore >= 5 and impulseWave and (na(lastBuyBar) or bar_index - lastBuyBar > 3)
canSell = sellScore >= 5 and impulseWaveSell and (na(lastSellBar) or bar_index - lastSellBar > 3)
if canBuy
lastBuyBar := bar_index
if canSell
lastSellBar := bar_index
showBuy = canBuy and buyScore >= minConfirmations
showSell = canSell and sellScore >= minConfirmations
// === طول الخطوط ===
var int lineLen = 5
// === رسم الإشارات ===
plotshape(showBuy, title="BUY", location=location.belowbar, style=shape.triangleup, size=size.small, color=color.green)
plotshape(showImpulse and impulseWave, title="Impulsive Buy", location=location.belowbar, style=shape.labelup, size=size.tiny, color=color.lime, text="IB")
plotshape(showSell, title="SELL", location=location.abovebar, style=shape.triangledown, size=size.small, color=color.red)
plotshape(showImpulse and impulseWaveSell, title="Impulsive Sell", location=location.abovebar, style=shape.labeldown, size=size.tiny, color=color.maroon, text="IS")
// === خطوط الصفقة ===
var line buyLines = array.new_line(0)
var line sellLines = array.new_line(0)
if (showBuy)
entry = close
label.new(bar_index, entry, "Entry " + str.tostring(entry, format.mintick), style=label.style_label_left, textcolor=color.white, size=size.normal)
tpLevels = array.from(0.618, 1.0, 1.272, 1.618, 2.0)
for i = 0 to array.size(tpLevels) - 1
fib = array.get(tpLevels, i)
tp = entry + fib * atr
fibLabel = "TP" + str.tostring(i + 1) + " - Fib " + str.tostring(fib)
line = line.new(bar_index, tp, bar_index + lineLen, tp, color=color.green)
label.new(bar_index + lineLen, tp, fibLabel + " " + str.tostring(tp, format.mintick), style=label.style_label_right, textcolor=color.lime, size=size.normal)
array.push(buyLines, line)
sl = entry - 0.618 * atr
slLine = line.new(bar_index, sl, bar_index + lineLen, sl, color=color.red)
label.new(bar_index + lineLen, sl, "SL " + str.tostring(sl, format.mintick), style=label.style_label_right, textcolor=color.red, size=size.normal)
array.push(buyLines, slLine)
if (showSell)
entry = close
label.new(bar_index, entry, "Entry " + str.tostring(entry, format.mintick), style=label.style_label_left, textcolor=color.white, size=size.normal)
tpLevels = array.from(-0.618, -1.0, -1.272, -1.618, -2.0)
for i = 0 to array.size(tpLevels) - 1
fib = array.get(tpLevels, i)
tp = entry + fib * atr
fibLabel = "TP" + str.tostring(i + 1) + " - Fib " + str.tostring(math.abs(fib))
line = line.new(bar_index, tp, bar_index + lineLen, tp, color=color.green)
label.new(bar_index + lineLen, tp, fibLabel + " " + str.tostring(tp, format.mintick), style=label.style_label_right, textcolor=color.green, size=size.normal)
array.push(sellLines, line)
sl = entry + 0.618 * atr
slLine = line.new(bar_index, sl, bar_index + lineLen, sl, color=color.red)
label.new(bar_index + lineLen, sl, "SL " + str.tostring(sl, format.mintick), style=label.style_label_right, textcolor=color.red, size=size.normal)
array.push(sellLines, slLine)
400 EMA 1min and 5min Collision Alert//@version=5
indicator("400 EMA 1min and 5min Collision Alert", overlay=true)
// === Inputs ===
len = input.int(400, title="EMA Length")
threshold = input.float(0.1, title="Collision Threshold", tooltip="Max difference between EMAs to trigger alert")
// === EMAs ===
// 400 EMA on 1-minute timeframe
ema_1min = request.security(syminfo.tickerid, "1", ta.ema(close, len))
// 400 EMA on 5-minute timeframe
ema_5min = request.security(syminfo.tickerid, "5", ta.ema(close, len))
// === Plot EMAs ===
plot(ema_1min, title="400 EMA (1min)", color=color.orange, linewidth=2)
plot(ema_5min, title="400 EMA (5min)", color=color.blue, linewidth=2)
// === Collision Detection ===
collide = math.abs(ema_1min - ema_5min) <= threshold
plotshape(collide, title="Collision!", location=location.abovebar, color=color.red, style=shape.triangleup, size=size.small)
// === Alerts ===
alertcondition(collide, title="EMAs Collide", message="400 EMA (1min) and 400 EMA (5min) have collided.")

Days Since ±1% Move on CloseInterpretation & Use‑Case
The “Days Since ±1% Move” indicator simply tells you how many trading days have passed since the last daily close that moved at least 1% in either direction. Here’s how to put it to work:
Complacency Gauge
A long stretch without a ≥1% move often signals that realized volatility has collapsed and market participants may be under‑positioned for a sudden swing.
Positioning Insight
When institutional hedges and systematic strategies see low recent volatility, they tend to scale back protection (fewer options hedges, tighter risk limits), which can amplify the impact of any eventual volatility pickup.
Mean‑Reversion Signal
After an extended streak (e.g. 20–30 days), a fresh ≥1% move is more likely—and often more violent—because pent‑up positioning flows rush to adjust.
Trend Confirmation
Conversely, a reset in the count (i.e., a new ≥1% move) that coincides with strong volume and follow‑through suggests genuine directional conviction rather than just a volatility “blip.”

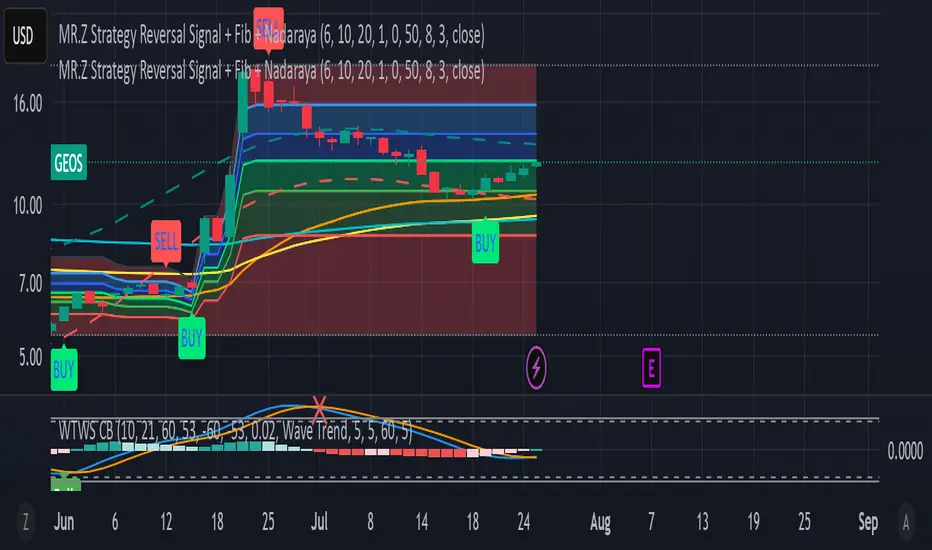
MR.Z Strategy Reversal Signal Nadaraya SMA)Nadaraya-Watson Envelope (NW Envelope):
A smoothed, non-linear dynamic envelope that adapts to price structure. It visually identifies price extremes using kernel regression. The upper and lower bands move with the chart and provide reliable dynamic support and resistance.
EMA Levels:
Includes three key exponential moving averages:
EMA 50 (short-term trend)
EMA 100 (medium-term)
EMA 200 (long-term, institutional level)
Fully Scrollable and Responsive:
All lines and envelopes are plotted using plot() so they move with the chart and respond to zoom and pan actions naturally.
🧠 Ideal Use:
Identify reversal zones, dynamic support/resistance, and trend momentum exhaustion.
Combine WTB and NW Envelope for confluence-based entries.
Use EMA structure for trend confirmation or breakout anticipation.
Let me know if you'd like to add:
Divergence detection
Buy/Sell signals
Alerts or signal filtering options
I’ll be happy to extend the description or the script accordingly!


PRO Investing - Apex EnginePRO Investing - Apex Engine
1. Core Concept: Why Does This Indicator Exist?
Traditional momentum oscillators like RSI or Stochastic use a fixed "lookback period" (e.g., 14). This creates a fundamental problem: a 14-period setting that works well in a fast, trending market will generate constant false signals in a slow, choppy market, and vice-versa. The market's character is dynamic, but most tools are static.
The Apex Engine was built to solve this problem. Its primary innovation is a self-optimizing core that continuously adapts to changing market conditions. Instead of relying on one fixed setting, it actively tests three different momentum profiles (Fast, Mid, and Slow) in real-time and selects the one that is most synchronized with the current price action.
This is not just a random combination of indicators; it's a deliberate synthesis designed to create a more robust momentum tool. It combines:
Volatility analysis (ATR) to generate adaptive lookback periods.
Momentum measurement (ROC) to gauge the speed of price changes.
Statistical analysis (Correlation) to validate which momentum measurement is most effective right now.
Classic trend filters (Moving Average, ADX) to ensure signals are only taken in favorable market conditions.
The result is an oscillator that aims to be more responsive in volatile trends and more stable in quiet periods, providing a more intelligent and adaptive signal.
2. How It Works: The Engine's Three-Stage Process
To be transparent, it's important to understand the step-by-step logic the indicator follows on every bar. It's a process of Adapt -> Validate -> Signal.
Stage 1: Adapt (Dynamic Length Calculation)
The engine first measures market volatility using the Average True Range (ATR) relative to its own long-term average. This creates a volatility_factor. In high-volatility environments, this factor causes the base calculation lengths to shorten. In low-volatility, they lengthen. This produces three potential Rate of Change (ROC) lengths: dynamic_fast_len, dynamic_mid_len, and dynamic_slow_len.
Stage 2: Validate (Self-Optimizing Mode Selection)
This is the core of the engine. It calculates the ROC for all three dynamic lengths. To determine which is best, it uses the ta.correlation() function to measure how well each ROC's movement has correlated with the actual bar-to-bar price changes over the "Optimization Lookback" period. The ROC length with the highest correlation score is chosen as the most effective profile for the current moment. This "active" mode is reflected in the oscillator's color and the dashboard.
Stage 3: Signal (Normalized Velocity Oscillator)
The winning ROC series is then normalized into a consistent oscillator (the Velocity line) that ranges from -100 (extreme oversold) to +100 (extreme overbought). This ensures signals are comparable across any asset or timeframe. Signals are only generated when this Velocity line crosses its signal line and the trend filters (explained below) give a green light.
3. How to Use the Indicator: A Practical Guide
Reading the Visuals:
Velocity Line (Blue/Yellow/Pink): The main oscillator line. Its color indicates which mode is active (Fast, Mid, or Slow).
Signal Line (White): A moving average of the Velocity line. Crossovers generate potential signals.
Buy/Sell Triangles (▲ / ▼): These are your primary entry signals. They are intentionally strict and only appear when momentum, trend, and price action align.
Background Color (Green/Red/Gray): This is your trend context.
Green: Bullish trend confirmed (e.g., price above a rising 200 EMA and ADX > 20). Only Buy signals (▲) can appear.
Red: Bearish trend confirmed. Only Sell signals (▼) can appear.
Gray: No clear trend. The market is likely choppy or consolidating. No signals will appear; it is best to stay out.
Trading Strategy Example:
Wait for a colored background. A green or red background indicates the market is in a tradable trend.
Look for a signal. For a green background, wait for a lime Buy triangle (▲) to appear.
Confirm the trade. Before entering, confirm the signal aligns with your own analysis (e.g., support/resistance levels, chart patterns).
Manage the trade. Set a stop-loss according to your risk management rules. An exit can be considered on a fixed target, a trailing stop, or when an opposing signal appears.
4. Settings and Customization
This script is open-source, and its settings are transparent. You are encouraged to understand them.
Synaptic Engine Group:
Volatility Period: The master control for the adaptive engine. Higher values are slower and more stable.
Optimization Lookback: How many bars to use for the correlation check.
Switch Sensitivity: A buffer to prevent frantic switching between modes.
Advanced Configuration & Filters Group:
Price Source: The data source for momentum calculation (default close).
Trend Filter MA Type & Length: Define your long-term trend.
Filter by MA Slope: A key feature. If ON, allows for "buy the dip" entries below a rising MA. If OFF, it's stricter, requiring price to be above the MA.
ADX Length & Threshold: Filters out non-trending, choppy markets. Signals will not fire if the ADX is below this threshold.
5. Important Disclaimer
This indicator is a decision-support tool for discretionary traders, not an automated trading system or financial advice. Past performance is not indicative of future results. All trading involves substantial risk. You should always use proper risk management, including setting stop-losses, and never risk more than you are prepared to lose. The signals generated by this script should be used as one component of a broader trading plan.

Liquidity Factor Spectrum [Modified by Markking77]Liquidity Spectrum Visualizer — Modified Version
This script “Liquidity Spectrum Visualizer ” is an open-source tool originally created by BigBeluga under the Creative Commons Attribution-NonCommercial-ShareAlike 4.0 International (CC BY-NC-SA 4.0) license.
Modified & Refactored by: Markking77
This version has been factorized and slightly modified to ensure unique functionality and better performance while respecting the original license terms.
Key Features:
Liquidity levels with adaptive calculation.
Volume Profile histogram for easy demand/supply zones.
Smart Volume Bubbles for quick visual insight.
Clear color coding for uptrend/downtrend zones.
Factorized code for improved readability.
License: Creative Commons Attribution-NonCommercial-ShareAlike 4.0 International (CC BY-NC-SA 4.0)
Original Author: BigBeluga
Modified & Published By: Markking77
This script is provided for educational purposes only and can be freely reused or modified under the same license, with proper credit to the original author and modifier.

Combined Entry Signal - SMI + MACD + EMA + Volume//@version=5
indicator("Combined Entry Signal - SMI + MACD + EMA + Volume", overlay=true)
// ==== INPUTS ====
smiK = input.int(5, "SMI K", minval=1)
smiD = input.int(3, "SMI D", minval=1)
macdFast = input.int(12, "MACD Fast")
macdSlow = input.int(26, "MACD Slow")
macdSignal = input.int(9, "MACD Signal")
emaShort = input.int(20, "EMA Short")
emaMid = input.int(50, "EMA Mid")
emaLong = input.int(100, "EMA Long")
volMult = input.float(1.2, "Volume Multiplier for Confirm")
// ==== SMI ====
smiSource = close
smi = ta.stoch(close, high, low, smiK)
smiSignal = ta.sma(smi, smiD)
// ==== MACD ====
= ta.macd(close, macdFast, macdSlow, macdSignal)
macdCrossUp = ta.crossover(macdLine, signalLine)
macdCrossDown = ta.crossunder(macdLine, signalLine)
// ==== EMA Trend ====
emaS = ta.ema(close, emaShort)
emaM = ta.ema(close, emaMid)
emaL = ta.ema(close, emaLong)
trendUp = close > emaS and emaS > emaM and emaM > emaL
trendDown = close < emaS and emaS < emaM and emaM < emaL
// ==== Volume confirmation ====
avgVol = ta.sma(volume, 20)
volConfirm = volume > avgVol * volMult
// ==== BUY/SELL CONDITIONS ====
smiBuy = smi > smiSignal and smi < 20
smiSell = smi < smiSignal and smi > 80
buySignal = smiBuy and macdCrossUp and trendUp and volConfirm
sellSignal = smiSell and macdCrossDown and trendDown and volConfirm
// ==== PLOTS ====
plotshape(buySignal, title="Buy Signal", location=location.belowbar, color=color.green, style=shape.labelup, text="BUY")
plotshape(sellSignal, title="Sell Signal", location=location.abovebar, color=color.red, style=shape.labeldown, text="SELL")
plot(emaS, title="EMA 20", color=color.orange)
plot(emaM, title="EMA 50", color=color.green)
plot(emaL, title="EMA 100", color=color.blue)

Gabriel's Dynamic Sentiment RSI📊 Dynamic Sentiment RSI with Velocity, Acceleration & Divergence Detection
Created by GabrielAmadeusLau
This advanced Pine Script indicator fuses multiple layers of market insight into a unified momentum and sentiment tool. It is designed to extract nuanced sentiment signals from price action using a hybridized RSI model enhanced with stochastic dynamics, volatility weighting, and divergence tracking. It adapts to a wide range of asset classes including equities, crypto, gold, and forex.
🔍 Core Components
✅ 1. Dynamic Sentiment RSI
A normalized, stochastic-based RSI that adjusts its sensitivity using the Sentiment Factor.
Smoothed using a Jurik Moving Average for precision noise filtering.
Weighted using volume, volatility (VIX-like), HL extremes, and trend-based adaptive weighting, giving it a powerful multi-dimensional response.
✅ 2. Hann-Window RSI Calculation
Leverages a Hann Window and Levy Flight transformation to amplify cyclical behavior in RSI inputs.
Applies power-based weighting to directional movement, ideal for assets with cyclic or fractal-like structure.
✅ 3. Velocity & Acceleration Engine
Measures the rate of RSI change over a customizable period, and then the rate of that rate (acceleration).
Both are plotted with adaptive coloring to visually represent momentum shifts.
This dynamic structure aids in anticipating breakout strength or exhaustion.
✅ 4. Sentiment Heat Background
Background shading reflects bullish (teal) or bearish (silver) sentiment using smoothed stochastic RSI outputs.
Creates an intuitive market "mood" indicator for quick-glance visual analysis.
🔁 Smoothing & Weighting Customizations
You can toggle between different weighting modes:
Volume Weighted: Uses volume or ATR if unavailable.
VIX Weighted: Incorporates a volatility-based weight via a WVF-like formula.
HL Weighted: High-Low range smoothed.
Linear Weighted: Applies linear regression to the signal.
Trend Adaptive: Squares rolling maximums/minimums for dynamic strength adaptation.
🔎 Divergence Detection System
Supports Regular & Hidden Divergence using any of the following pivots:
Raw RSI
Smoothed K% RSI
Sentiment RSI
Velocity
Acceleration
Allows divergence tracking on custom timeframes and Heikin Ashi data.
Custom line styles, colors, and optional “last signal only” visibility.
Alerts are provided for all four divergence types.
📌 Built-in Alerts
✅ Bullish/Bearish Regular Divergence
✅ Bullish/Bearish Hidden Divergence
✅ General Divergence Summary Alerts
⚙️ Highly Configurable Settings
Sentiment Factor scaling (default ~2.2)
Levy exponent (ideal between 0.4 to 3.2 depending on asset class)
Velocity & Acceleration scaling inputs
Pivot lookback controls
Toggle smoothing methods and weighting logic
🧠 Ideal Use Cases
Swing and Trend Trading: The dynamic structure identifies both trend continuations and reversals with precision.
Divergence Confirmation: Confirm entries or exits using regular/hidden divergence alongside acceleration/velocity overlays.
Adaptive Strategy Building: Integrate this tool as a sentiment engine for algorithmic trading strategies.
🔬 Recommended Settings by Asset Class
Asset Type Levy Sentiment Factor
Crypto 0.6–1.2 2.0–2.5
Gold 0.4–1.0 2.0–2.2
Stocks 0.9–1.2 2.2–2.5
Forex 2.5–3.2 1.8–2.3
*A sentiment Factor of 9.5 can tell the larger trend apart on Daily and up.*
🧩 Technical Notes
Uses Jurik MA (Power 2, Phase 50) for minimal lag smoothing.
Employs Chebyshev filters (pre-Stochastic) for advanced sentiment smoothing.
Weighted RSI is normalized from -100 to 100, with color-coded velocity and acceleration histograms.

The Visualized Trader (Fractal Timeframe)The **The Visualized Trader (Fractal Timeframe)** indicator for TradingView is a tool designed to help traders identify strong bullish or bearish trends by analyzing multiple technical indicators across two timeframes: the current chart timeframe and a user-selected higher timeframe. It visually displays trend alignment through arrows on the chart and a condition table in the top-right corner, making it easy to see when conditions align for potential trade opportunities.
### Key Features
1. **Multi-Indicator Analysis**: Combines five technical conditions to confirm trend direction:
- **Trend**: Based on the slope of the 50-period Simple Moving Average (SMA). Upward slope indicates bullish, downward indicates bearish.
- **Stochastic (Stoch)**: Uses Stochastic Oscillator (5, 3, 2) to measure momentum. Rising values suggest bullish momentum, falling values suggest bearish.
- **Momentum (Mom)**: Derived from the MACD fast line (5, 20, 30). Rising MACD line indicates bullish momentum, falling indicates bearish.
- **Dad**: Uses the MACD signal line. Rising signal line is bullish, falling is bearish.
- **Price Change (PC)**: Compares the current close to the previous close. Higher close is bullish, lower is bearish.
2. **Dual Timeframe Comparison**:
- Calculates the same five conditions on both the current timeframe and a user-selected higher timeframe (e.g., daily).
- Helps traders see if the trend on the higher timeframe aligns with the current chart, providing context for stronger trade decisions.
3. **Visual Signals**:
- **Arrows on Chart**:
- **Current Timeframe**: Blue upward arrows below bars for bullish alignment, red downward arrows above bars for bearish alignment.
- **Higher Timeframe**: Green upward triangles below bars for bullish alignment, orange downward triangles above bars for bearish alignment.
- Arrows appear only when all five conditions align (all bullish or all bearish), indicating strong trend potential.
4. **Condition Table**:
- Displays a table in the top-right corner with two rows:
- **Top Row**: Current timeframe conditions (Trend, Stoch, Mom, Dad, PC).
- **Bottom Row**: Higher timeframe conditions (labeled with "HTF").
- Each cell is color-coded: green for bullish, red for bearish.
- The table can be toggled on/off via input settings.
5. **User Input**:
- **Show Condition Boxes**: Toggle the table display (default: on).
- **Comparison Timeframe**: Choose the higher timeframe (e.g., "D" for daily, default setting).
### How It Works
- The indicator evaluates the five conditions on both timeframes.
- When all conditions are bullish (or bearish) on a given timeframe, it plots an arrow/triangle to signal a strong trend.
- The condition table provides a quick visual summary, allowing traders to compare the current and higher timeframe trends at a glance.
### Use Case
- **Purpose**: Helps traders confirm strong trend entries by ensuring multiple indicators align across two timeframes.
- **Example**: If you're trading on a 1-hour chart and see blue arrows with all green cells in the current timeframe row, plus green cells in the higher timeframe (e.g., daily) row, it suggests a strong bullish trend supported by both timeframes.
- **Benefit**: Reduces noise by focusing on aligned signals, helping traders avoid weak or conflicting setups.
### Settings
- Access the indicator settings in TradingView to:
- Enable/disable the condition table.
- Select a higher timeframe (e.g., 4H, D, W) for comparison.
### Notes
- Best used in trending markets; may produce fewer signals in choppy conditions.
- Combine with other analysis (e.g., support/resistance) for better decision-making.
- The higher timeframe signals (triangles) provide context, so prioritize trades where both timeframes align.
This indicator simplifies complex trend analysis into clear visual cues, making it ideal for traders seeking confirmation of strong momentum moves.

Elliott Wave Probability SystemAdvanced Elliott Wave analysis system with AI-powered probability calculations for price targets. Combines multiple technical indicators to generate high-probability trading signals with specific price objectives.
🎯 KEY FEATURES:
- Automatic Elliott Wave pattern detection
- Dynamic Fibonacci retracement & extension levels
- Probability-weighted price targets (up to 10 levels)
- Multi-indicator confluence scoring system
- Real-time probability calculations
- Visual wave projections with success rates
- Comprehensive status dashboard
📊 TECHNICAL INDICATORS INTEGRATED:
- Elliott Wave pattern recognition
- Fibonacci levels (0-261.8%)
- RSI momentum analysis
- MACD trend confirmation
- Stochastic oscillator
- Volume spike detection
- Weighted scoring algorithm
💡 PROBABILITY ENGINE:
- Calculates target probabilities based on:
- Current wave position
- Technical indicator alignment
- Volume confirmation
- Market structure
- Updates in real-time
- Adjusts for market conditions
🎨 VISUAL ELEMENTS:
- Wave connection lines
- Fibonacci grid with prices
- Probability table with 5-10 targets
- Color-coded signal strength
- Status dashboard
- Target projection lines
🔧 CUSTOMIZATION:
- Adjustable wave detection period
- Number of price targets (3-10)
- Toggle visual elements
- Custom color schemes
- Flexible indicator parameters
📈 TRADING METHODOLOGY:
- Entry: High probability targets + confluence
- Exit: Target completion or signal reversal
- Risk: Use Fibonacci levels for stops
- Position sizing: Based on probability %
Perfect for traders seeking objective, probability-based price targets using Elliott Wave theory combined with technical confirmation.
⚡ ALERTS INCLUDED:
- Strong buy/sell signals
- Target approach notifications
- Wave completion alerts
Correlating AI Agent coded by ITECS .

SOL RSI Divergence DetectorAdvanced RSI indicator with automatic divergence detection for cryptocurrency trading. Identifies both regular and hidden divergences with visual markers directly on the RSI oscillator.
🎯 KEY FEATURES:
- Automatic detection of bullish and bearish divergences
- Visual divergence lines connecting pivot points
- Clear labels marking divergence types
- Hidden divergence detection for trend continuation
- Customizable overbought/oversold levels
- Real-time status panel with trading signals
- Highlighted divergence zones
- Multiple alert conditions
📊 DIVERGENCE TYPES DETECTED:
- Regular Bullish: Price LL, RSI HL (reversal up)
- Regular Bearish: Price HH, RSI LH (reversal down)
- Hidden Bullish: Price HL, RSI LL (trend continuation up)
- Hidden Bearish: Price LH, RSI HH (trend continuation down)
💡 TRADING SIGNALS:
- Strong Buy: Bullish divergence + RSI oversold
- Strong Sell: Bearish divergence + RSI overbought
- Trend continuation signals with hidden divergences
🔧 CUSTOMIZATION:
- Adjustable RSI length and levels
- Toggle divergence types on/off
- Customize colors and visual elements
- Flexible lookback periods
Perfect for crypto traders seeking reliable reversal and continuation signals based on momentum divergences.
Correlating AI Agent coded by ITECS .

Order Block + Liquidity Sniper by TradingNexus🧠 Order Block + Liquidity Sniper by TradingNexus
📌 How the Indicator Works – Explanation of Visual Elements
🔺 Triangles – Liquidity Sniper Signals
Green triangle below candle (▲): This is a Bullish Liquidity Sniper Signal. It indicates that price swept liquidity below a Swing Low, triggering stop-losses, and then returned back above a bullish Order Block zone. This suggests potential institutional buying interest and could mark a strong buy opportunity.
Red triangle above candle (▼): This is a Bearish Liquidity Sniper Signal. It shows that price swept above a Swing High to collect liquidity and then returned below a bearish Order Block zone. This implies possible institutional selling after a liquidity hunt and may signal a short entry.
🟢 Circles – Order Block Zones
Green circle (●): Represents a Bullish Order Block area – typically the last bearish candle before a strong bullish move. Price returning to this zone may react due to renewed institutional buying.
Red circle (●): Marks a Bearish Order Block – the last bullish candle before a strong bearish move. These zones may act as resistance when price revisits.
✖️ Crosses – Liquidity Zones
Purple cross (+): Identifies a Swing High liquidity level – a short-term high where many stop-loss orders are likely clustered.
Orange cross (+): Marks a Swing Low liquidity zone – a key area where stop orders from long positions may reside.
This indicator seeks precise institutional-style entries by detecting when price:
Sweeps liquidity at a recent swing high or low;
Then reacts from a valid Order Block zone.
The triangle markers highlight potential Sniper entries, while circles and crosses help visualize the key zones that underpin these moves.
Use this tool to improve timing, context, and confidence in your trades – especially when combining with SMC or price action frameworks.
Built by TradingNexus – designed for price action traders who use Smart Money Concepts (SMC).

Trend Impulse Channels [With Simple MA]Trend Impulse Channels + MA | Premium Modified Version
This is a **premium modified version** of the original **Trend Impulse Channels** script by **Zeiierman**, enhanced and republished by **Markking77**.
This version includes a clean **Moving Average (MA)** overlay to add extra trend confirmation.
*What’s New:**
- MA overlay for better trend visibility.
- All original trend impulse logic retained.
- Clean, customizable signals for retests & trend steps.
- Fully adjustable style for premium look.
Original Script Info:**
- **Original Author:** © Zeiierman
- **Modified & Published by:** © Markking77
- **License:** (creativecommons.org)
**Disclaimer:**
This script is **for educational purposes only** and not financial advice. Always do your own research and trade responsibly.

God's Plan 7.2 - FVGP EnhancedThis is a buy/sell indicator containing the code for the Top Bottom indicator, VWAP and 9 EMA.
Buy conditions are Top Bottom buy and 9 EMA crossing above the VWAP.
Sell conditions are Top Bottom sell and 9 EMA crossing below the VWAP.
C signals indicate continuations.
Zero TOD constraints.
This is a simple strategy to help train the eye to recognize trend shifts and potential entries.
It is important for the users of this strategy to use their own logic when determining stop loss and targets.
Thank you to all of the coders and creators that have provided us with inspiration for this strategy. Happy trading!


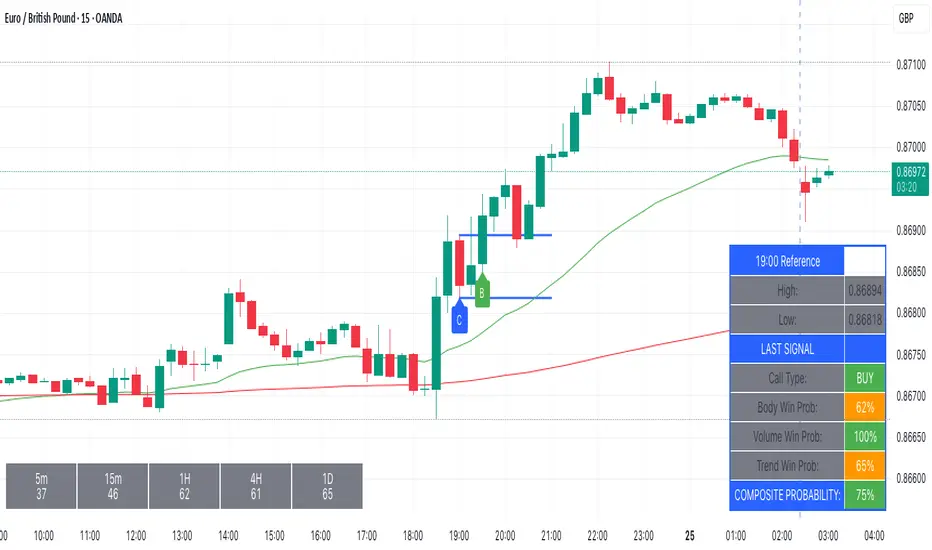
Kairos BarakahTrade with precision during high-probability windows using this advanced Pine Script indicator, designed specifically for Indian Standard Time (IST). The tool identifies key reversal opportunities within a user-defined trading session, combining time-based reference levels, sequence-validated signals, and multi-factor win probability analysis for confident decision-making.
Key Features
1. Time-Based Reference Levels
Automatically sets high/low reference levels at a customizable start time (default: 19:00 IST).
Active trading window with adjustable duration (default: 135 minutes).
Clear visual reference lines for easy tracking.
2. Intelligent Signal Generation
Initial Signals:
Buy (B): Triggered when price closes above the reference high.
Sell (S): Triggered when price closes below the reference low.
Reversal Signals (R):
Valid only after an initial signal, ensuring proper sequence.
Buy Reversal: Price closes above reference high (after a Sell signal).
Sell Reversal: Price closes below reference low (after a Buy signal).
3. Multi-Dimensional Win Probability
Body Strength: Measures candle conviction (body size / total range).
Volume Confirmation: Compares current volume to 20-period average.
Trend Alignment: Uses EMA crosses (9/21) and RSI (14) for momentum.
Composite Score: Weighted blend of all factors, color-coded for quick interpretation:
🟢 >70%: High-confidence signal.
🟠 40-69%: Moderate confidence.
🔴 <40%: Weak signal.
4. Professional Visualization
Clean labels (B/S/R) at signal points.
Real-time reference table showing levels, active signal, and probabilities.
Customizable alerts for all signal types.
Why Use This Indicator?
IST-Optimized: Tailored for Indian market hours.
Rules-Based Reversals: Avoids false signals with strict sequence checks.
Data-Driven Confidence: Win probability metrics reduce guesswork.
Flexible Setup: Adjust time windows and parameters to fit your strategy.
SMC Core Concepts TradingNexus (BOS, CHoCH, FVG, OB) - Stage 1🔍 SMC Core Concepts TradingNexus – Stage 1 (BOS, CHoCH, FVG, OB)
Smart Money Concepts made visual and accessible.
This indicator helps traders identify key institutional structures such as Break of Structure (BOS), Change of Character (CHoCH), Fair Value Gaps (FVG), and Order Blocks (OB) – all automatically detected and visualized on the chart.
✅ Features in Stage 1:
🔹 BOS Detection – Detects bullish and bearish structure breaks based on swing points
🔹 CHoCH Identification – Spots potential change of character after a trend
🔹 Fair Value Gap Zones – Highlights imbalances between candles
🔹 Order Block Zones – Detects key OB zones before strong price moves
🔹 Smart Auto-Cleanup – Automatically removes old boxes to optimize performance
🔹 User Inputs – Configure swing sensitivity and toggle each feature
🧠 Built for Traders Seeking Clarity
This script is ideal for SMC traders who want clear structure-based setups without drawing everything manually. Designed for both scalpers and swing traders who follow institutional logic.
🚀 Stage 2 (Coming Soon):
Liquidity zones (EQH/EQL)
Internal vs. external BOS
Mitigation blocks
Bias detection
Buy/Sell signal system
Smart SL/TP zones
Alerts system
👤 Created by TradingNexus
💬 Open-source & community-driven. Feel free to fork, contribute, or suggest improvements.

Buyer/Seller Zone (Simplified Version)📌 Indicator: Buyer/Seller Zone (Simplified Version)
This indicator is designed to highlight potential areas of strong buyer or seller activity based on advanced volume and volatility analysis. It identifies key candles that exhibit anomalous behavior — those standing out from typical market noise — and marks them as potential interest zones.
🔍 What it does:
Detects candles with unusually high volume (anomalies).
Filters them further based on strong price movement (volatility).
Marks bullish and bearish zones using customizable visuals: area, circle, or diamond.
Provides optional alerts when a buyer/seller signal is detected.
💡 How to use:
Use this tool to identify potential reversal or continuation zones.
Zones may act as strong support/resistance areas.
Some levels are more significant than others — do not trade every level blindly. Combine with your own analysis or wait for a retest/confirmation before entry.
⚙️ Customization:
Volume filter threshold
Volatility sensitivity
Visualization type, size, and transparency
🚨 Alerts: Set alerts for bullish, bearish, or any signal type.

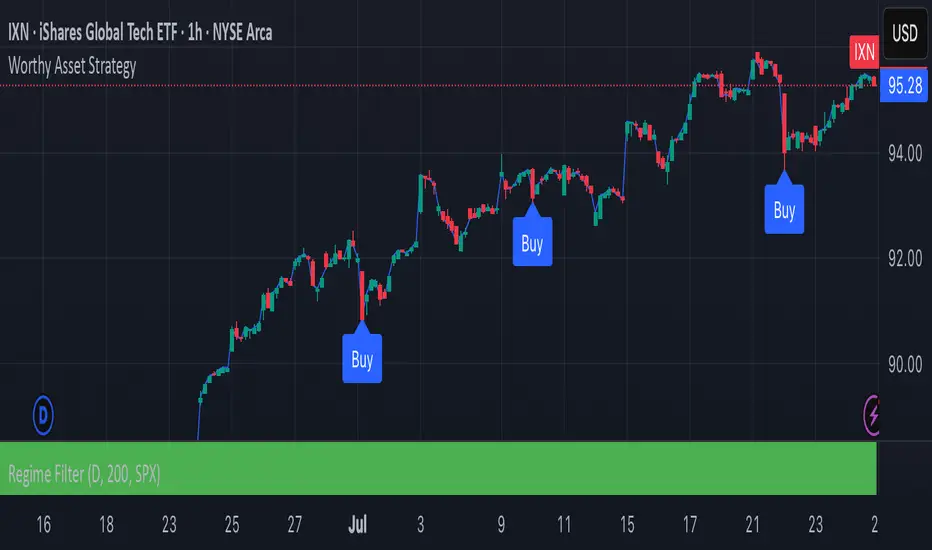
Worthy Asset StrategyThis strategy is designed with a two-part philosophy: a regime filter and a value-based accumulation approach.
🟩 Regime Filter:
If the S&P 500 (SPX) is trading above its 200-period EMA, a green background is shown below the chart, signaling a favorable market regime.
If the SPX is below the 200 EMA, the background turns red, indicating a less favorable environment.
📉 Buy Signals:
Buy signals are generated by red candles that drop a certain percentage from their open — essentially treating these pullbacks as discount opportunities.
The idea is to accumulate more of a selected asset when it becomes temporarily cheaper.
💎 Philosophy & Execution:
I only apply this strategy to assets I’ve personally researched and believe to be fundamentally valuable.
If a Buy signal occurs and the SPX is trading above its 200 EMA (i.e., the background is green), I enter the position.
Once in the trade, I follow this logic:
If the position reaches +1.5% profit, I sell it.
If it doesn’t reach profit and goes into a loss, I simply hold.
I don’t sell at a loss because I believe in the long-term value of the asset.
If the price drops further, I accumulate more — aiming to lower my average cost and eventually exit at a profit once the asset recovers.
This approach is based on the mindset of treating drawdowns as discounts, not danger.
"The more it drops, the more I accumulate — because I see value, not risk."
This is still a work in progress, and I’m actively refining it over time.
⚠️ Note: The sell logic is not yet visible on the chart and will be added in a future update.