RSI Long Only with Confirmed CrossbacksThis RSI-based long-only strategy aims to identify and trade potential reversals with confirmation to reduce false signals. It enters a long position only after the Relative Strength Index (RSI) first dips below a specified oversold threshold (default 44) and then crosses back above it, signaling a possible bullish reversal with momentum. The strategy avoids premature entries by requiring this two-step confirmation. Similarly, it exits the long position only after RSI first rises above the overbought threshold (default 70) and then crosses back below it, indicating a potential loss of bullish momentum. By waiting for RSI to travel beyond the thresholds and then revert, the strategy attempts to capture stronger and more reliable directional moves while filtering out temporary spikes.
Indicators and strategies

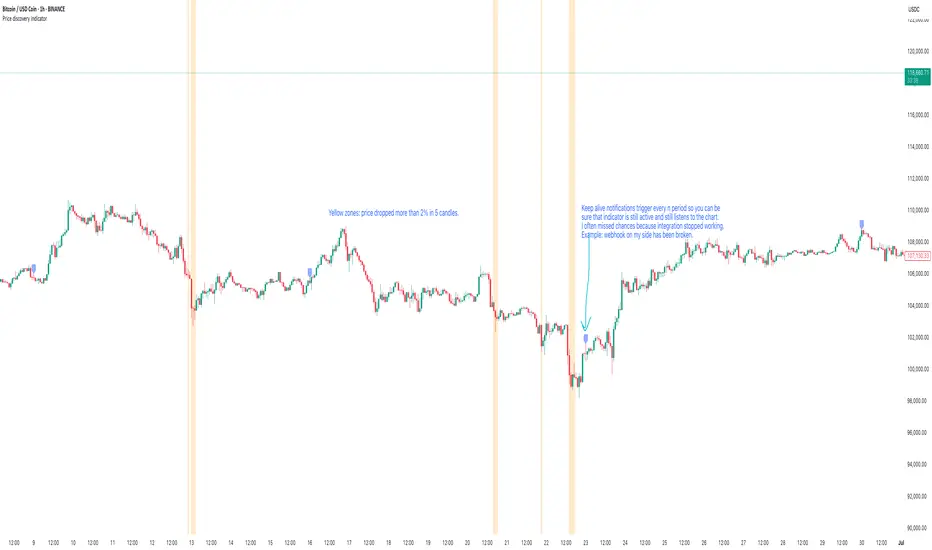
Price discovery indicatorGives an ability to show places where price drops more than n percent in x candles. Use cases: see dips of btc, get a notification when a stablecoin goes crazy, validate that webhook integration works as expected using keep alive messages.
Features included:
- Price dip alerts. Create an alert that sends a notification every time price dips more than expected (yellow zone at the chart).
- Percentage drop threshold. Define how many percents price should drop to trigger an alert and to show a yellow zone.
- Candles length threshold. Define within how many candles this drop should happen. If price drops in 2% within 10 candles, but this option is 5 - the alert will not be triggered because price dropped not as fast as expected.
- Templates of messages on price dip and price recovery. Set your message that should be triggered with alert.
- Keep alive feature. Set to trigger keep alive alerts every period. Can be helpful if you don't check charts often - this feature will trigger alert every period with "hey, the integration is alive" message. I use it to validate on weekly basis that tradingview triggers my alerts (example: you created an alert with expiration date and forgot to recreate it), that webhook integration receives these alerts, that the integration sends these alerts to telegram. Example: I expect to see this message every monday's morning, otherwise something is broken and I have to check what is wrong with my alerting system.
EMA Strength V2This indicator plots a single Exponential Moving Average (EMA) line whose color changes based on a comparison with a second EMA. The user can customize both EMA lengths and choose separate price sources (like close, hlc3, etc.) for each EMA.
The line turns green when EMA 1 is greater than EMA 2, indicating bullish momentum, and red when EMA 1 is less than EMA 2, signaling potential bearishness. This dynamic coloring helps traders visually track trend strength and possible reversals.

Stock Table📊 Professional Stock Market Table - Pine Script v5
🎯 Overview
This is a comprehensive, real-time stock monitoring table designed for TradingView that transforms your chart into a professional trading dashboard. Built with Pine Script v5, it displays live market data for up to 10 customizable securities in an organized, color-coded table format.
________________________________________
🚀 Core Capabilities
📈 Real-Time Data Processing
• Live Price Feeds: Direct integration with TradingView's request.security() function
• Multi-Timeframe Support: Adapts to any chart timeframe automatically
• Instant Updates: Refreshes on every bar close with current market data
• Cross-Market Coverage: Supports stocks, forex, crypto, indices, commodities
• Data Accuracy: Uses lookahead=barmerge.lookahead_off for historical accuracy
🎨 Advanced Visual Customization
• 9 Strategic Positions: Place anywhere on chart (all corners, centers, middle positions)
• Dynamic Layout: 1-5 column configurations with auto-calculating rows
• 4 Size Options: Tiny, Small, Normal, Large text sizing
• Professional Color Scheme: Customizable background, headers, text colors
• Smart Color Coding: Green/red price change indicators with neutral states
📊 Intelligent Table Structure
• Auto-Responsive Design: Table dimensions adjust based on column count
• Professional Headers: Optional Symbol | Price | Change column headers
• Compact Data Display: Symbol name, current price, absolute & percentage change
• Clean Formatting: Precise decimal places, proper alignment, readable layout
• Error Handling: Handles null data, division by zero, invalid symbols gracefully
________________________________________
🔧 Technical Specifications
Data Architecture
- Stock Data Arrays: Dynamic string and float arrays for efficient data management
- Security Requests: Individual request.security() calls for each symbol
- Real-time Processing: Uses barstate.islast for optimal performance
- Memory Management: Efficient array operations with proper cleanup
Performance Optimizations
• Conditional Rendering: Only processes data on the latest bar
• Efficient Memory Usage: Clears and rebuilds table data on each update
• Minimal Resource Impact: Lightweight code structure with no unnecessary loops
• Fast Execution: Direct data access without complex calculations
Symbol Processing
• Exchange Extraction: Automatically removes exchange prefixes (NASDAQ:, NYSE:)
• Clean Display Names: Shows only ticker symbols (AAPL, GOOGL, etc.)
• Flexible Input: Accepts any TradingView-supported symbol format
• Error Resilience: Continues operation even if some symbols fail
________________________________________
🎛️ User Controls & Settings
Securities Configuration
• 10 Customizable Slots: Input any combination of stocks, ETFs, crypto, forex
• Global Market Support: Works with any TradingView-supported instrument
• Easy Symbol Changes: Simple dropdown interface for quick modifications
• Default Professional Portfolio: Pre-loaded with major tech and financial stocks
Layout Customization
Position Options:
├── Top: Left, Center, Right
├── Middle: Left, Center, Right
└── Bottom: Left, Center, Right
Column Configurations:
├── 1 Column: 10 rows (vertical list)
├── 2 Columns: 5 rows (balanced view)
├── 3 Columns: 4 rows (compact display)
├── 4 Columns: 3 rows (wide format)
└── 5 Columns: 2 rows (ultra-wide)
Visual Customization
• Background Control: Transparency settings (0-90%)
• Header Styling: Toggle headers with custom colors
• Text Appearance: Four size options with color controls
• Change Indicators: Separate colors for up/down movements
• Professional Theming: Dark theme optimized for trading environments
________________________________________
💼 Professional Trading Advantages
Market Monitoring
✅ Multi-Asset Oversight: Monitor diverse portfolios in one view
✅ Quick Performance Scan: Instant visual identification of winners/losers
✅ Real-Time Alerts: Color changes provide immediate market feedback
✅ Space Efficient: Minimal chart real estate usage
✅ Always Visible: Persistent display regardless of chart zooming
Decision Making Support
✅ Comparative Analysis: Side-by-side performance comparison
✅ Trend Recognition: Immediate color-coded trend identification
✅ Portfolio Balance: Quick assessment of position performance
✅ Market Correlation: Observe sector movements simultaneously
✅ Risk Management: Rapid identification of adverse movements
Workflow Integration
✅ Chart Integration: Seamlessly blends with existing chart analysis
✅ Non-Intrusive: Doesn't interfere with technical analysis
✅ Customizable Placement: Adapts to any chart layout preference
✅ Professional Appearance: Suitable for client presentations
✅ Multi-Monitor Setup: Works perfectly on secondary displays
________________________________________
🔬 Technical Implementation Details
Pine Script Architecture
Data Flow:
Input Symbols → Security Requests → Data Processing → Table Creation → Visual Rendering
Key Functions:
├── get_name(): Symbol parsing and cleaning
├── get_table_position(): Dynamic positioning system
├── get_table_size(): Responsive sizing control
├── Array Management: Efficient data storage and retrieval
└── Table Operations: Creation, clearing, and population
Security & Reliability
• Error Handling: Comprehensive null checks and data validation
• Fallback Systems: Graceful degradation for missing data
• Performance Monitoring: Optimized for minimal CPU usage
• Memory Safety: Proper array cleanup and resource management
• Version Compatibility: Built for Pine Script v5 standards
Advanced Features
• Dynamic Calculations: Real-time percentage and absolute change computation
• Conditional Formatting: Context-aware color application
• Responsive Design: Auto-adjusting layout based on configuration
• Professional Typography: Optimized text sizing and spacing
• Cross-Platform Compatibility: Works on all TradingView platforms
________________________________________
📱 Use Cases & Applications
Day Trading
• Monitor watchlist stocks during active trading sessions
• Quick identification of breakout opportunities
• Real-time portfolio performance tracking
• Sector rotation analysis
Portfolio Management
• Long-term investment monitoring
• Diversification balance assessment
• Performance comparison across holdings
• Risk exposure evaluation
Market Analysis
• Sector strength comparison
• Market correlation studies
• Index component analysis
• Cross-asset performance review
Professional Trading
• Client portfolio dashboards
• Trading room displays
• Educational presentations
• Research and analysis support
________________________________________
🎯 Competitive Advantages
Versus Standard Watchlists
✅ Visual Integration: Embedded directly in charts
✅ Customizable Layout: Flexible positioning and sizing
✅ Professional Appearance: Trading-room quality display
✅ Real-Time Updates: Immediate price and change updates
Versus External Tools
✅ No Additional Software: Built into TradingView platform
✅ Synchronized Data: Uses same data source as charts
✅ Customizable Symbols: Not limited to pre-defined lists
✅ Cost Effective: No additional subscription fees
Versus Basic Pine Scripts
✅ Professional Quality: Production-ready code standards
✅ Error Resilience: Comprehensive error handling
✅ User-Friendly: Intuitive settings and controls
✅ Performance Optimized: Minimal resource consumption
________________________________________
🔧 Installation & Setup
Quick Start
1. Copy Pine Script code to TradingView Pine Editor
2. Add to chart - table appears with default settings
3. Customize symbols through indicator settings
4. Adjust position and appearance as needed
Optimization Tips
• Position table to avoid interfering with chart analysis
• Use 2-3 columns for optimal readability
• Choose contrasting colors for better visibility
• Regular symbol updates for current market focus
________________________________________
This Professional Stock Market Table represents a complete solution for serious traders and investors who demand real-time, customizable, and visually integrated market monitoring directly within their chart analysis workflow. 📊🚀

EMA StrengthThis indicator plots a single Exponential Moving Average (EMA) line whose color changes based on a comparison with a second EMA. The user can customize both EMA lengths and choose separate price sources (like close, hlc3, etc.) for each EMA.
The line turns green when EMA 1 is greater than EMA 2, indicating bullish momentum, and red when EMA 1 is less than EMA 2, signaling potential bearishness. This dynamic coloring helps traders visually track trend strength and possible reversals.

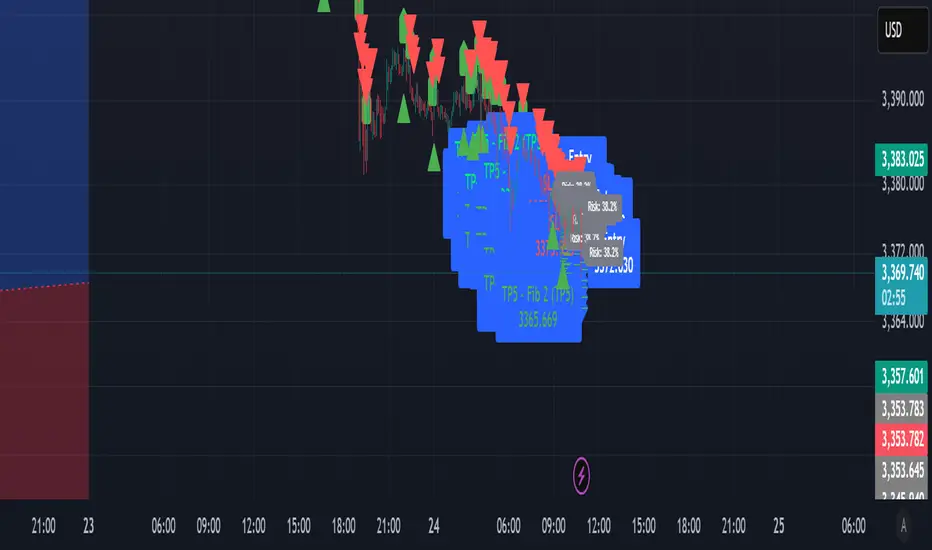
Confirmed Entry Grid Pro//@version=5
indicator("Confirmed Entry Grid Pro", overlay=true)
// === المتوسطات ===
ma9 = ta.sma(close, 9)
ma21 = ta.sma(close, 21)
ma200 = ta.sma(close, 200)
// === الاتجاه ===
trendBull = close > ma200
trendBear = close < ma200
// === الزخم ===
rsi = ta.rsi(close, 14)
rsiBull = rsi > 50
rsiBear = rsi < 50
// === الحجم ===
volMA = ta.sma(volume, 20)
volHigh = volume > volMA
// === شموع ابتلاعية ===
bullEngulf = close > open and open < close and close > open
bearEngulf = close < open and open > close and close < open
// === بولنجر باند ===
basis = ta.sma(close, 20)
dev = ta.stdev(close, 20)
upper = basis + 2 * dev
lower = basis - 2 * dev
bbBreakUp = close > upper
bbBreakDown = close < lower
// === دعم / مقاومة ديناميكية ===
support = ta.lowest(low, 20)
resistance = ta.highest(high, 20)
nearSupport = math.abs(close - support) / close < 0.015
nearResistance = math.abs(close - resistance) / close < 0.015
// === تقاطع المتوسطات ===
crossUp = ta.crossover(ma9, ma21)
crossDown = ta.crossunder(ma9, ma21)
// === ATR ===
atr = ta.atr(14)
atrActive = atr > ta.sma(atr, 14)
// === SMC: BOS + CHOCH ===
bosUp = high > high and low > low
bosDown = low < low and high < high
chochUp = close > high and close < high
chochDown = close < low and close > low
smcBuy = bosUp and chochUp
smcSell = bosDown and chochDown
// === مناطق السيولة ===
liqHigh = ta.highest(high, 30)
liqLow = ta.lowest(low, 30)
liquidityBuyZone = close < liqLow
liquiditySellZone = close > liqHigh
// === حساب النقاط لكل صفقة ===
buyScore = (trendBull ? 1 : 0) + (rsiBull ? 1 : 0) + (volHigh ? 1 : 0) + (bullEngulf ? 1 : 0) + (smcBuy ? 1 : 0) + (bbBreakUp ? 1 : 0) + (nearSupport ? 1 : 0) + (crossUp ? 1 : 0) + (atrActive ? 1 : 0) + (liquidityBuyZone ? 1 : 0)
sellScore = (trendBear ? 1 : 0) + (rsiBear ? 1 : 0) + (volHigh ? 1 : 0) + (bearEngulf ? 1 : 0) + (smcSell ? 1 : 0) + (bbBreakDown ? 1 : 0) + (nearResistance ? 1 : 0) + (crossDown ? 1 : 0) + (atrActive ? 1 : 0) + (liquiditySellZone ? 1 : 0)
// === شروط الإشارات مع منع التكرار خلال آخر 5 شموع ===
var int lastBuyBar = na
var int lastSellBar = na
canBuy = buyScore >= 5 and (na(lastBuyBar) or bar_index - lastBuyBar > 5)
canSell = sellScore >= 5 and (na(lastSellBar) or bar_index - lastSellBar > 5)
if canBuy
lastBuyBar := bar_index
if canSell
lastSellBar := bar_index
showBuy = canBuy
showSell = canSell
// === طول الخطوط ===
var int lineLen = 5
// === رسم الإشارات ===
plotshape(showBuy, title="BUY", location=location.belowbar, style=shape.triangleup, size=size.small, color=color.green)
plotshape(showSell, title="SELL", location=location.abovebar, style=shape.triangledown, size=size.small, color=color.red)
// === خطوط الصفقة ===
var line buyLines = array.new_line(0)
var line sellLines = array.new_line(0)
if (showBuy)
entry = low
label.new(bar_index, entry, "Entry " + str.tostring(entry, format.mintick), style=label.style_label_left, textcolor=color.white, size=size.normal)
tpLevels = array.new_float(5)
array.set(tpLevels, 0, 0.618)
array.set(tpLevels, 1, 1.0)
array.set(tpLevels, 2, 1.272)
array.set(tpLevels, 3, 1.618)
array.set(tpLevels, 4, 2.0)
slLevel = -0.618
for i = 0 to 4
fibLabel = "TP" + str.tostring(i + 1) + " - Fib " + str.tostring(array.get(tpLevels, i))
tp = entry + array.get(tpLevels, i) * atr
line = line.new(bar_index, tp, bar_index + lineLen, tp, color=color.green)
label.new(bar_index + lineLen, tp, fibLabel + " (TP" + str.tostring(i + 1) + ") " + str.tostring(tp, format.mintick), style=label.style_label_right, textcolor=color.lime, size=size.normal)
array.push(buyLines, line)
sl = entry + slLevel * atr
slLine = line.new(bar_index, sl, bar_index + lineLen, sl, color=color.red)
label.new(bar_index + lineLen, sl, "SL " + str.tostring(sl, format.mintick), style=label.style_label_right, textcolor=color.red, size=size.normal)
array.push(buyLines, slLine)
if (showSell)
entry = high
label.new(bar_index, entry, "Entry " + str.tostring(entry, format.mintick), style=label.style_label_left, textcolor=color.white, size=size.normal)
tpLevels = array.new_float(5)
array.set(tpLevels, 0, -0.618)
array.set(tpLevels, 1, -1.0)
array.set(tpLevels, 2, -1.272)
array.set(tpLevels, 3, -1.618)
array.set(tpLevels, 4, -2.0)
slLevel = 0.618
for i = 0 to 4
fibLabel = "TP" + str.tostring(i + 1) + " - Fib " + str.tostring(math.abs(array.get(tpLevels, i)))
tp = entry + array.get(tpLevels, i) * atr
line = line.new(bar_index, tp, bar_index + lineLen, tp, color=color.green)
label.new(bar_index + lineLen, tp, fibLabel + " (TP" + str.tostring(i + 1) + ") " + str.tostring(tp, format.mintick), style=label.style_label_right, textcolor=color.green, size=size.normal)
array.push(sellLines, line)
sl = entry + slLevel * atr
slLine = line.new(bar_index, sl, bar_index + lineLen, sl, color=color.red)
label.new(bar_index + lineLen, sl, "SL " + str.tostring(sl, format.mintick), style=label.style_label_right, textcolor=color.red, size=size.normal)
array.push(sellLines, slLine)
// === متابعة نتائج الصفقة ===
// تحقق نجاح الصفقة (وصل أول TP)
buyHitTP = showBuy and high >= low + 0.618 * atr
sellHitTP = showSell and low <= high - 0.618 * atr
// تحقق فشل الصفقة (ضرب SL)
buyHitSL = showBuy and low <= low - 0.618 * atr
sellHitSL = showSell and high >= high + 0.618 * atr
// رسم الإشارة
plotshape(buyHitTP, title="Buy Success", style=shape.labelup, location=location.abovebar, color=color.green, size=size.small)
plotshape(sellHitTP, title="Sell Success", style=shape.labelup, location=location.abovebar, color=color.green, size=size.small)
plotshape(buyHitSL, title="Buy Failed", style=shape.labeldown, location=location.abovebar, color=color.red, size=size.small)
plotshape(sellHitSL, title="Sell Failed", style=shape.labeldown, location=location.abovebar, color=color.red, size=size.small)
Momentum Candle ProjectionThis indicator projects future price momentum by calculating a directional vector from recent price movements. It uses a custom implementation of the atan2 function to create a vector average of the last N candles and visualizes this projection as a synthetic future candle.
🔍 What It Does:
✅ Tracks recent momentum using geometric vectors from price change.
✅ Projects a synthetic "momentum candle" one bar ahead, showing anticipated direction and magnitude.
✅ Optionally plots a secondary "future candle" based on a smoothed estimate of projected price vs. real current close.
⚙️ Settings:
Vector Lookback (bars): Controls how many bars are used to calculate the momentum vector.
Projection Length Multiplier: Adjusts how far forward the vector is projected based on its strength.
🟢 How To Use:
Use the lime/red projection candle to anticipate short-term directional bias.
Use the orange/maroon future candle to compare projected continuation vs. current closing price.
Spot early reversals, continuation zones, and momentum decay in real-time.

Anomalías en Rendimientos LogarítmicosLogarithmic Returns Anomalies
This indicator detects unusual or extreme movements in the logarithmic returns of price data, helping to identify atypical market events.
It calculates the moving average and standard deviation of logarithmic returns over a configurable period, and visually highlights when the return deviates significantly from the average using thresholds based on multiples of the standard deviation.
Features:
Identifies high and low anomalies in logarithmic returns.
Clear visualization with lines for the mean and upper/lower thresholds.
Circle markers highlight anomalies in a separate pane.
Customizable parameters to adjust indicator sensitivity.
Ideal for quantitative traders and technical analysts looking to spot sharp changes or unusual behavior in financial assets.

Confirmed Entry Grid Pro//@version=5
indicator("Confirmed Entry Grid Pro", overlay=true)
// === المتوسطات ===
ma9 = ta.sma(close, 9)
ma21 = ta.sma(close, 21)
ma200 = ta.sma(close, 200)
// === الاتجاه ===
trendBull = close > ma200
trendBear = close < ma200
// === الزخم ===
rsi = ta.rsi(close, 14)
rsiBull = rsi > 50
rsiBear = rsi < 50
// === الحجم ===
volMA = ta.sma(volume, 20)
volHigh = volume > volMA
// === شموع ابتلاعية ===
bullEngulf = close > open and open < close and close > open
bearEngulf = close < open and open > close and close < open
// === بولنجر باند ===
basis = ta.sma(close, 20)
dev = ta.stdev(close, 20)
upper = basis + 2 * dev
lower = basis - 2 * dev
bbBreakUp = close > upper
bbBreakDown = close < lower
// === دعم / مقاومة ديناميكية ===
support = ta.lowest(low, 20)
resistance = ta.highest(high, 20)
nearSupport = math.abs(close - support) / close < 0.015
nearResistance = math.abs(close - resistance) / close < 0.015
// === تقاطع المتوسطات ===
crossUp = ta.crossover(ma9, ma21)
crossDown = ta.crossunder(ma9, ma21)
// === ATR ===
atr = ta.atr(14)
atrActive = atr > ta.sma(atr, 14)
// === SMC: BOS + CHOCH ===
bosUp = high > high and low > low
bosDown = low < low and high < high
chochUp = close > high and close < high
chochDown = close < low and close > low
smcBuy = bosUp and chochUp
smcSell = bosDown and chochDown
// === مناطق السيولة ===
liqHigh = ta.highest(high, 30)
liqLow = ta.lowest(low, 30)
liquidityBuyZone = close < liqLow
liquiditySellZone = close > liqHigh
// === حساب النقاط لكل صفقة ===
buyScore = (trendBull ? 1 : 0) + (rsiBull ? 1 : 0) + (volHigh ? 1 : 0) + (bullEngulf ? 1 : 0) + (smcBuy ? 1 : 0) + (bbBreakUp ? 1 : 0) + (nearSupport ? 1 : 0) + (crossUp ? 1 : 0) + (atrActive ? 1 : 0) + (liquidityBuyZone ? 1 : 0)
sellScore = (trendBear ? 1 : 0) + (rsiBear ? 1 : 0) + (volHigh ? 1 : 0) + (bearEngulf ? 1 : 0) + (smcSell ? 1 : 0) + (bbBreakDown ? 1 : 0) + (nearResistance ? 1 : 0) + (crossDown ? 1 : 0) + (atrActive ? 1 : 0) + (liquiditySellZone ? 1 : 0)
// === شروط الإشارات مع منع التكرار خلال آخر 5 شموع ===
var int lastBuyBar = na
var int lastSellBar = na
canBuy = buyScore >= 5 and (na(lastBuyBar) or bar_index - lastBuyBar > 5)
canSell = sellScore >= 5 and (na(lastSellBar) or bar_index - lastSellBar > 5)
if canBuy
lastBuyBar := bar_index
if canSell
lastSellBar := bar_index
showBuy = canBuy
showSell = canSell
// === طول الخطوط ===
var int lineLen = 5
// === رسم الإشارات ===
plotshape(showBuy, title="BUY", location=location.belowbar, style=shape.triangleup, size=size.small, color=color.green)
plotshape(showSell, title="SELL", location=location.abovebar, style=shape.triangledown, size=size.small, color=color.red)
// === خطوط الصفقة ===
var line buyLines = array.new_line(0)
var line sellLines = array.new_line(0)
if (showBuy)
entry = low
tpLevels = array.new_float(5)
array.set(tpLevels, 0, 0.618)
array.set(tpLevels, 1, 1.0)
array.set(tpLevels, 2, 1.272)
array.set(tpLevels, 3, 1.618)
array.set(tpLevels, 4, 2.0)
slLevel = -0.618
for i = 0 to 4
tp = entry + array.get(tpLevels, i) * atr
line = line.new(bar_index, tp, bar_index + lineLen, tp, color=color.green)
array.push(buyLines, line)
sl = entry + slLevel * atr
slLine = line.new(bar_index, sl, bar_index + lineLen, sl, color=color.red)
array.push(buyLines, slLine)
if (showSell)
entry = high
tpLevels = array.new_float(5)
array.set(tpLevels, 0, -0.618)
array.set(tpLevels, 1, -1.0)
array.set(tpLevels, 2, -1.272)
array.set(tpLevels, 3, -1.618)
array.set(tpLevels, 4, -2.0)
slLevel = 0.618
for i = 0 to 4
tp = entry + array.get(tpLevels, i) * atr
line = line.new(bar_index, tp, bar_index + lineLen, tp, color=color.green)
array.push(sellLines, line)
sl = entry + slLevel * atr
slLine = line.new(bar_index, sl, bar_index + lineLen, sl, color=color.red)
array.push(sellLines, slLine)
// === نسبة المخاطرة ===
label.new(bar_index, showBuy ? low : na, "Risk: 38.2%", style=label.style_label_left, textcolor=color.white, size=size.tiny, color=color.gray)
label.new(bar_index, showSell ? high : na, "Risk: 38.2%", style=label.style_label_left, textcolor=color.white, size=size.tiny, color=color.gray)

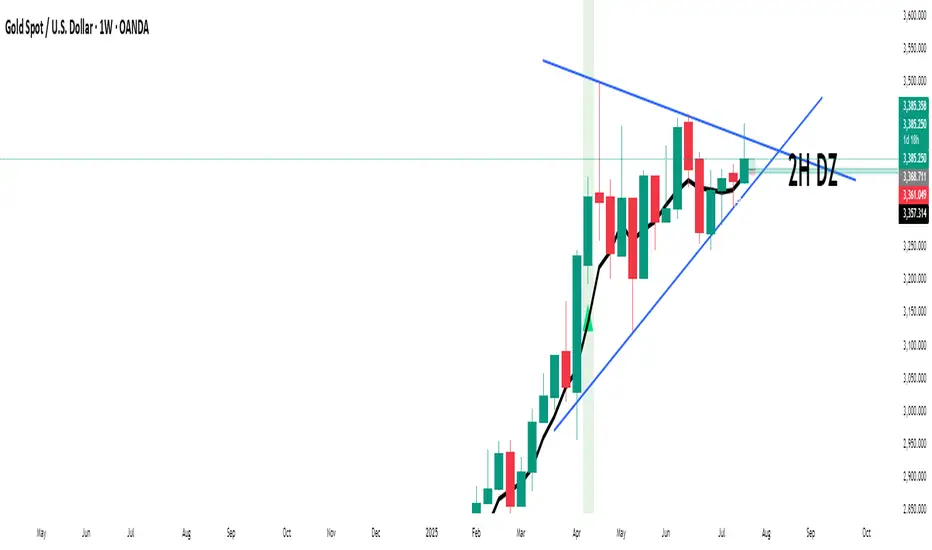
Gold vs DXYThe 30-day rolling correlation between Gold (XAU/USD) and the US Dollar Index (DXY) shows how closely the two move together — or more often, in opposite directions — over the last 30 trading days. In most market environments, the relationship is pretty straightforward: when the dollar goes up, gold tends to go down, and vice versa. That’s because gold is priced in dollars, so a stronger dollar makes it more expensive for international buyers, which usually softens demand.
But it’s not always that simple. There are times when this inverse correlation breaks down. For example, if real yields (like the US 10-year yield minus inflation expectations) are rising, that can pressure gold even if the dollar is falling — because higher real returns elsewhere make gold less attractive. Another case is when other currencies, like the euro or yen, rally strongly on their own central bank decisions. This can pull DXY lower without necessarily signaling weakness in the U.S. economy — meaning gold might not benefit much.
There are also “risk-on” moments where investors rotate into equities or crypto, selling off both gold and the dollar in favor of yield or momentum. And during periods of crisis or uncertainty, both gold and the dollar can rise together as safe-haven assets, breaking the usual pattern entirely.
That’s why tracking the rolling correlation is helpful. It shows whether the historical relationship between gold and the dollar is still holding — or if we’re entering a different market regime. It’s not about predicting exact price moves, but about understanding the current backdrop. When gold and DXY are moving out of sync as expected, it can support your trade thesis. But when the correlation flattens or flips, it’s often a sign to dig deeper — macro forces may be shifting.

Capitalizedmoney HTF Structure + Trend// === How It Works ===
// This script detects swing highs and lows on a higher timeframe (HTF),
// draws trendlines between recent swing points,
// and identifies the overall HTF trend as Bullish, Bearish, or Neutral.
// A label updates every 10 bars, showing the current HTF trend direction.
// Useful for aligning lower timeframe trades with higher timeframe structure.

Cross-Correlation Lead/Lag AnalyzerCross-Correlation Lead/Lag Analyzer (XCorr)
Discover which instrument moves first with advanced cross-correlation analysis.
This indicator analyzes the lead/lag relationship between any two financial instruments using rolling cross-correlation at multiple time offsets. Perfect for pairs trading, market timing, and understanding inter-market relationships.
Key Features:
Universal compatibility - Works with any two symbols (stocks, futures, forex, crypto, commodities)
Multi-timeframe analysis - Automatically adjusts lag periods based on your chart timeframe
Real-time correlation table - Shows current correlation values for all lag scenarios
Visual lead/lag detection - Color-coded plots make it easy to spot which instrument leads
Smart "Best" indicator - Automatically identifies the strongest relationship
How to Use:
Set your symbols in the indicator settings (default: NQ1! vs RTY1!)
Adjust correlation length (default: 20 periods for smooth but responsive analysis)
Watch the colored lines:
• Red/Orange: Symbol 2 leads Symbol 1 by 1-2 periods
• Blue: Instruments move simultaneously
• Green/Purple: Symbol 1 leads Symbol 2 by 1-2 periods
Check the table for exact correlation values and the "Best" relationship
Interpreting Results:
Correlation > 0.7: Strong positive relationship
Correlation 0.3-0.7: Moderate relationship
Correlation < 0.3: Weak/no relationship
Highest line indicates the optimal timing relationship
Popular Use Cases:
Index Futures : NQ vs ES, RTY vs IWM
Sector Rotation : XLF vs XLK, QQQ vs SPY
Commodities : GC vs SI, CL vs NG
Currency Pairs : EURUSD vs GBPUSD
Crypto : BTC vs ETH correlation analysis
Technical Notes:
Cross-correlation measures linear relationships between two time series at different time lags. This implementation uses Pearson correlation with adjustable periods, calculating correlations from -2 to +2 period offsets to detect leading/lagging behavior.
Perfect for quantitative analysts, pairs traders, and anyone studying inter-market relationships.

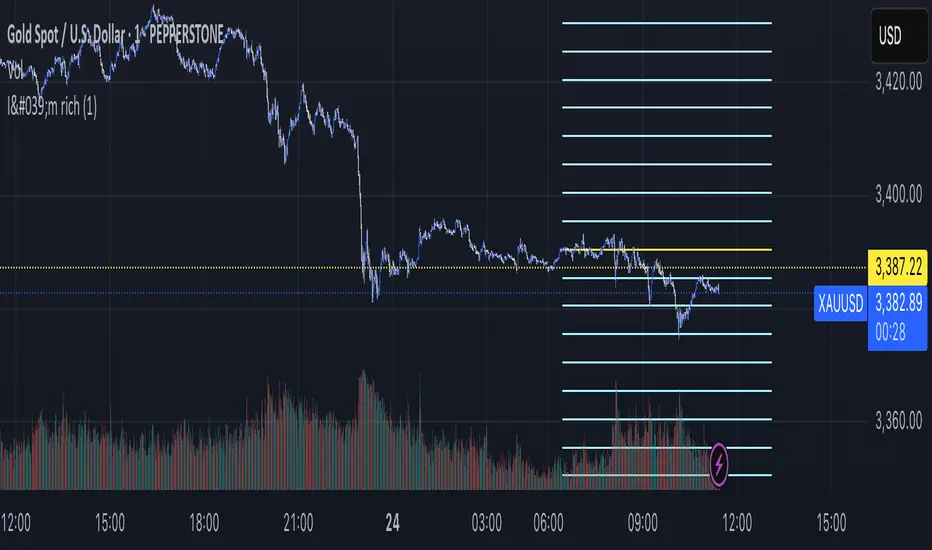
XAUUSD Scalper Levels (ChatGPT v2.5)The Pine v6 indicator plots predefined short/long trading zones and breakout levels on XAUUSD, watches for price entering those zones or crossing the breakout lines, and when that happens it builds a formatted message (entry, SL, up to three TPs, and an invalidation note) plus a risk-based lot size calculated from your equity, risk %, and contract value; it then fires an `alert()` with that message and, on the last bar, shows a floating label displaying the next-trade lot suggestion.

Confirmed Entry Signal (10 Methods)//@version=5
indicator("Confirmed Entry Signal (10 Methods)", overlay=true)
// === المتوسطات ===
ma9 = ta.sma(close, 9)
ma21 = ta.sma(close, 21)
ma200 = ta.sma(close, 200)
// === الاتجاه ===
trendBull = close > ma200
trendBear = close < ma200
// === الزخم (RSI) ===
rsi = ta.rsi(close, 14)
rsiBull = rsi > 50
rsiBear = rsi < 50
// === الحجم ===
volMA = ta.sma(volume, 20)
volHigh = volume > volMA
// === الشموع الابتلاعية ===
bullEngulf = close > open and close > open and open < close
bearEngulf = close < open and close < open and open > close
// === بولنجر باند ===
basis = ta.sma(close, 20)
dev = ta.stdev(close, 20)
upper = basis + 2 * dev
lower = basis - 2 * dev
bbBreakUp = close > upper
bbBreakDown = close < lower
// === دعم / مقاومة ديناميكية ===
support = ta.lowest(low, 20)
resistance = ta.highest(high, 20)
nearSupport = math.abs(close - support) / close < 0.015
nearResistance = math.abs(close - resistance) / close < 0.015
// === تقاطع المتوسطات ===
crossUp = ta.crossover(ma9, ma21)
crossDown = ta.crossunder(ma9, ma21)
// === ATR (التقلب) ===
atr = ta.atr(14)
atrActive = atr > ta.sma(atr, 14)
// === SMC: CHOCH + BOS ===
// BOS: كسر القمة أو القاع السابق (بسيطة)
bosUp = high > high and low > low
bosDown = low < low and high < high
// CHOCH: انعكاس الاتجاه (تغيير هيكلي)
chochUp = close > high and close < high
chochDown = close < low and close > low
// === تجميع التأكيدات ===
buyConfirm = 0
sellConfirm = 0
buyConfirm := buyConfirm + (trendBull ? 1 : 0)
buyConfirm := buyConfirm + (rsiBull ? 1 : 0)
buyConfirm := buyConfirm + (volHigh ? 1 : 0)
buyConfirm := buyConfirm + (bullEngulf ? 1 : 0)
buyConfirm := buyConfirm + ((bosUp and chochUp) ? 1 : 0)
buyConfirm := buyConfirm + (bbBreakUp ? 1 : 0)
buyConfirm := buyConfirm + (nearSupport ? 1 : 0)
buyConfirm := buyConfirm + (crossUp ? 1 : 0)
buyConfirm := buyConfirm + (atrActive ? 1 : 0)
sellConfirm := sellConfirm + (trendBear ? 1 : 0)
sellConfirm := sellConfirm + (rsiBear ? 1 : 0)
sellConfirm := sellConfirm + (volHigh ? 1 : 0)
sellConfirm := sellConfirm + (bearEngulf ? 1 : 0)
sellConfirm := sellConfirm + ((bosDown and chochDown) ? 1 : 0)
sellConfirm := sellConfirm + (bbBreakDown ? 1 : 0)
sellConfirm := sellConfirm + (nearResistance ? 1 : 0)
sellConfirm := sellConfirm + (crossDown ? 1 : 0)
sellConfirm := sellConfirm + (atrActive ? 1 : 0)
// === شرط ظهور الصفقة المؤكدة (5 تأكيدات على الأقل) ===
showBuy = buyConfirm >= 5
showSell = sellConfirm >= 5
// === عرض الإشارات على الشارت ===
plotshape(showBuy, title="BUY Signal", location=location.belowbar, style=shape.labelup, size=size.small, color=color.black)
plotshape(showSell, title="SELL Signal", location=location.abovebar, style=shape.labeldown, size=size.small, color=color.black)

Impulse Alert - Demand (Buy) [Fixed]🔵 Impulse Alert – Demand (Buy)
This indicator is designed to detect high-probability Demand Zones based on impulsive bullish price action, helping traders get alerted only when it matters most.
🧠 Core Logic:
Scans the chart for 2 consecutive bullish impulsive candles with significant range (body size)
Also captures single large bullish impulse candles that often mark institutional buying
Marks the origin of the move as a potential Demand Zone
Sends alerts when such bullish setups form, allowing you to monitor charts passively
⚙️ Features:
✅ Alerts on impulsive move formations
✅ Detects both 2-candle and single-candle impulses
✅ Custom zone detection logic based on pip size and momentum
✅ Cleaner & smarter: removes distractions and avoids false signals
📌 Best Used For:
Smart Money / Supply & Demand traders
Identifying potential institutional buy zones
Executing trades with HTF confluence
Traders who want to get alerted without screen-watching
🔁 Suggested Strategy:
Set HTF directional bias (H1, H4, D1)
Use this indicator on LTF (1M–15M) for impulsive bullish entries
Wait for price to return to the marked zone for low-risk entries
💡 Pro Tip: Combine with your Supply Zone (Sell) indicator to track both sides of market structure and increase R:R
👤 Created by: Rohit Jadhav | YT/Insta/X - @GrowthByTrading
📬 Want updates, enhancements, or personal versions? Leave feedback or reach out through profile!
WaveTrend with CrossesWaveTrend with Crosses — Spot Golden & Dead Crosses with Precision!
WaveTrend with Crosses is a customized version of the classic WaveTrend oscillator, enhanced with clean visual signals to help you pinpoint momentum shifts through golden and dead crosses.
✅ Key Features
Momentum analysis based on WaveTrend (WT1 & WT2)
Detects Golden Cross (WT1 crosses above WT2) and
Dead Cross (WT1 crosses below WT2)
Customizable Overbought/Oversold zones (defaults: ±60, ±53)
Visual circle markers on valid crossovers for easy recognition
Built-in alert system to notify you of real-time cross signals
📊 How to Use
Add the indicator to your chart and choose your desired symbol & timeframe.
The blue shaded area shows the divergence between WT1 and WT2 — a visual cue for momentum buildup.
Circle markers:
Red circle: Dead cross — potential bearish momentum
Green circle: Golden cross — potential bullish reversal
Customize the settings to fit your personal trading strategy if needed.
🛠 User Inputs
n1, n2: Channel lengths (default: 10 and 21)
obLevel, osLevel: Overbought/Oversold thresholds (default: ±60 / ±53)
standardValue: Threshold used to validate significant crossovers (default: 60)
🔔 Alert System
Get notified with alerts like "Golden Cross" or "Dead Cross" when key crossovers occur,
helping you react quickly and confidently.
⚠️ Notes
Past performance is not indicative of future results — always backtest and use in conjunction with other tools.
Low timeframes may generate frequent signals; filtering or confirmation is recommended.
💡 Author's Note
Simple and effective — this tool is designed to focus solely on cross-based entries.
Ideal for momentum-based scalping or swing trading strategies.
Feel free to customize and tweak as needed! 😄

فلتر فني كامل - تنبيه بيع وشراء//@version=5
indicator("فلتر فني كامل - تنبيه بيع وشراء", overlay=true)
// إعدادات المتوسطات
ema50 = ta.ema(close, 50)
ema200 = ta.ema(close, 200)
// مؤشر القوة النسبية RSI
rsi = ta.rsi(close, 14)
// MACD
= ta.macd(close, 12, 26, 9)
// شمعة مؤسسية: جسم كبير + فوليوم مرتفع
body = math.abs(close - open)
isBigCandle = body > ta.sma(body, 10)
volumeCondition = volume > ta.sma(volume, 20)
// شروط شراء
buyCond = close > ema50 and ema50 > ema200 and rsi < 30 and macdLine > signalLine and isBigCandle and volumeCondition
// شروط بيع
sellCond = close < ema50 and ema50 < ema200 and rsi > 70 and macdLine < signalLine and isBigCandle and volumeCondition
// رسم إشارات على الشارت
plotshape(buyCond, title="إشارة شراء", location=location.belowbar, color=color.green, style=shape.labelup, text="شراء")
plotshape(sellCond, title="إشارة بيع", location=location.abovebar, color=color.red, style=shape.labeldown, text="بيع")
// التنبيه
alertcondition(buyCond, title="تنبيه شراء", message="إشارة شراء حسب الفلتر الفني")
alertcondition(sellCond, title="تنبيه بيع", message="إشارة بيع حسب الفلتر الفني")

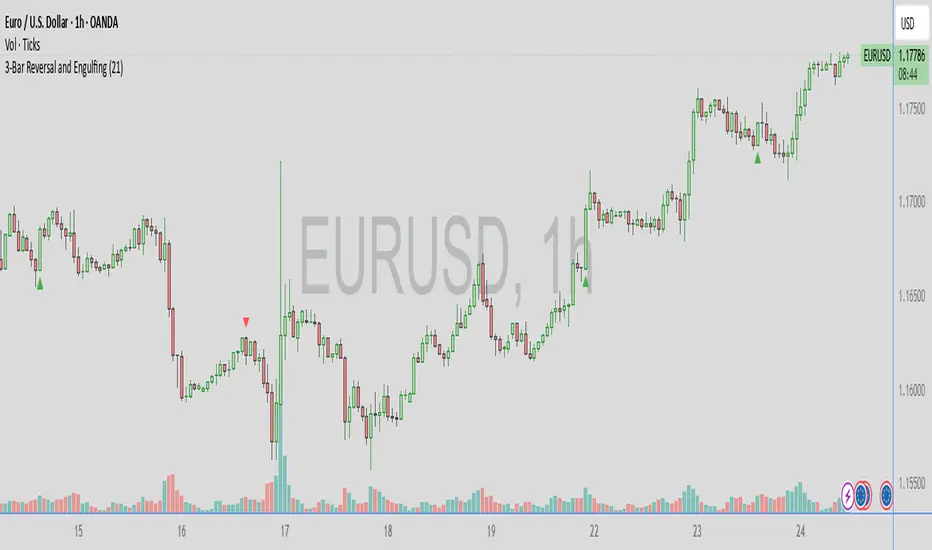
3-Bar Reversal and Engulfing3-bar reversal and engulfing candle signals, and a trendline filter.
It should be used to identify consolidation breakouts in a trending market.
Impulse Alert - Supply (Sell) [Fixed]🟥 Supply Zone (Sell) – Institutional Order Block Detector
This custom indicator automatically detects valid Supply Zones (Sell Zones) based on Smart Money Concepts and institutional trading behavior.
🔍 How It Works:
Identifies strong bearish impulsive moves after price forms a potential Order Block
Valid supply zones are plotted after:
A valid rally–base–drop or drop–base–drop structure
A shift in structure or clear imbalance is detected
The zone is created from the last bullish candle before a strong bearish engulfing move
Zones remain on chart until price revisits and reacts
📊 Use Case:
Ideal for traders using Smart Money Concepts (SMC), Supply & Demand, or ICT-inspired strategies
Perfect for scalping, day trading, or swing setups
Designed for confluence with HTF bias and LTF execution
⚙️ Features:
Supply Zone auto-plotting
Customizable zone color and opacity
Alerts when price returns to the zone (retest entry opportunity)
🧠 Tip for Best Use:
Use in confluence with:
HTF Supply zones (manual or other indicator)
Market Structure breaks
Fair Value Gaps or Imbalance zones
Strong impulsive moves from HTF to LTF
🔁 Future Additions (Coming Soon):
Demand Zone detection
Zone strength rating system
Refined zone filters (volume, candle size, etc.)
Alerts for mitigation or invalidation
📌 Created by: Rohit Jadhav | Real-time market trader | YT/Insta - @GrowthByTrading
💬 Feedback? Drop a comment or connect via profile for updates and tutorials!

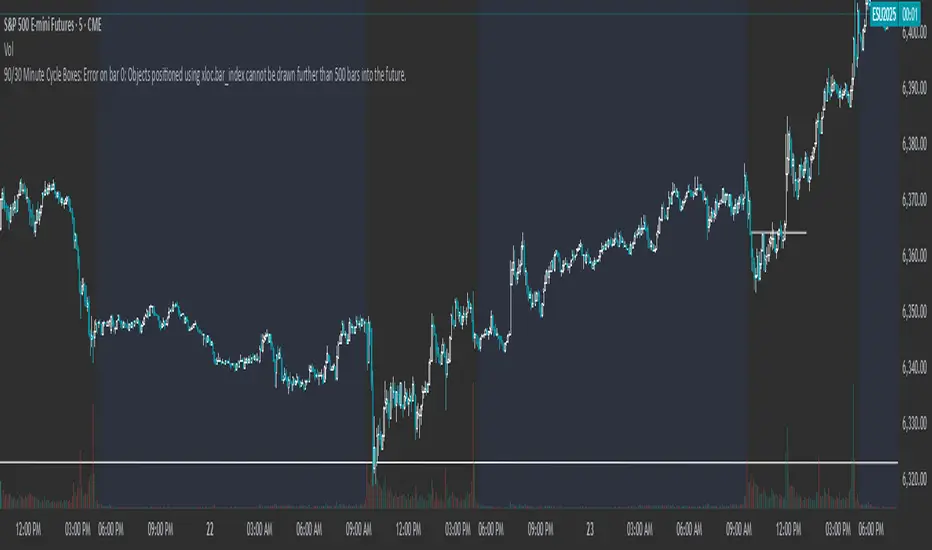
90/30 Minute Cycle BoxesThis indicator automatically draws time-based cycle boxes to help visualize market structure and cyclical behavior.
Features:
90-Minute Primary Cycles: Highlights each 90-minute interval with a colored box, showing the high and low of that period.
30-Minute Sub-Cycles: Each 90-minute box is divided into 3 sub-boxes representing 30-minute phases.
Multi-Timeframe Compatible: Works on all timeframes, adapting dynamically to your chart.
Visual Clarity: Alternating box colors make it easy to track price action within and across cycles.
This tool is ideal for traders who use time cycles in their analysis, especially those applying ICT, Smart Money Concepts, or time-based market theories.