✅ VMA Avg ATR + Days to Targets 🎯1) The trend filter: LazyBear VMA
You implement the well‑known “LazyBear” Variable Moving Average (VMA) from price directional movement (pdm/mdm).
Internally you:
Smooth positive/negative one‑bar moves (pdmS, mdmS),
Turn them into relative strengths (pdiS, mdiS),
Measure their difference/total (iS), and
Normalize that over a rolling window to get a scaling factor vI.
The VMA itself is then an adaptive EMA:
vma := (1 - k*vI) * vma + (k*vI) * close, where k = 1/vmaLen.
When vI is larger, VMA hugs price more; when smaller, it smooths more.
Coloring:
Green when vma > vma (rising),
Red when vma < vma (falling),
White when flat.
Candles are recolored to match.
Why this matters: The VMA color is your trend regime; everything else in the script keys off changes in this color.
2) What counts as a “valid” new trend?
A new trend is valid only when the previous bar was white and the current bar turns green or red:
validTrendStart := vmaColor != color.white and vmaColor == color.white.
When that happens, you start a trend segment:
Save entry price (startPrice = close) and baseline ATR (startATR = ATR(atrLen)).
Reset “extreme” trackers: extremeHigh = high, extremeLow = low.
Timestamp the start (trendStartTime = time).
Effect: You only study / trade transitions out of a flat VMA into a slope. This helps avoid chop and reduces false starts.
3) While the trend is active
On each new bar without a color change:
If green trend: update extremeHigh = max(extremeHigh, high).
If red trend: update extremeLow = min(extremeLow, low).
This tracks the best excursion from the entry during that single trend leg.
4) When the VMA color changes (trend ends)
When vmaColor flips (green→red or red→green), you close the prior segment only if it was a valid trend (started after white). Then you:
Compute how far price traveled in ATR units from the start:
Uptrend ended: (extremeHigh - startPrice) / startATR
Downtrend ended: (startPrice - extremeLow) / startATR
Add that result to a running sum and count for the direction:
totalUp / countUp, totalDown / countDown.
Target checks for the ended trend (no look‑ahead):
T1 uses the previous average ATR move before the just‑ended trend (prevAvgUp/prevAvgDown).
Up: t1Up = startPrice + prevAvgUp * startATR
Down: t1Down = startPrice - prevAvgDown * startATR
T2 is a fixed 6× ATR move from the start (up or down).
You increment hit counters and also accumulate time‑to‑hit (ms from trendStartTime) for any target that got reached during that ended leg.
If T1 wasn’t reached, it counts as a miss.
Immediately initialize the next potential trend segment with the current bar’s startPrice/startATR/extremes and set validTrendStart according to the “white → color” rule.
Important detail: Using prevAvgUp/Down to evaluate T1 for the just‑completed trend avoids look‑ahead bias. The current trend’s performance isn’t used to set its own T1.
5) Running statistics & targets (for the current live trend)
After closing/adding to totals:
avgUp = totalUp / countUp and avgDown = totalDown / countDown are the historical average ATR move per valid trend for each direction.
Current plotted targets (only visible while a valid trend is active and in that direction):
T1 Up: startPrice + avgUp * startATR
T2 Up: startPrice + 6 * startATR
T1 Down: startPrice - avgDown * startATR
T2 Down: startPrice - 6 * startATR
The entry line is also plotted at startPrice when a valid trend is live.
If there’s no history yet (e.g., first trend), avgUp/avgDown are na, so T1 is na until at least one valid trend has closed. T2 still shows (6× ATR).
6) Win rate & time metrics
Win % (per direction):
winUp = hitUpT1 / (hitUpT1 + missUp) and similarly for down.
(This is strictly based on T1 hits vs misses; T2 hits don’t affect Win% directly.)
Average days to hit T1/T2:
The script stores milliseconds from trend start to each target hit, then reports the average in days separately for Up/Down and for T1/T2.
7) The dashboard table (bottom‑right)
It shows, side‑by‑side for Up/Down:
Avg ATR: historical average ATR move per completed valid trend.
🎯 Target 1 / Target 2: the current trend’s price levels (T1 = avgATR×ATR; T2 = 6×ATR).
✅ Win %: T1 hit rate so far.
⏱ Days to T1/T2: average days (from valid trend start) for the targets that were reached.
8) Alerts
“New Trend Detected” when a valid trend starts (white → green/red).
Target hits for the active trend:
Uptrend: separate alerts for T1 and T2 (high >= target).
Downtrend: separate alerts for T1 and T2 (low <= target).
9) Inputs & defaults
vmaLen = 17: governs how adaptive/smooth the VMA is (larger = smoother, fewer trend flips).
atrLen = 14: ATR baseline for sizing targets and normalizing moves.
10) Practical read of the plots
When you see white → green: that bar is your valid entry (trend start).
An Entry Line appears at the start price.
Target lines appear only for the active direction. T1 scales with your historical average ATR move; T2 is a fixed stretch (6× ATR).
The table updates as more trends complete, refining:
The average ATR reach (which resets your T1 sizing),
The win rate to T1, and
The average days it typically takes to hit T1/T2.
Subtle points / edge cases
No look‑ahead: T1 for a finished trend is checked against the prior average (not including the trend itself).
First trends: Until at least one valid trend completes, T1 is na (no history). T2 still shows.
Only “valid” trends are counted: Segments must start after a white bar; flips that happen color→color without a white in between don’t start a new valid trend.
Time math: Uses bar timestamps in ms, converted to days; results reflect the chart’s timeframe/market session.
TL;DR
The VMA color defines the regime; entries only trigger when a flat (white) VMA turns green/red.
Each trend’s max excursion from entry is recorded in ATR units.
T1 for current trends = (historical average ATR move) × current ATR from entry; T2 = 6× ATR.
The table shows your evolving edge (avg ATR reach, T1 win%, and days to targets), and alerts fire on new trends and target hits.
If you want, I can add optional features like: per‑ticker persistence of stats, excluding very short trends, or making T2 a user input instead of a fixed 6× ATR.
Indicators and strategies

Session Highs and Lows Indicator (DST + Editable Times)Previous session highs and lows labeled for NY, Asia, and London. Key component in swing strategies are finding levels for price to respect and to chase and a very strong level is the previous session's high or low. Adjustable settings to view specific time windows and customizable color settings for your own preference.

HMM Adaptive BB & Regime Signals1. Install the Indicator
Open TradingView and load the chart for your chosen symbol.
Click the Pine Editor tab at the bottom.
Delete any existing code, paste in the full Pine Script.
Click Save, give it a name (e.g. “HMM Adaptive BB”), then click Add to Chart.
If the script compiles correctly, you’ll immediately see:
An orange upper/lower Bollinger-style channel
A blue SMA basis line
Shaded background indicating the current regime

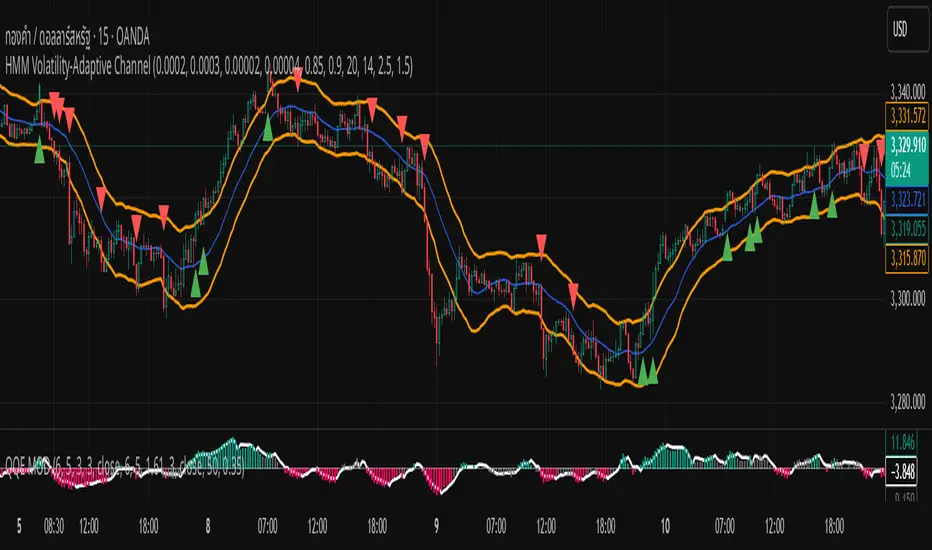
HMM Volatility-Adaptive ChannelChannel Lines (orange)
Upper = SMA + ATR × dynamic multiplier
Lower = SMA − ATR × dynamic multiplier
Background Shade
Light green = High-Volatility regime (pₕ > 0.5)
Light red = Low-Volatility regime (pₕ ≤ 0.5)
Breakout Signals
BUY marker (▲) when close crosses above the upper line
SELL marker (▼) when close crosses below the lower line
Simple H% Buy/Sell Signals//@version=5
indicator("Simple H% Buy/Sell Signals", overlay=true)
// === Calculate H% ===
h_percent = ((high - low) / low) * 100
// === Input thresholds ===
buyThreshold = input.float(0.3, title="Buy Signal H% Threshold")
sellThreshold = input.float(0.5, title="Sell Signal H% Threshold")
// === Buy/Sell Conditions ===
buySignal = h_percent > buyThreshold and close > open
sellSignal = h_percent > sellThreshold and close < open
// === Plot shapes ===
plotshape(buySignal, title="BUY Signal", location=location.belowbar, style=shape.labelup, text="BUY", color=color.green, textcolor=color.white, size=size.normal)
plotshape(sellSignal, title="SELL Signal", location=location.abovebar, style=shape.labeldown, text="SELL", color=color.red, textcolor=color.white, size=size.normal)
// === Optional: Plot H% for visual reference ===
plot(h_percent, title="H%", color=color.orange, linewidth=2, display=display.none)

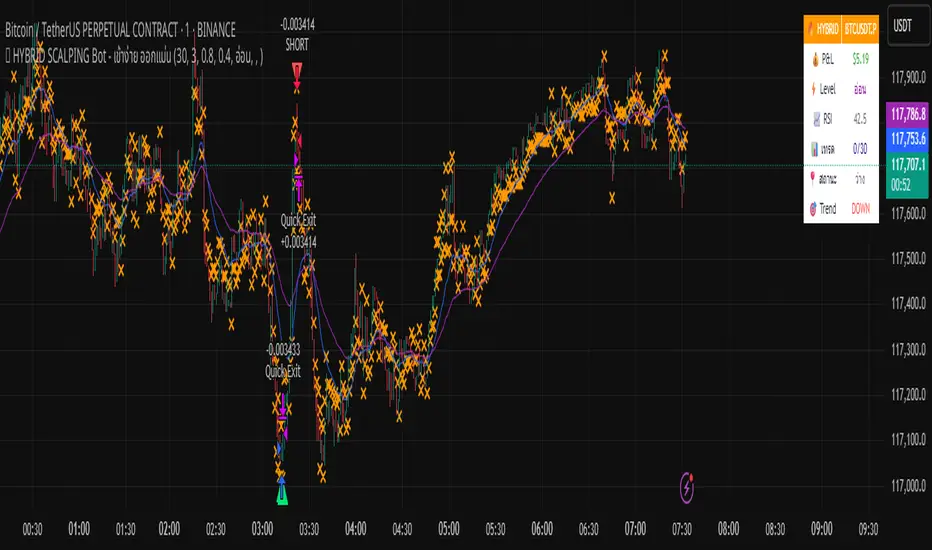
🔥 HYBRID SCALPING Bot - เข้าง่าย ออกแม่นA tool bot that helps analyze charts accurately, focusing on profits.
Harmonic BloomHarmonic Bloom - Advanced Geometric Analysis
Building upon my previous Fibonacci inspired indicator "TrendZone", Harmonic Bloom is a sophisticated geometric trading indicator inspired by W.D. Gann's legendary market geometry principles. It reveals market structure through three key pivot points and dynamic angular analysis, creating powerful harmonic intersections for precision trading.
🎯 Core Features:
📍 Three-Point Gann System:
Set 3 custom pivot points to define your analysis timeframe
Automatic trend detection (bullish/bearish) between pivots
Dynamic geometric box construction following Gann's square principles
📐 Gann-Style 45° Angle Projections:
Pivot 2 Line: Follows trend direction (up if bullish, down if bearish)
Pivot 3 Line: Creates opposition (opposite direction to Pivot 2)
Corner Line: Mirrors Pivot 2 from appropriate box corner
All angles project forward using Gann's 1x1 (45°) methodology for future price targets
⚡ POWER OF HARMONIC INTERSECTIONS:
Confluence Zones: Where multiple 45° angles intersect create the strongest support/resistance
Geometric Harmony: Intersections represent natural market turning points
Time-Price Balance: Following Gann's principle that time and price must be in harmony
Multiple Timeframe Resonance: Intersection points often align across different timeframes
High-Probability Reversals: Markets frequently respect these geometric intersection levels
📊 Customizable Retracement Levels:
8 fully configurable levels (default: 0.0, 0.25, 0.5, 0.75, 1.0, 1.25, 1.5, 1.75)
Choose between 25% or 50% trendline alignment
Individual style controls for each level
🔢 Advanced Gann Analytics:
Fibonacci sequence detection in bar counts (Gann studied natural number sequences)
Numerology sum analysis on pivot prices (Gann's mystical number approach)
Special highlighting for significant numbers
Optional on-chart labels for key metrics
📈 Trading Applications:
✅ Support/Resistance: Use retracement levels for entry/exit points
✅ Gann Angles: 45° lines show momentum direction and strength following Gann's time-price theory
✅ Intersection Trading: Most powerful signals occur at harmonic intersections where multiple angles converge
✅ Price Targets: Forward projections provide future price objectives using Gann's geometric principles
✅ Market Geometry: Identify harmonic patterns and geometric confluences
✅ Time Analysis: Fibonacci-based bar counting for timing decisions (Gann emphasized time cycles)
🌟 Why Harmonic Intersections Are So Powerful:
Gann believed that markets move in geometric harmony, and when multiple angles intersect, they create "magnetic price levels" where:
Maximum Energy Convergence: Multiple geometric forces meet at one point
Natural Turning Points: Markets respect these intersections as natural support/resistance
Time-Price Synchronicity: Intersections often coincide with significant time cycles
Multi-Dimensional Confirmation: Price, time, and geometry align simultaneously
⚙️ Highly Customizable:
All colors, widths, and styles adjustable
Toggle any feature on/off independently
Extend projections beyond the analysis box
Choose your preferred visual presentation
Perfect for traders who use Gann theory, geometric analysis, harmonic patterns, and mathematical market structure. The true power lies in trading the intersection points where multiple harmonic angles converge - these represent the market's most significant geometric turning points.

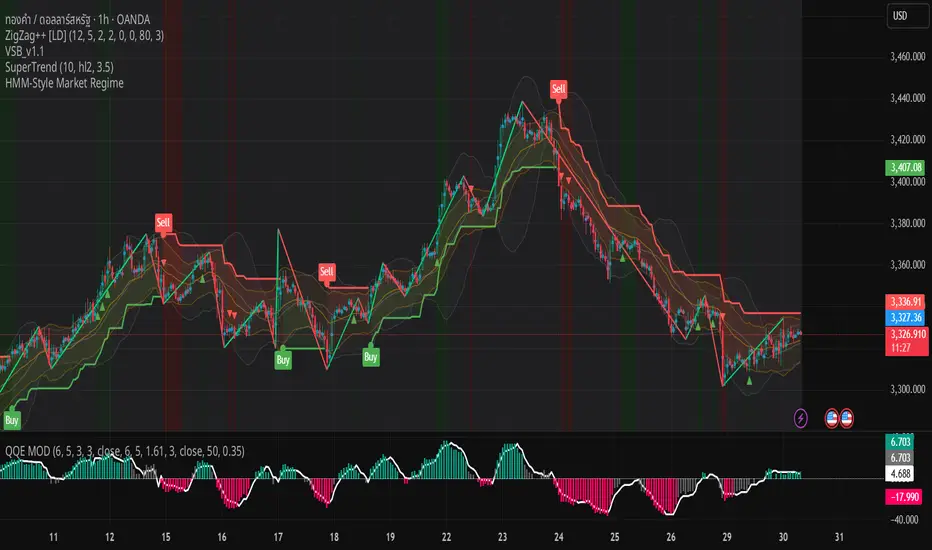
HMM-Style Market RegimeVisual outputs rendered by the script
Background color bands (bgcolor)
Green when regime == Bull
Red when regime == Bear
Gray when regime == Sideways (uncertain)
Labels (label.new)
“Bull” in the top-left corner when entering a Bull regime
“Bear” when entering a Bear regime
“Sideways” when entering a Sideways regime
Regime-change arrows (plotshape)
▲ Up arrow when the regime flips to Bull
▼ Down arrow when the regime flips to Bear
Optional metric plots
A chart of the return Z-score and volatility Z-score (when debug mode is enabled)
Opening Range v3 (Dynamic)Opening Range Signals v3 (Dynamic) - Indicator Guide
Created by: MecarderoAurum
Why This Indicator Exists: An Overview
The "Opening Range Signals" indicator is a sophisticated tool designed for day traders who focus their strategy on the price action that unfolds during the Regular Trading Hours (RTH) of the New York session (09:30 - 16:00 ET). The opening period of the market, often called the "initial balance," is a critical time where institutions and traders establish the early high and low for the day. Trading the breakout of this range is a classic and effective strategy, but it's often plagued by false moves and "head fakes."
This indicator was built to solve that problem. It not only identifies the initial range but also incorporates a powerful dynamic expansion feature. This allows the indicator to intelligently adapt to early session volatility, filter out false breakouts, and establish more reliable support and resistance levels for the rest of the trading day. It provides a clear, visual framework for executing opening range strategies with more confidence.
Key Features & How to Use Them
1. Customizable Opening Range
This is the foundation of the indicator. It draws the high and low of the initial trading period on your chart.
What it does: Establishes the initial support and resistance levels for the day.
How to use it: In the settings under "Time Settings," you can set the "Opening Range Duration" from 1 to 30 minutes. A shorter duration (e.g., 5 minutes) will be more sensitive and give earlier signals, while a longer duration (e.g., 30 minutes) will establish a wider, more robust range.
2. Dynamic Range Expansion
This is the indicator's most powerful and unique feature. It helps you avoid getting trapped in false breakouts.
What it does: If the price breaks out of the initial range but then quickly closes back inside, the indicator will automatically expand the range to include the full wick of the failed breakout. This tells you the market is still establishing its true range.
How to use it: In the settings under "Dynamic Range," you can:
"Enable Dynamic Range Expansion": This is on by default.
"Expansion Time Limit (Min)": Set how long the indicator should look for these failed breakouts. After this time, the range will be locked for the day.
3. Clear Visual Trading Signals
The indicator provides three distinct signals to help you interpret the price action around the opening range.
Breakout Body (Yellow plotshape):
What it means: The first confirmation that the price has decisively moved outside the established range. It appears when a candle's body closes entirely above the high or below the low.
How to use it: This is your alert that a potential breakout is underway. Do not enter yet; wait for confirmation.
Continuation (Green plotshape):
What it means: This signal appears on the candle immediately following a breakout if it shows momentum in the same direction. It confirms that the breakout has strength.
How to use it: This is a potential entry trigger. A continuation signal suggests the breakout is valid and may continue.
Failure (Red plotshape):
What it means: This signal appears if, after a breakout and continuation, the price quickly reverses and closes back inside the range. It's a strong indication of a false breakout.
How to use it: If you are in a breakout trade, a failure signal is a clear sign to exit. It can also be used as a setup for a reversal trade in the opposite direction.
Sample Strategy: The Breakout-Continuation Trade
This strategy uses the indicator's signals to trade a classic opening range breakout with added confirmation.
Setup:
Set the "Opening Range Duration" to your preferred time (e.g., 5 or 15 minutes).
Ensure the "Dynamic Range Expansion" is enabled to filter out early noise.
Entry Trigger:
Wait for a Breakout signal (yellow) to appear. This puts you on high alert.
Wait for a Continuation signal (green) on the very next candle. This is your entry trigger. Enter a long trade on a bullish continuation or a short trade on a bearish continuation.
Stop-Loss:
For a bullish (long) trade, a common stop-loss placement is just below the low of the continuation candle or, for a more conservative stop, just inside the opening range high.
For a bearish (short) trade, place your stop-loss just above the high of the continuation candle or just inside the opening range low.
Trade Management:
If a Failure signal (red) appears after you've entered, it indicates the breakout has failed. This is a strong signal to exit your trade immediately to protect your capital.
If the trade moves in your favor, you can manage it by taking profits at key levels or using a trailing stop.

lib_listaAtivos_PosseidonLibrary "lib_listaAtivos_Posseidon"
TODO: add library description here
ativos(loteSelected)
TODO: add function description here
Parameters:
loteSelected (simple int)
Returns: TODO: add what function returns
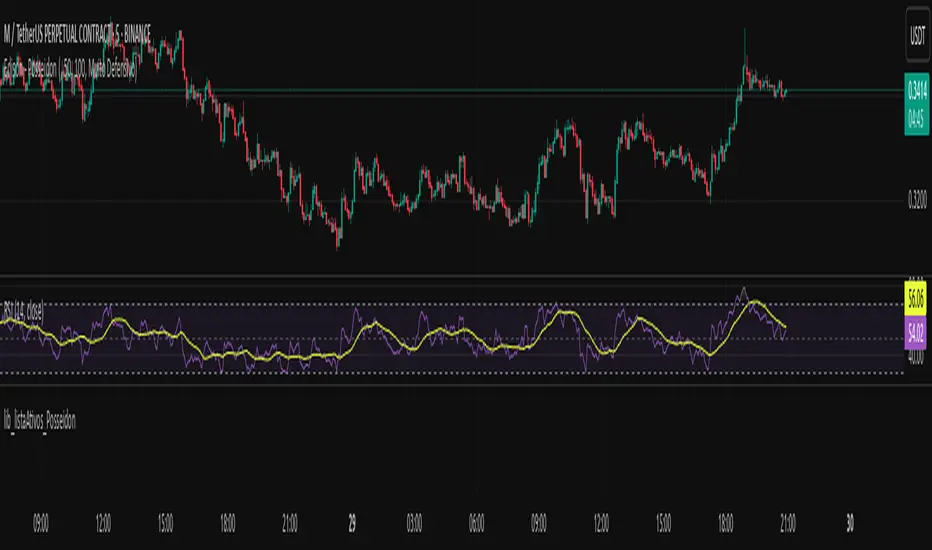
Liquidity Zones, EMAs, Market Cipher BAll In One, market cipher b, divergences, ema 12/21/50/200, and liquidity zones

Inversed_FVGLibrary "Inversed_FVG"
The library is searching the FVG
find_bull_fvg(provided_fvgs, low_1, high_3, time_3, bar_closed, high_1)
Parameters:
provided_fvgs (array type from maksym_hayovets/POITypes/6)
low_1 (float)
high_3 (float)
time_3 (int)
bar_closed (bool)
high_1 (float)
find_bear_fvg(provided_fvgs, low_3, high_1, time_3, bar_closed, low_1)
Parameters:
provided_fvgs (array type from maksym_hayovets/POITypes/6)
low_3 (float)
high_1 (float)
time_3 (int)
bar_closed (bool)
low_1 (float)

Premarket High/Low LabelThis is an indicator which shows premarket high/low label. so that you dont have to do it yourself. hope it helps :)

Session Key Levels Lines (with Labels)This is an extension of the previous indicator, it just plots all the information you need automatically for you so you dont have to lift a finger. hope it helps :)

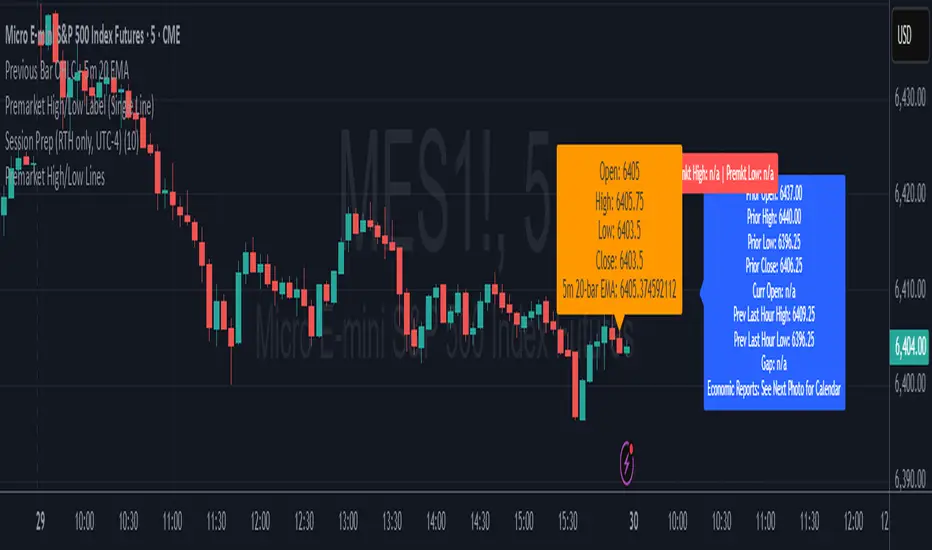
Session Prep (RTH only, UTC-4)This shows what you have to prepare before each session, including Previous session's OHLC, how much is being gapped up...etc. hope it helps :)
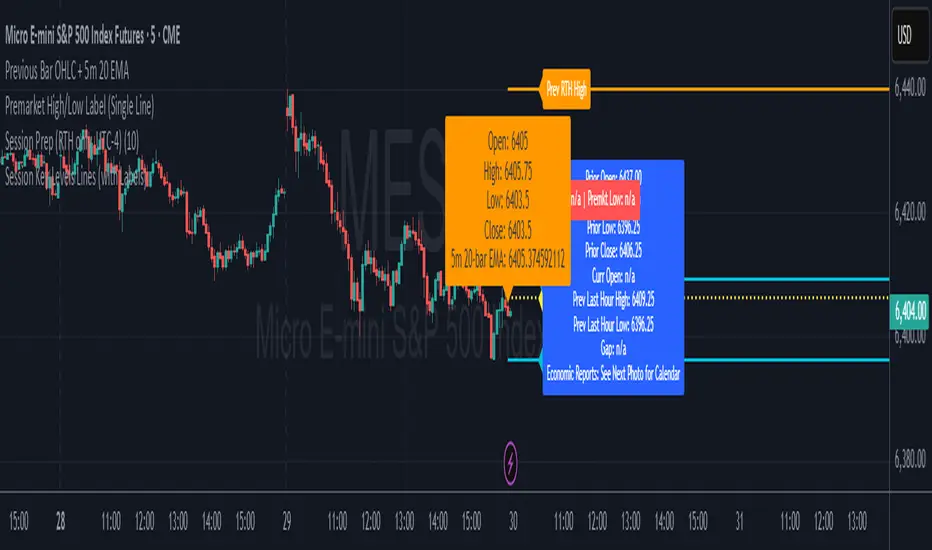
Previous Bar OHLC + 5m 20 EMAThis shows previous bar OHLC + 5m 20 EMA in one single text box, so you dont have to find it yourself. hope it helps :)

Daily EMA-21/34/50The EMAs and color coding can be changed, by default it contains 21/34/50 on Daily, The script can be edited to suit the timeframe whichever wanted

Premarket High/Low LinesTHis is another script about premarket lines, the previous one is a label and this one really plot the lines, so you dont have to do it yourself. hope it helps :)
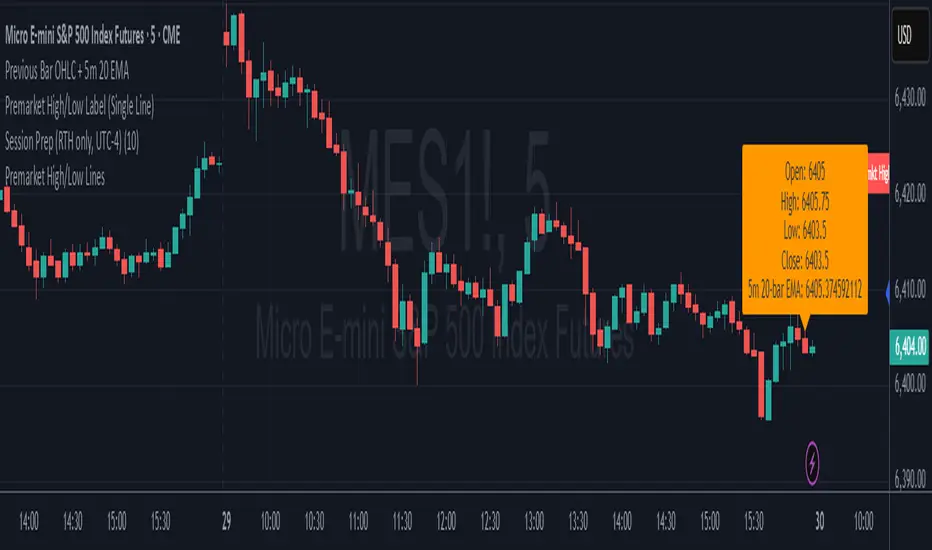
Premarket High/Low Label (Single Line)it shows you what the premarket high low label is on a single line, saving you the hassale of fidning it yourself. :) hope it helps.
Previous Day Levels (High, Low, Open, Close)This TradingView Pine Script indicator plots the previous day’s price levels (High, Low, Open, and Close) as horizontal rays that extend across the current trading day.
Green lines mark the Previous Day High and Previous Day Low.
Yellow lines mark the Previous Day Open and Previous Day Close.
Labels are automatically displayed at the right edge of the chart, positioned above each line, making it easy to identify the corresponding level in real time.
The levels are updated daily and always begin at the start of the current day, ensuring that they cover the entire intraday session.
This tool helps traders quickly visualize key support and resistance levels from the previous trading day and incorporate them into intraday strategies.

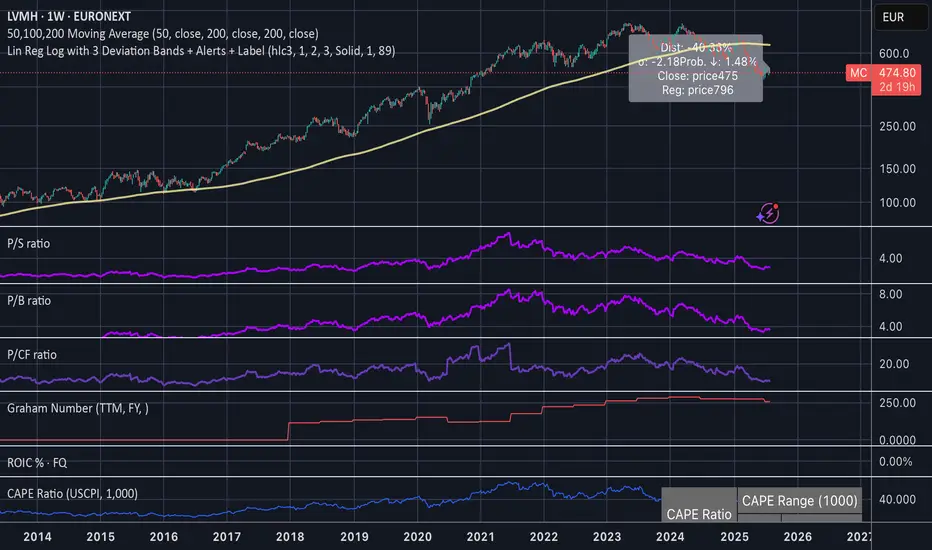
Linear Regression Log Channel with 3 Standard Deviations, AlertsThis indicator plots a logarithmic linear regression trendline starting from a user-defined date, along with ±1, ±2, and ±3 standard deviation bands. It is designed to help you visualize long-term price trends and statistically significant deviations.
Features:
• Log-scale linear regression line based on price since the selected start date
• Upper and lower bands at 1σ, 2σ, and 3σ, with the 3σ bands dashed for emphasis
• Optional filled channels between deviation bands
• Dynamic label showing:
• Distance from regression (in %)
• Distance in standard deviations (σ)
• Current price and regression value
• Estimated probability (assuming normal distribution) that the price continues moving further in its current direction
• Built-in alerts when price crosses the regression line or any of the deviation bands
This tool is useful for:
• Identifying mean-reversion setups or stretched trends
• Estimating likelihood of further directional movement
• Spotting statistically rare price conditions (e.g., >2σ or >3σ)
MACD Signal with Williams %R ColoringA simple fused indicator of 2, 1) MACD signal lines made colouring when 2) Williams % R is in overbought or oversold. not my own coding, just took two readily available indicators and coded them together.
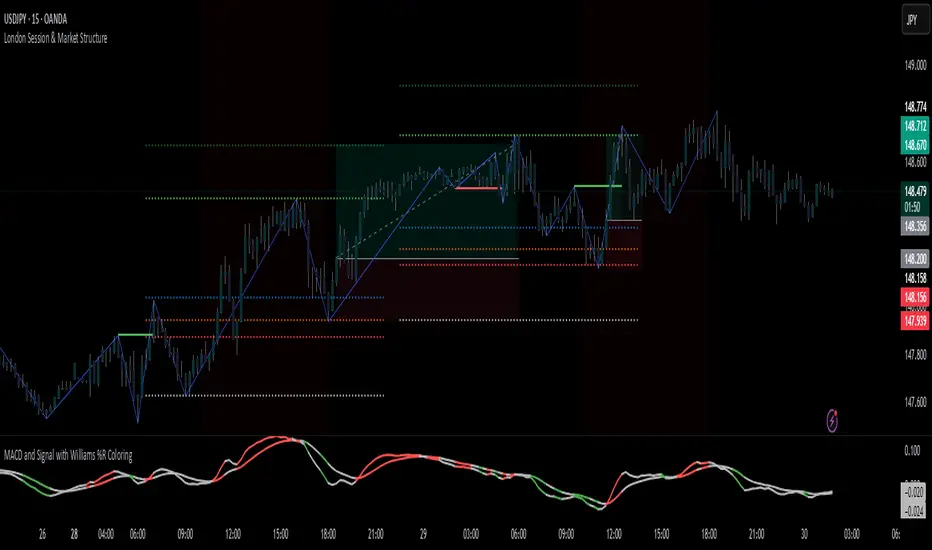
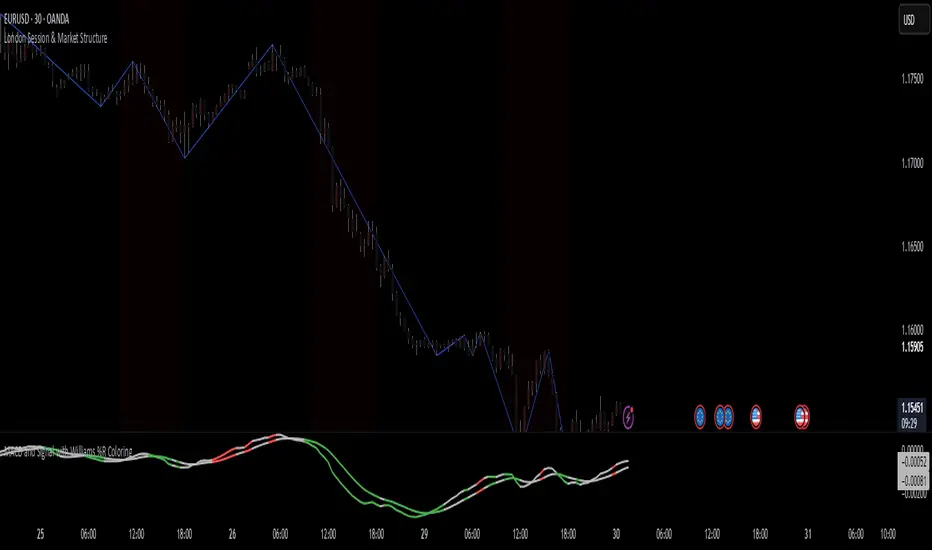
London Session & Market StructureFusion of session indicator with market structure ZigZag line. not my own creation just a fusion of 2 indicators which are publicly available on TV