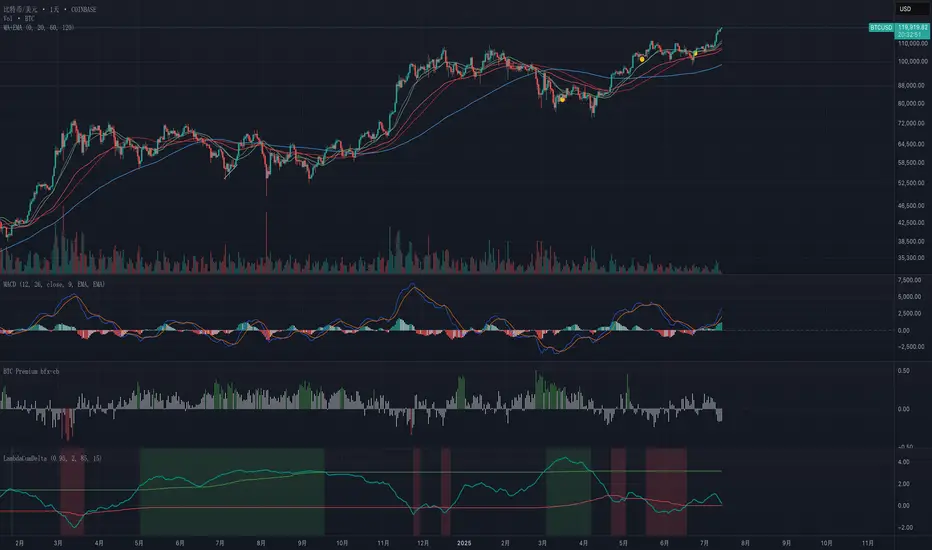
Exponential-Decay Cumulative Spread (Cycle-Tuned)## Indicator Overview
**Exponential-Decay Cumulative Spread (Cycle-Tuned)** – short title **LambdaCumDelta** – tracks the percentage spread between CEXs BTC spot prices.
By clipping outliers, applying an exponential-decay running sum, and comparing that sum to rolling percentile bands, the script flags potential **cycle bottoms** and **cycle tops** whenever the cumulative spread stays beyond extreme thresholds for three consecutive bars.
---
### Core Logic
1. **Price Spread**
`spread_pct = (cexA – cexB) / cexB × 100`.
2. **Outlier Suppression**
* Calculates the **90-day standard deviation σ** of `spread_pct`.
* Uses a **clip coefficient `k_clip`** (0.5–5.0) to cap the spread at `±k_clip × σ`, damping single-day anomalies.
3. **Exponential-Decay Sum**
* Applies a decay factor **λ** (0.50–0.999):
```
CumΔₜ = spread_clipₜ + λ × CumΔₜ₋₁
```
* Larger λ → longer memory half-life.
4. **Rolling Percentile Bands**
* Uses a **365-bar window** to derive dynamic percentile thresholds.
* Upper / Lower bands are set by **perc\_hi** and **perc\_lo** (e.g., 85 % and 15 %).
5. **Signal Definition**
* **Bullish** (cycle bottom): `CumΔ` above the upper band for **3 straight bars**.
* **Bearish** (cycle top): `CumΔ` below the lower band for **3 straight bars**.
---
### Chart Elements
| Plot | Style | Meaning |
| --------------- | ----------------- | ----------------------------------- |
| **CumΔ** | Teal thick line | Exponential-decay cumulative spread |
| Upper Threshold | Green thin line | Rolling upper percentile |
| Lower Threshold | Red thin line | Rolling lower percentile |
| Background | Faded green / red | Bullish / bearish signal zone |
---
### Key Inputs
| Input | Default | Purpose |
| -------------------- | ------- | ------------------------------- |
| **Decay factor λ** | 0.95 | Memory length of CumΔ |
| **Clip coefficient** | 2.0 | Multiple of σ for outlier cap |
| **Upper percentile** | 85 | Cycle-bottom trigger percentile |
| **Lower percentile** | 15 | Cycle-top trigger percentile |
---
### Practical Tips
1. **Timing bias**
* Green background often precedes mean-reversion of the spread – consider scaling into longs or covering shorts.
* Red background suggests stretched positive spread – consider trimming longs or lightening exposure.
2. **Combine with volume, trend filters (MA, MACD, etc.)** to weed out false extremes.
3. Designed for **daily charts**; ensure both exchange feeds are synchronized.
---
### Alerts
Two built-in `alertcondition`s fire when bullish or bearish criteria are met, enabling push / email / webhook notifications.
---
### Disclaimer
This script is for educational and research purposes only and is **not** financial advice. Test thoroughly and trade at your own risk.
Indicators and strategies
Momentum Candle V2 by Sekolah Trading📌 Momentum Candle V2 by Sekolah Trading – Pair-Based Volatility & Wick Ratio Filter
This script provides a structured and adaptive approach to detecting high-probability momentum candles in intraday markets. It dynamically adjusts pip thresholds and wick filtering conditions based on the selected symbol and timeframe, making it highly practical for real-time trading.
🔍 Concept and Originality
Momentum Candle V2 by Sekolah Trading implements a custom-built methodology combining:
Dynamic Pip Calibration
For each supported instrument (e.g., XAUUSD, USDJPY, GBPUSD, AUDUSD, EURUSD, BTCUSD), the user can define a pip threshold that determines the minimum valid body size for momentum candles. These thresholds are tailored for each pair and timeframe (M5, M15, H1), ensuring the logic adjusts to different volatility profiles.
Wick-to-Body Ratio Filtering
The script filters out candles with large wicks by requiring that total wick length (upper + lower) be no more than 30% of the full candle range. This helps identify decisive candles with minimal rejection.
Directional Validation
Bullish momentum is defined as: Close > Open with a shorter upper wick.
Bearish momentum is: Close < Open with a shorter lower wick.
Real-Time Timing Filter
Alerts are only triggered when the current candle is between 20 and 90 seconds from closing, which reduces noise and encourages confirmation-based entry.
Non-Repainting Logic
All calculations run in real-time with confirmed candles only — no lookahead or future leak.
📊 Visual Output – How to Read the Chart
When the conditions above are met, the script displays triangle markers on the chart:
🔺 Red downward triangle above the candle: valid bearish momentum signal
🔻 Blue upward triangle below the candle: valid bullish momentum signal
These shapes appear on live bars during the final moments of the candle to alert traders to potential confirmed momentum.
🔔 Alert Conditions
Two alert types are provided:
Momentum Bullish: Large bullish candle with small upper wick, during last 20–90s of bar
Momentum Bearish: Large bearish candle with small lower wick, same timing window
Alerts are designed for precision entries at candle close.
🧭 How to Use
Apply the script to a 5m, 15m, or 1h chart.
Configure pip thresholds for your preferred pairs from the input settings.
Watch for triangle markers near the close of each candle:
Blue = potential bullish momentum
Red = potential bearish momentum
Set alerts:
Go to Alerts → Select Momentum Bullish or Momentum Bearish
Frequency: Once Per Bar
Customize message: e.g. “Momentum Bullish on XAUUSD M15”
Combine signals with:
EMA, S/R, or trend filters
Volume/Order Flow
Liquidity zone or breakout context
🛡️ Why This Script Is Closed-Source
This script uses proprietary logic developed by Sekolah Trading, including:
Custom pip calibration engine
Adaptive wick filtering
Real-time entry validation with triangle plots
While the code is protected, the methodology has been explained transparently here in accordance with TradingView publishing rules.
⚠️ Disclaimer
This script is provided for educational and technical analysis purposes only.
It does not guarantee results or provide financial advice. Always verify trades with your own strategy and risk controls.
Author: Sekolah Trading
Version: Momentum Candle V2
Built with Pine Script v6

Pattern Detector [theUltimator5]🎯 Overview
The Pattern Detector is a comprehensive technical analysis indicator that automatically identifies and visualizes multiple pattern types on your charts. Built with advanced ZigZag technology and sophisticated pattern recognition algorithms, this tool helps traders spot high-probability trading opportunities across all timeframes and markets.
✨ Key Features
🔍 Multi-Pattern Detection System
Harmonic Patterns: Butterfly, Gartley, Bat, and Crab patterns with precise Fibonacci ratios
Classic Reversal Patterns: Head & Shoulders and Inverse Head & Shoulders
Double Patterns: Double Tops and Double Bottoms with extreme validation
Wedge Patterns: Rising and Falling Wedges with volume confirmation
📊 Advanced ZigZag Engine
Customizable sensitivity (5-50 levels)
Depth multiplier for multi-timeframe analysis
Real-time pivot detection with noise filtering
Option to display ZigZag lines only for pure price action analysis
🎨 Visualization
Clean pattern lines with distinct color coding
Point labeling system (X, A, B, C, D for harmonics / LS, H, RS for H&S)
Pattern name displays with bullish/bearish direction
Price target projections with arrow indicators
Subtle pattern fills for enhanced visibility
🛠️ Settings & Configuration
Core ZigZag Settings
ZigZag Sensitivity (5-50): Controls pattern detection sensitivity. Lower values detect more patterns but may include noise. Higher values focus on major swings only.
ZigZag Depth Multiplier (1-5): Multiplies sensitivity for deeper analysis. Level 1 = most responsive, Level 5 = major swings only.
Pattern Detection Toggles
Show ZigZag Lines Only: Displays pure ZigZag without pattern detection for price structure analysis
Detect Harmonic Patterns: Enable/disable Fibonacci-based harmonic pattern detection
Detect Head & Shoulders: Toggle classic reversal pattern identification
Detect Double Tops/Bottoms: Enable double pattern detection with extreme validation
Detect Wedge Patterns: Toggle wedge pattern detection with volume confirmation
Display Options
Show Pattern Names: Display pattern names directly on chart (e.g., "Butterfly (Bullish)")
Show Point Labels: Add lettered labels at key pattern points for structure identification
Project Harmonic Targets: Show projected completion points for incomplete harmonic patterns
📈 Pattern Types Explained
Harmonic Patterns 🦋
Advanced Fibonacci-based patterns that provide high-probability reversal signals:
Butterfly: AB=0.786 XA, BC=0.382-0.886 AB, CD=1.618-2.24 BC
Gartley: AB=0.618 XA, BC=0.382-0.886 AB, CD=1.272-1.618 BC
Bat: AB=0.382-0.50 XA, BC=0.382-0.886 AB, CD=1.618-2.24 BC
Crab: AB=0.382-0.618 XA, BC=0.382-0.886 AB, CD=2.24-3.618 BC
Head & Shoulders 👤
Classic three-peak reversal pattern indicating trend exhaustion:
Standard H&S: Bearish reversal at tops
Inverse H&S: Bullish reversal at bottoms
Automatic neckline validation and price target calculation
Double Patterns 📊
Powerful reversal patterns with extreme validation:
Double Top: Two similar highs with valley between (bearish)
Double Bottom: Two similar lows with peak between (bullish)
Includes lookback period validation to ensure patterns are significant extremes
Wedge Patterns 📐
Continuation/reversal patterns with converging trend lines:
Rising Wedge: Converging upward slopes (typically bearish)
Falling Wedge: Converging downward slopes (typically bullish)
Volume confirmation required for increased accuracy
🎯 Trading Applications
Entry Signals
Harmonic Patterns: Enter at point D completion with targets at point A
H&S Patterns: Enter on neckline break with calculated targets
Double Patterns: Enter on support/resistance break with measured moves
Wedge Patterns: Enter on breakout direction with volume confirmation
Risk Management
Use pattern structure for logical stop placement
Pattern invalidation levels provide clear exit rules
Multiple pattern confirmation increases probability
Multi-Timeframe Analysis
Higher ZigZag depth for longer-term patterns
Lower sensitivity for short-term trading patterns
Combine with other timeframes for confluence
⚙️ Optimal Settings
For Day Trading (1m-15m charts)
ZigZag Sensitivity: 5-9
Depth Multiplier: 1-2
Enable all pattern types for maximum opportunities
For Swing Trading (1H-4H charts)
ZigZag Sensitivity: 9-15
Depth Multiplier: 2-3
Focus on harmonic and H&S patterns
For Position Trading (Daily+ charts)
ZigZag Sensitivity: 15-25
Depth Multiplier: 3-5
Emphasize major harmonic and double patterns
🔧 Technical Specifications
Maximum Lookback: 5000 bars for comprehensive analysis
Pattern Overlap Prevention: Intelligent filtering prevents duplicate patterns
Performance Optimized: Efficient algorithms for real-time detection
Volume Integration: Advanced volume analysis for wedge confirmation
Fibonacci Precision: 10% tolerance for harmonic ratio validation
📚 How to Use
Add to Chart: Apply indicator to any timeframe/market
Configure Settings: Adjust sensitivity based on trading style
Enable Patterns: Toggle desired pattern types
Analyze Results: Look for completed patterns with clear structure
Plan Trades: Use price targets and pattern invalidation for trade management
Perfect for both novice and experienced traders seeking systematic pattern recognition with visualization and entry/exit signals.

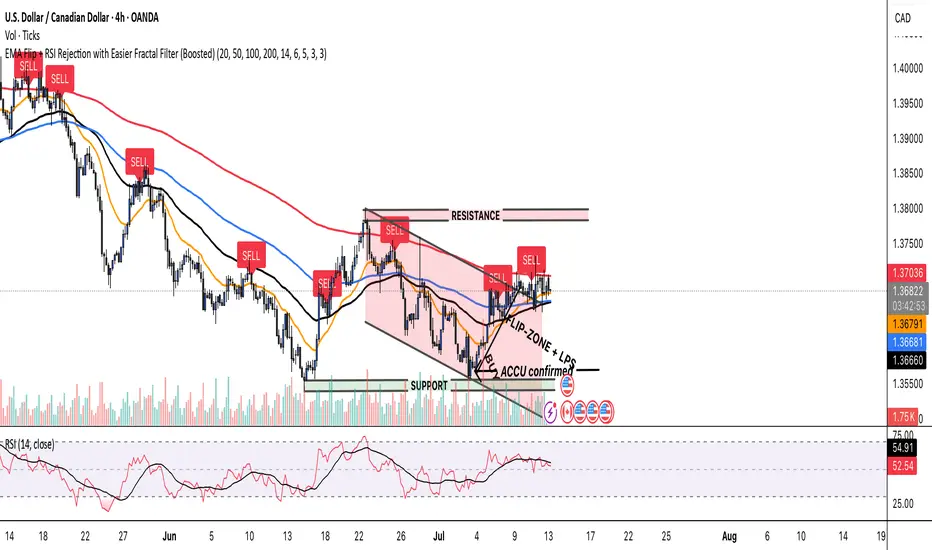
EMA Flip + RSI Rejection with Easier Fractal Filter (Boosted)SQUEEZE & FLIP for spotting LPSs and LPSYz. This Indicator identifies LPS and LPSYS

Tnup Zones 2025This indicator marks zones where price has a high probability of rejection/bouncing off of


VampFX Kill Zone🦇 VampFX Kill Zone Indicator
Built for Smart Money Traders by Vamp FX
This custom Kill Zone tool highlights the optimal institutional trading window — when volume, liquidity, and precision align.
🔹 What It Does:
• Shades the VampFX Kill Zone (default: 8:00 AM to 12:30 PM UTC-4 / New York)
• Designed for New York session scalping/sniping
• Helps isolate high-probability Smart Money setups (liquidity sweeps, FVGs, BOS entries)
🔧 Default Settings:
• Timezone: UTC -4 (New York)
• Session Start: 08:00
• Session End: 12:30
• Adjustable to fit your strategy or local session bias
⸻
📈 Why Use It:
The VampFX Kill Zone reflects when algos run, liquidity gets manipulated, and clean entries occur.
Avoid noise — trade when the market actually moves.
“We don’t chase the market. We wait inside the zone… then strike with precision.”
— 🦇 VampFX Code

Horizontal Lines [Vynkron]📄 Script Description – "Horizontal Lines "
This Pine Script v6 indicator draws up to 11 customizable horizontal lines on your chart, ideal for marking round levels, support/resistance zones, or psychological price points (e.g. every 100 points on the NQ).
🔧 Features:
11 price inputs (default: 22000 to 23000, step 100)
Single color, width, and style configuration for all lines
Uses hline() so lines are fixed across the full chart
Easy to adjust or toggle lines individually
💡 Use Cases:
Highlighting round-number levels on instruments like Nasdaq 100 Futures
Visualizing major price zones
Manual technical analysis without scripting loops
Let me know if you want to make it dynamic, add labels, or only draw lines within the visible chart range.

USDT + USDC Dominance USDT + USDC Dominance: This refers to the combined market capitalization of Tether (USDT) and USD Coin (USDC) as a percentage of the total cryptocurrency market capitalization. It measures the proportion of the crypto market held by these stablecoins, which are pegged to the US dollar. High dominance indicates a "risk-off" sentiment, where investors hold stablecoins for safety during market uncertainty. A drop in dominance suggests capital is flowing into riskier assets like altcoins, often signaling a bullish market or the start of an "alt season.

Sniper Mini VWAPThis script plots dynamic, session-based VWAPs for key intraday timeframes:
1H (green), 4H (orange), 8H (purple), and Daily (red).
Each VWAP resets at the start of its own session, giving traders a real-time view of price relative to average volume-weighted value. These lines often act as intraday support, resistance, or liquidity magnets — great for scalping, fade setups, and sniper-style entries.
You can toggle each VWAP on or off for a cleaner chart.
This version does not use anchored VWAPs — it’s designed for traders who need fast feedback as price develops within active sessions.

Profitable Loser Model [MMT]Profitable Loser Model
Overview
The Profitable Loser Model is a powerful PineScript v6 indicator designed to enhance your trading by visualizing key price levels, session open zones, Fibonacci retracements, and premium/discount zones. This overlay indicator provides traders with a customizable toolkit to analyze market structure across any timeframe, making it ideal for intraday and swing trading strategies.
Features
Open Zone Visualization
- Plots a box based on the open and close of the first candle in a user-defined timeframe (default: 5-minute).
- Customizable box color, projection offset, and label size (Tiny, Small, Normal, Large).
- Displays a timeframe label (e.g., "5m Open Zone") for quick reference, toggleable on/off.
Session Open Lines
- Optionally draws horizontal lines at key session opens (8:30 AM, 9:30 AM, 1:30 PM, Midnight, New York time).
- Customize line color, style (Solid, Dashed, Dotted), width, and label size for each session.
- Perfect for identifying critical intraday price levels.
Premium and Discount Zones
- Highlights premium (above midpoint) and discount (below midpoint) zones based on session high/low.
- Toggleable with customizable colors and projection offsets.
- Helps traders spot overbought/oversold areas for potential mean-reversion trades.
Fibonacci Retracement Levels
- Plots user-defined Fibonacci levels (default: 0.23, 0.35, 0.5, 0.62, 0.705, 0.79, 0.886, 1, 1.1).
- Customizable line style, width, color, and labels (showing percentage and/or price).
- Dynamically adjusts based on price movement relative to the open zone.
Take Profit (TP) and Stop Loss (SL) Levels
- Highlights TP (default: 0.23) and SL (default: 1.1) Fibonacci levels with distinct colors.
- Fully customizable to align with your risk-reward strategy.
How It Works
- Session Detection : Resets daily (or per user-defined timeframe) to capture the first candle's open, high, low, and close.
- Open Zone : Draws a box between the open and close, extended forward by the projection offset.
- Session Lines : Plots lines at specified session opens with customizable styles and labels.
- Fibonacci Retracement : Adjusts levels dynamically based on session high/low and price action.
- Premium/Discount Zones : Calculated from the session range midpoint, updated in real-time.
Settings
- Open Zone :
- Timeframe (default: 5m), Calculate Timeframe (default: Daily).
- Toggle label, adjust size, box color, and projection offset.
- Session Open Lines :
- Enable/disable lines for 8:30 AM, 9:30 AM, 1:30 PM, Midnight.
- Customize color, style, width, label size, and vertical offset.
- Premium/Discount Zones :
- Toggle visibility, set colors, and adjust projection offset.
- Fibonacci Retracement :
- Toggle visibility, set custom levels, line style, width, color, and label options.
- Adjust projection offset.
- TP/SL :
- Set TP/SL Fibonacci levels and colors.
Use Cases
- Intraday Trading : Use session open lines and open zones to trade key market hours.
- Swing Trading : Leverage Fibonacci levels for potential reversal or continuation zones.
- Risk Management : Set precise TP/SL levels based on Fibonacci retracements.
- Market Structure : Identify overbought/oversold zones with premium/discount areas.
Notes
- Optimized with `dynamic_requests = true` for efficient real-time data handling.
- Visual elements (boxes, lines, labels) are cleaned up at the start of each new session.
- Session lines use New York time (`America/New_York`) for alignment with major markets.


Alpha VIX - with Stop loss built inCapture UVIX spikes with laser-sharp entries, crystal-clear exits, and built-in risk control.
▶️ Entry only when the key SMAs align, Williams %R momentum crosses up from oversold.
🛑 Exit on the very first hint of momentum fading (ROC turning down or %R cross) or a hard 2.3% stop-loss off your exact fill price.
📈 Visual signals: Green ▲ marks your entry price; red ▼ marks your exit price + P&L.
💡 Proven edge in volatile markets—no repainting, no guessing.
Based on 10 year study of the VIX and trends.
This indicator should get your nice alpha +100% p/y, when most ETFs / stocks dip. Got questions or want invite-only access to the pro 10x alpha version? DM me on TradingView and I’ll get you set up!

Wick x2 Body + 2-Candle Trend [Gold Futures]This indicator highlights potential reversal candles on Gold Futures using a combination of wick/body ratio and trend confirmation.
🔍 Logic:
Highlights a candle yellow when:
The wick is at least 2x the size of the body
The total candle size is ≥ 50 ticks (5 points)
The previous 2 candles are in the same direction (bullish or bearish) as the wick candle
📈 Interpretation:
Bullish Signal = Long lower wick on a green candle, following 2 bullish candles
Bearish Signal = Long upper wick on a red candle, following 2 bearish candles
Use this to spot overextended moves that may be due for a reversal — especially around key zones or session opens.

StratNinjaTableThe StratNinjaTable is a comprehensive technical analysis tool for TradingView designed to provide traders with a multi-timeframe overview of a security's performance and key metrics in a single, customizable table.
This indicator is built around "The Strat" candlestick methodology, which focuses on inside bars (1), trending bars (2U for up, 2D for down), and outside bars (3). It displays this information across multiple, user-selected timeframes simultaneously, from minutes to yearly charts.
Key Features
Multi-Timeframe "Strat" Analysis: The core of the indicator is a table that shows the current "Strat" number (1, 2U, 2D, or 3) and the directional bias (▲ for up, ▼ for down) for each selected timeframe. This allows for a quick assessment of market structure and potential setups across different chart periods.
Customizable Timeframe Selection: Users can easily select which timeframes they want to monitor, including standard intervals like 5-minute, 15-minute, hourly, daily, weekly, and monthly charts.
Comprehensive Data Table: Beyond the "Strat" analysis, the indicator populates a detailed table with essential market data:
Ticker Information: Displays the current ticker and the chart's timeframe.
Money Flow Index (MFI): Shows the MFI value, with color-coded backgrounds to highlight overbought (>80) and oversold (<20) conditions.
Average True Range (ATR): Provides the ATR value and its percentage relative to the closing price, with color signals for low or high volatility.
Market Cap: Calculates and displays the security's market capitalization.
Sector Information: Shows the sector the security belongs to.
Moving Average Data: Includes the distance of the current price from the 20-day Simple Moving Average (SMA), expressed as a percentage.
Volume: Displays the 30-day average trading volume.
Strat Pattern Prediction: Shows a historical sequence of the last two Strat patterns and a potential future pattern based on the current bar's direction.
Timeframe Countdown: A timer for each timeframe shows how much time is left until the current candle closes.
Customizable Appearance: The indicator offers extensive customization options for the table's position on the screen and the colors used for different "Strat" bar types, allowing users to tailor the visual presentation to their preferences.
In essence, the StratNinjaTable serves as an all-in-one dashboard, enabling traders to quickly gauge market sentiment, identify confluence across timeframes, and access key technical data without cluttering their charts with multiple separate indicators.

Relative Volume Candle Shaderthis indicator is based on the work of M0rty's "candle color by volume z-score"
I've taken M0rty's indicator a few steps further to yield a wider range of outputs, showing both extreme high and extreme lows of volume in 2 gradients.
the brightness of the candle is based on the z-score. brighter candles have unusually high volume, and dimmer candles have unusually low volume.


OSOK Protection Pad v2.1.2OSOK Protection Pad v2.1.2
The OSOK Protection Pad is a dynamic price action tool designed for active traders seeking precise visual cues for risk management and trade planning. This indicator automatically plots customizable protection pad levels above and below the current price, updating in real time as the market moves. Users can set the pad distance in points and personalize line color, style, and width for both buy (green, above price) and sell (red, below price) pads.
Key features:
Continuously adjusting pad lines that move with the current price, providing instant reference for stop placement or trade entry/exit zones.
Clean, non-intrusive visuals with dotted or solid lines and compact labels, ensuring clarity without obstructing price action.
Simple, intuitive settings panel for quick adjustments to pad distance and appearance.
Ideal for discretionary and systematic traders who want to reinforce discipline and structure in their intraday or swing trading routines.
Add the OSOK Protection Pad to your chart to enhance your risk management and stay visually aligned with your trading plan

NASDAQ Liquidity Breaker Bot1. Define session time (7:20 PM – 7:40 PM BD time / 9:20–9:40 AM EST)
2. Detect 15M swing high/low zones
3. On 1M chart: Detect strong bullish/bearish break
4. Identify breaker candle zone
5. Trigger entry based on break + retest logic
6. Set SL and TP logic (dynamic if needed)
7. Plot everything visually (entries, exits, zones)

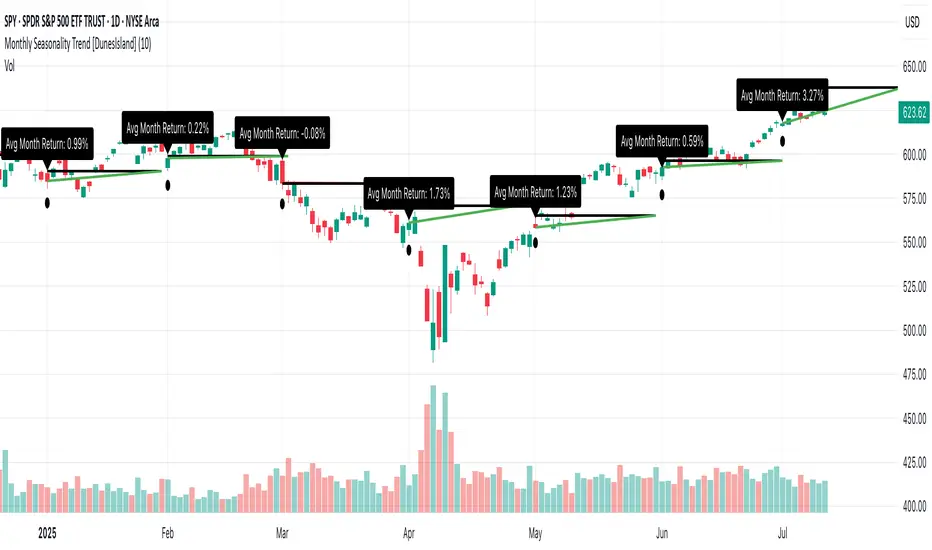
Monthly Seasonality Trend [DunesIsland]The Monthly Seasonality Trend is a indicator designed to analyze and visualize historical monthly seasonality patterns in financial markets. By calculating the average monthly return over a user-configurable lookback period (1 to 10 years), this indicator provides traders and investors with a clear projection of potential price movements for the current month, enabling data-driven decision-making.
How It Works
The indicator operates by retrieving monthly open and close prices for the specified lookback period (up to 10 years) and computing the average percentage return for the current month based on historical data. Key functionalities include:
Dynamic Trend Line: On the first trading day of each month, the indicator plots a line projecting the expected price trajectory, starting from the current close price and extending to the estimated end-of-month price based on the average historical return. The line is colored green for anticipated price increases or red for expected declines, offering an intuitive visual cue.
Average Return Label: A label is displayed at the start of each month, detailing the calculated average historical return for that month, expressed as a percentage, to provide context for the projected trend.
First Trading Day Marker: A small circle is plotted below the bar on the first trading day of each month, clearly marking the start of the projection period.
Adaptive Bar Counting: The indicator dynamically adjusts the length of the trend line based on the actual number of trading days in the previous month, ensuring accurate projections.
How to Interpret
Bullish Projection (Green Line): Indicates that historical data suggests an average price increase for the current month, potentially signaling buying opportunities.
Bearish Projection (Red Line): Suggests an average price decline based on historical trends, which may prompt caution or short-selling strategies.
Historical Context: The average return label provides a quantitative measure of past performance, helping traders assess the reliability of the projected trend.
Turtle Trading System + ATR Trailing StopIndicator Description: Turtle ATR Trailing Stop
The **Turtle ATR Trailing Stop** is a technical indicator designed to enhance the classic Turtle Trading System by incorporating a dynamic trailing stop based on the Average True Range (ATR). This indicator is ideal for traders seeking to manage risk and lock in profits on both long and short positions in trending markets.
Key Features:
- Turtle Trading Levels: Calculates the 20-day highest high and lowest low to identify potential breakout points, a core principle of the Turtle Trading System.
- ATR-Based Trailing Stop: Utilizes a trailing stop that adjusts dynamically based on a multiple of the ATR (default multiplier: 2.0), providing a volatility-adjusted exit mechanism.
- Position Flexibility: Supports both long and short positions, with the trailing stop positioned below the highest price for long trades and above the lowest price for short trades.
- Smooth Updates: The trailing stop updates on each bar, ensuring a more responsive adjustment to price movements, rather than only on new highs or lows.
- Reset Mechanism: Automatically resets the trailing stop when the price deviates significantly (configurable threshold, default 0.1%), adapting to major trend reversals.
- Alerts: Includes customizable alerts that trigger when the price reaches the trailing stop level, notifying traders of potential exit points.
- Debugging Tools: Features an on-chart debug table displaying ATR, Close, Highest Price, Lowest Price, Potential Stop, and Trailing Stop values for real-time analysis.
How It Works:
- For **Long Positions**: The trailing stop starts below the initial close price (minus 2*ATR) and moves up as the highest price increases, locking in profits while trailing at a fixed ATR distance.
- For **Short Positions**: The trailing stop starts above the initial close price (plus 2*ATR) and moves down as the lowest price decreases, protecting against upward price movements.
- The stop resets if the price falls (for long) or rises (for short) beyond the set threshold, ensuring adaptability to new market conditions.
Customization:
- Period Settings: Adjust the length for highs/lows (default 20) and ATR period (default 14).
- ATR Multiplier: Modify the distance of the trailing stop (default 2.0).
- Reset Threshold: Fine-tune the percentage at which the stop resets (default 0.1%).
- Position Type: Switch between "Long" and "Short" modes via input settings.
Usage:
Apply this indicator to any chart in TradingView, set your preferred parameters, and monitor the trailing stop line (yellow) alongside the Turtle highs (red) and lows (blue). Use the debug table to validate calculations and set alerts to stay informed of stop triggers.
This indicator combines the trend-following strength of the Turtle System with a flexible, ATR-based stop-loss strategy, making it a powerful tool for both manual and automated trading strategies.

Up/Down Volume Delta %this script is based on FractalTrade_'s rendition of the up/down volume bars.
the shortcomings of that chart were that large volume bars caused the auto-scaling to shrink smaller volume bar displays to the point where much of the data was too small to see.
in this chart, the bars are displaying the percent delta out of the total bar volume. this way, large overall volume bars do not cause visual compression to everything else in the chart.
I've used color modulation to indicate relation to a relative volume point, so users can still tell when overall volume is large or small. when volume is under a moving average, the bars will display at a basis transparency. when the volume is over the average, the brightness will increase up to a specific ratio of volume defined by the user.
for example, if basis transparency is at 20, and the full opacity ratio is at 3, and the volume average is at 1M, a volume of 750k will display the delta bar at the basis transparency. a volume of 3M will achieve full brightness. a volume of 2M will display with moderate brightness (about 60%), but still stand out against other bars with basis transparency.
areas of the chart that are either increasing bar sizes or increasing in brightness can indicate directional force. when volume delta direction contradicts the candle direction, this can indicate support / resistance.
