Indicators and strategies

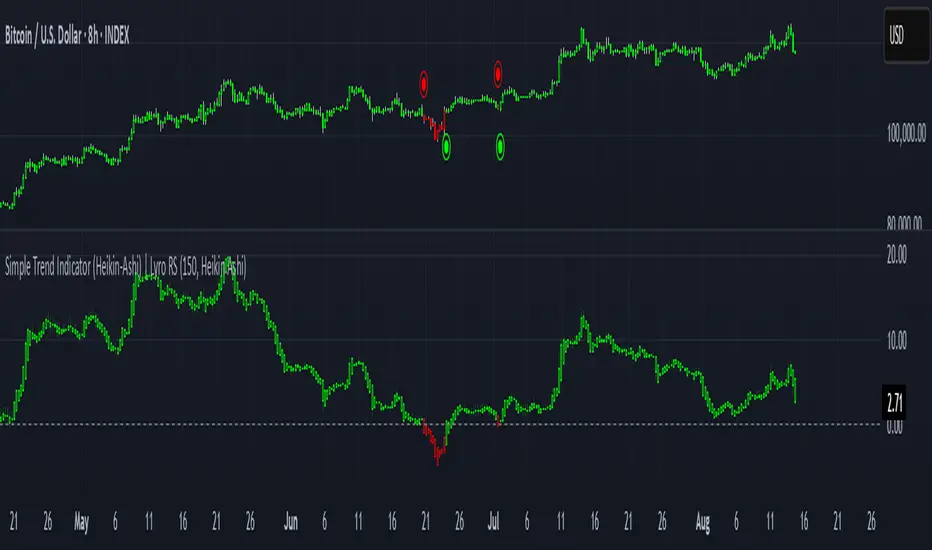
Simple Trend Indicator (Heikin-Ashi) | Lyro RSSimple Trend Indicator (Heikin-Ashi)
A momentum oscillator using Heikin-Ashi smoothed data to filter trend direction with zero-line crosses.
This indicator calculates the normalized deviation of Heikin-Ashi OHLC values from their Simple Moving Average (SMA), then averages these deviations into a single oscillator. It simplifies trend detection by:
Reducing noise via Heikin-Ashi smoothing.
Highlighting momentum shifts through a zero-line cross system (bullish/bearish).
Providing clear visual signals with color-coded plots and directional dots.
Originality:
Unlike standard momentum oscillators, this tool uniquely combines:
Heikin-Ashi normalization for cleaner trend analysis.
Multi-component averaging (high, open, low, close) to balance sensitivity.
Minimalist design for clutter-free charting.
How It Works:
Data Input: Fetches Heikin-Ashi OHLC values using request.security().
Momentum Calculation: For each Heikin-Ashi component:
Computes % deviation from its SMA: (value − SMA(value, length)) / SMA(value, length) * 100.
Oscillator: Averages deviations of all four components into one line (sum).
Signals:
Bullish: Oscillator > 0 (green).
Bearish: Oscillator < 0 (red).
Cross Confirmation: Dots (⦿) mark zero-line crosses.
Usage:
Trend Following: Enter long/short on sustained oscillator breaks above/below zero.
Reversal Watch: Zero-line crosses may hint at weakening momentum.
Filter: Combine with volume or support/resistance levels.
⚠️Disclaimer: This indicator is a tool for technical analysis and does not provide guaranteed results. It should be used in conjunction with other analysis methods and proper risk management practices. The creators of this indicator are not responsible for any financial decisions made based on its signals.

Gracias mi Dios Sammy IndicadorNASDAQ:QQQ //@version=5
indicator("Gracias mi Dios Sammy Indicador", overlay=true, max_labels_count=500)
// Cálculo de condiciones de velas
isBullish = close > open
isBearish = close < open
prevBullish = close > open
prevBearish = close < open
// Patrón Alcista (A): vela verde envuelve completamente a la roja previa
bullishEngulfing = isBullish and prevBearish and close > open and open < close
// Patrón Bajista (B): vela roja envuelve completamente a la verde previa
bearishEngulfing = isBearish and prevBullish and close < open and open > close
// Marcar con “A” (alcista) y “B” (bajista)
plotshape(bullishEngulfing, title="Alcista", style=shape.labelup, color=color.green, text="A", size=size.tiny, location=location.belowbar, textcolor=color.white)
plotshape(bearishEngulfing, title="Bajista", style=shape.labeldown, color=color.red, text="B", size=size.tiny, location=location.abovebar, textcolor=color.white)
// Alertas
alertcondition(bullishEngulfing, title="Alerta Alcista", message="Patrón Alcista (A) detectado")
alertcondition(bearishEngulfing, title="Alerta Bajista", message="Patrón Bajista (B) detectado")

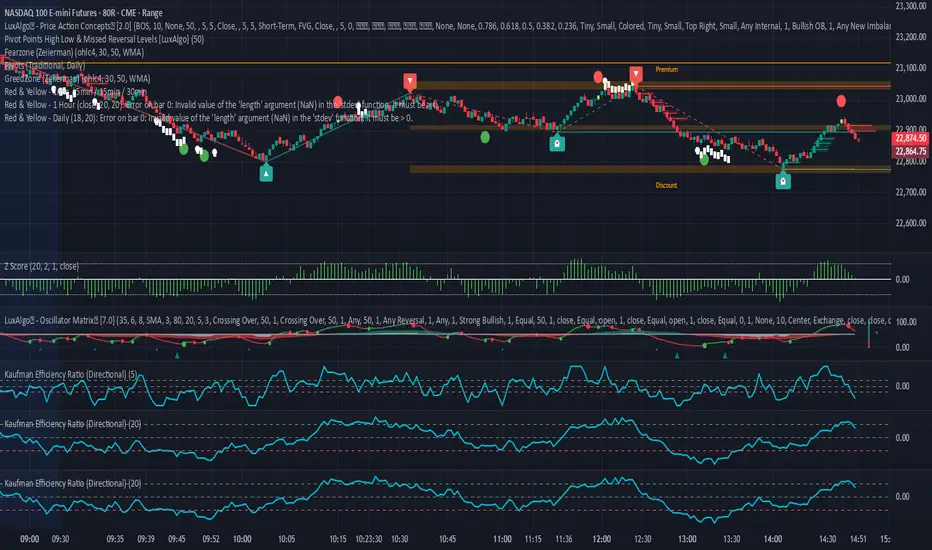
Kaufman Efficiency Ratio (Directional)Kaufman Indicator with negative and positive, i use 30 and negative 30 as trend indicators, some can use it as counter trend...a lot of other kaufman efficiency indicators are only at the positive level so even a short trend has a positive 30 value can be confusing.
ATR % Line from LoD/HoDATR % Line Trading Indicator - Entry Filter Tool
This Pine Script creates a sophisticated ATR (Average True Range) percentage-based entry filter indicator for TradingView that helps traders avoid buying overextended stocks and identify optimal entry zones based on volatility.
Core Functionality - Entry Discipline
The script calculates a maximum entry threshold by taking a percentage of the Average True Range (ATR) and projecting it from the current day's low. This creates a dynamic "no-buy zone" that adapts to market volatility, helping traders avoid purchasing stocks that have already moved too far from their daily base.
Key Calculation:
Measures the ATR over a specified period (default: 14 bars)
Takes a user-defined percentage of that ATR (default: 25%)
Projects this distance from the day's low to establish a maximum entry threshold
Entry Rule: Avoid buying when price exceeds this ATR% level from the daily low or high.
Visual Features
Entry Threshold Line:
Draws a horizontal line at the calculated maximum entry level
Line extends forward for clear visualization of the "no-buy zone"
Red zones above this line indicate overextended conditions
Fully customizable appearance with color, width, and style options
Smart Entry Alerts:
Optional labels show the ATR percentage threshold and exact price level
Visual confirmation when stocks are trading in acceptable entry zones vs. extended areas
Real-Time Monitoring Table:
Displays current distance from daily low as ATR percentage
Shows whether current price is in "safe entry zone" or "extended territory"
Customizable display options for clean chart analysis
Practical Applications for Entry Management
Avoiding Extended Entries:
Primary Use: Don't initiate long positions when price is more than X% ATR from the daily low
Prevents buying stocks that have already made their daily move
Reduces risk of buying at temporary tops within the trading session
Entry Zone Identification:
Price trading below the ATR% line = potential entry opportunity
Price trading above the ATR% line = wait for pullback or skip the trade
Combines volatility analysis with momentum discipline
Risk Management Benefits:
Improved Entry Timing: Enter closer to daily support levels
Better Risk/Reward: Shorter distance to stop loss (daily low)
Reduced Chasing: Systematic approach prevents FOMO-driven entries
Volatility Awareness: Higher volatility stocks get wider acceptable entry ranges
Configuration for Entry Filtering
Key Settings for Entry Management:
ATR Percentage: Set your maximum acceptable extension (15-30% common for day trading)
Reference Point: Use "Low" to measure extension from daily base
Line Style: Make highly visible to clearly see entry threshold
Alert Integration: Visual confirmation of entry-friendly zones
Typical Usage Scenarios:
Conservative Entries: 15-20% ATR from daily low
Moderate Extensions: 25-35% ATR for stronger momentum plays
Aggressive Setups: 40%+ ATR for breakout situations (use with caution)
Entry Strategy Integration
Pre-Market Planning:
Set ATR% threshold based on stock's typical volatility
Identify key levels where entries become unfavorable
Plan alternative entry strategies for extended stocks
Intraday Execution:
Monitor real-time ATR% extension from daily low
Avoid new long positions when threshold is exceeded
Wait for pullbacks to re-enter acceptable entry zones
This tool transforms volatility analysis into practical entry discipline, helping traders maintain consistent entry standards and avoid the costly mistake of chasing overextended stocks. By respecting ATR-based extension limits, traders can improve their entry timing and overall trade profitability.

Advanced Supertrend StrategyA comprehensive Pine Script v5 strategy featuring an enhanced Supertrend indicator with multiple technical filters, risk management, and advanced signal confirmation for automated trading on TradingView.
## Features
- **Enhanced Supertrend**: Configurable ATR-based trend following with improved accuracy
- **RSI Filter**: Optional RSI-based signal filtering to avoid overbought/oversold conditions
- **Moving Average Filter**: Trend confirmation using SMA/EMA/WMA with customizable periods
- **Risk Management**: Built-in stop-loss and take-profit based on ATR multiples
- **Trend Strength Analysis**: Filters weak signals by requiring minimum trend duration
- **Breakout Confirmation**: Optional price breakout validation for stronger signals
- **Visual Interface**: Comprehensive chart plotting with multiple indicator overlays
- **Advanced Alerts**: Multiple alert conditions with detailed signal information
- **Backtesting**: Full strategy backtesting with commission and realistic execution

Ratio-Adjusted McClellan Summation Index RASI NASIRatio-Adjusted McClellan Summation Index (RASI NASI)
In Book "The Complete Guide to Market Breadth Indicators" Author Gregory L. Morris states
"It is the author’s opinion that the McClellan indicators, and in particular, the McClellan Summation Index, is the single best breadth indicator available. If you had to pick just one, this would be it."
What It Does: The Ratio-Adjusted McClellan Summation Index (RASI) is a market breadth indicator that tracks the cumulative strength of advancing versus declining issues for a user-selected exchange (NASDAQ, NYSE, or AMEX). Derived from the McClellan Oscillator, it calculates ratio-adjusted net advances, applies 19-day and 39-day EMAs, and sums the oscillator values to produce the RASI. This indicator helps traders assess market health, identify bullish or bearish trends, and detect potential reversals through divergences.
Key features:
Exchange Selection : Choose NASDAQ (USI:ADVN.NQ, USI:DECL.NQ), NYSE (USI:ADVN.NY, USI:DECL.NY), or AMEX (USI:ADVN.AM, USI:DECL.AM) data.
Trend-Based Coloring : RASI line displays user-defined colors (default: black for uptrend, red for downtrend) based on its direction.
Customizable Moving Average: Add a moving average (SMA, EMA, WMA, VWMA, or RMA) with user-defined length and color (default: EMA, 21, green).
Neutral Line at Zero: Marks the neutral level for trend interpretation.
Alerts: Six custom alert conditions for trend changes, MA crosses, and zero-line crosses.
How to Use
Add to Chart: Apply the indicator to any TradingView chart. Ensure access to advancing and declining issues data for the selected exchange.
Select Exchange: Choose NASDAQ, NYSE, or AMEX in the input settings.
Customize Settings: Adjust EMA lengths, RASI colors, MA type, length, and color to match your trading style.
Interpret the Indicator :
RASI Line: Black (default) indicates an uptrend (RASI rising); red indicates a downtrend (RASI falling).
Above Zero: Suggests bullish market breadth (more advancing issues).
Below Zero : Indicates bearish breadth (more declining issues).
MA Crosses: RASI crossing above its MA signals bullish momentum; crossing below signals bearish momentum.
Divergences: Compare RASI with the market index (e.g., NASDAQ Composite) to identify potential reversals.
Large Moves : A +3,600-point move from a low (e.g., -1,550 to +1,950) may signal a significant bull run.
Set Alerts:
Add the indicator to your chart, open the TradingView alert panel, and select from six conditions (see Alerts section).
Configure notifications (e.g., email, webhook, or popup) for each condition.
Settings
Market Selection:
Exchange: Select NASDAQ, NYSE, or AMEX for advancing/declining issues data.
EMA Settings:
19-day EMA Length: Period for the shorter EMA (default: 19).
39-day EMA Length: Period for the longer EMA (default: 39).
RASI Settings:
RASI Uptrend Color: Color for rising RASI (default: black).
RASI Downtrend Color: Color for falling RASI (default: red).
RASI MA Settings:
MA Type: Choose SMA, EMA, WMA, VWMA, or RMA (default: EMA).
MA Length: Set the MA period (default: 21).
MA Color: Color for the MA line (default: green).
Alerts
The indicator uses alertcondition() to create custom alerts. Available conditions:
RASI Trend Up: RASI starts rising (based on RASI > previous RASI, shown as black line).
RASI Trend Down: RASI starts falling (based on RASI ≤ previous RASI, shown as red line).
RASI Above MA: RASI crosses above its moving average.
RASI Below MA: RASI crosses below its moving average.
RASI Bullish: RASI crosses above zero (bullish market breadth).
RASI Bearish: RASI crosses below zero (bearish market breadth).
To set alerts, add the indicator to your chart, open the TradingView alert panel, and select the desired condition.
Notes
Data Requirements: Requires access to advancing/declining issues data (e.g., USI:ADVN.NQ, USI:DECL.NQ for NASDAQ). Some symbols may require a TradingView premium subscription.
Limitations: RASI is a medium- to long-term indicator and may lag in volatile or range-bound markets. Use alongside other technical tools for confirmation.
Data Reliability : Verify the selected exchange’s data accuracy, as inconsistencies can affect results.
Debugging: If no data appears, check symbol validity (e.g., try $ADVN/Q, $DECN/Q for NASDAQ) or contact TradingView support.
Credits
Based on the Ratio-Adjusted McClellan Summation Index methodology by McClellan Financial Publications. No external code was used; the implementation is original, inspired by standard market breadth concepts.
Disclaimer
This indicator is for informational purposes only and does not constitute financial advice. Past performance is not indicative of future results. Conduct your own research and combine with other tools for informed trading decisions.

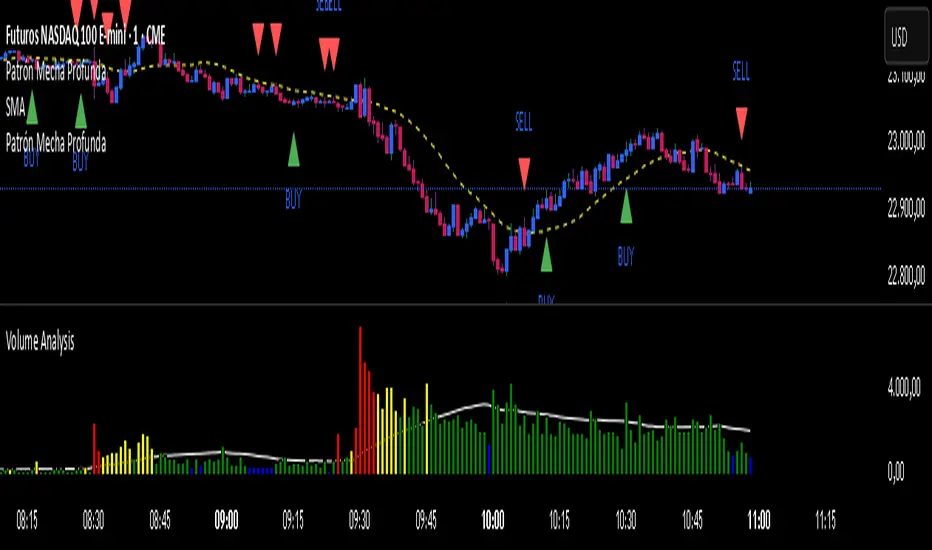
Patrón Mecha ProfundaThis pattern must be combined with a 20-period moving average. It is used to know the direction of the price. When the pattern appears and the price is above the 20-period moving average, it is a bullish signal and vice versa.
H1/L1 Trap MarkerH1 L1 Trap Marker based on Al Brooks PA
You can use it to detect trap traders and help determine your trade.

Wx2 Treasure Box – Institutional EntryBuy:-
Entry: Above the box
SL: Below the box
Sell:-
Entry :Below the box
SL: Above the box
RRR: 1:2
Best Location near 200MA
TF: Any TF
Watch My Video:
youtu.be

Perfect Triple EMA Cross (15min Only)//@version=5
indicator("Perfect Triple EMA Cross (15min Only)", overlay=true)
// ==== Inputs ====
ema20 = ta.ema(close, 20)
ema50 = ta.ema(close, 50)
ema200 = ta.ema(close, 200)
// ==== Timeframe Check ====
is15min = (timeframe.period == "15")
// ==== Conditions ====
buyCond = is15min and ta.crossover(ema20, ema50) and ema20 > ema50 and ema50 > ema200
sellCond = is15min and ta.crossunder(ema20, ema50) and ema20 < ema50 and ema50 < ema200
// ==== Plots ====
plot(ema20, title="EMA 20", color=color.orange, linewidth=1)
plot(ema50, title="EMA 50", color=color.blue, linewidth=1)
plot(ema200, title="EMA 200", color=color.red, linewidth=2)
plotshape(buyCond, title="BUY", location=location.belowbar, style=shape.labelup, color=color.green, size=size.normal, text="BUY")
plotshape(sellCond, title="SELL", location=location.abovebar, style=shape.labeldown, color=color.red, size=size.normal, text="SELL")
// ==== Alerts ====
alertcondition(buyCond, title="BUY Signal", message="Triple EMA BUY Signal (15min)")
alertcondition(sellCond, title="SELL Signal", message="Triple EMA SELL Signal (15min)")

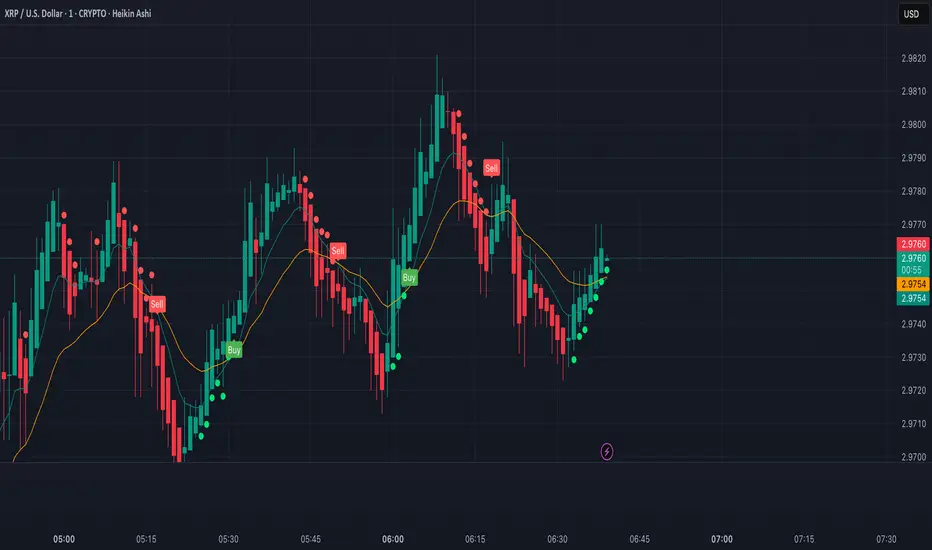
XRP Scalping with EMA Crossover Anticipation This script is designed to detect scalping opportunities on XRP by anticipating EMA crossovers, reinforced with technical confirmation filters.
Methodology
- The core signal is based on the crossover between a fast EMA (9) and a slow EMA (21).
- RSI (14) conditions are applied to avoid weak setups: RSI must be above 40 for buy signals and below 70 for sell signals.
- Before any crossover is validated, the script requires at least two consecutive “pre-crossover” signals. These indicate favorable momentum and convergence conditions before the crossover occurs.
- Final signals are only displayed if this minimum number of preconditions is met.
Application
This system is optimized for scalping on the 1-minute to 5-minute timeframes but can be adapted for longer-term setups by adjusting parameters. The anticipation logic helps reduce lagging entries and improves signal selectivity during volatile conditions.
Both pre-crossover and confirmed crossover conditions include alert options. The code is fully editable and customizable.
KILLZONE INDIWhy Use the "KILLZONE INDI" Indicator?
Are you looking for a reliable tool to enhance your gold trading strategy?
Introducing "KILLZONE INDI", a smart and easy-to-use indicator specifically designed to help traders make informed decisions in the gold market.
What Makes "KILLZONE INDI" Stand Out?
* Tailored for Gold (XAUUSD):
Specially optimized to detect crucial trend changes in gold prices, offering you timely signals to buy or sell.
* Precise Entry Points:
Uses smart moving average crossovers to identify the best moments for entry and exit, reducing guessing and improving profitability.
* Real-Time Alerts:
Get instant notifications when buy or sell signals occur—whether you're at your desk or on the go. Never miss a critical trading opportunity again!
* Easy to Use:
Clear visual signals on your chart show exactly when the market is favorable, perfect for both beginners and experienced traders.
* Ideal for Short-Term Trading:
Designed to generate signals on 1-minute charts, helping you capitalize on quick market movements in the fast-paced gold market.
Why Trader's Love It:
* Increase Confidence:
Making trade decisions becomes easier with accurate signals specific to gold trends.
* Save Time:
Automate your analysis—spend less time guessing and more time trading confidently.
* Maximize Profits:
Spot those crucial moments when the price movement is about to turn, giving you a competitive edge.
Start Using "KILLZONE INDI" Today!
Whether you're looking to refine your short-term trading strategy or want a trustworthy tool to guide your trades in gold markets, "KILLZONE INDI" is the perfect addition to your trading arsenal. Try it now and watch your trading confidence and results improve!

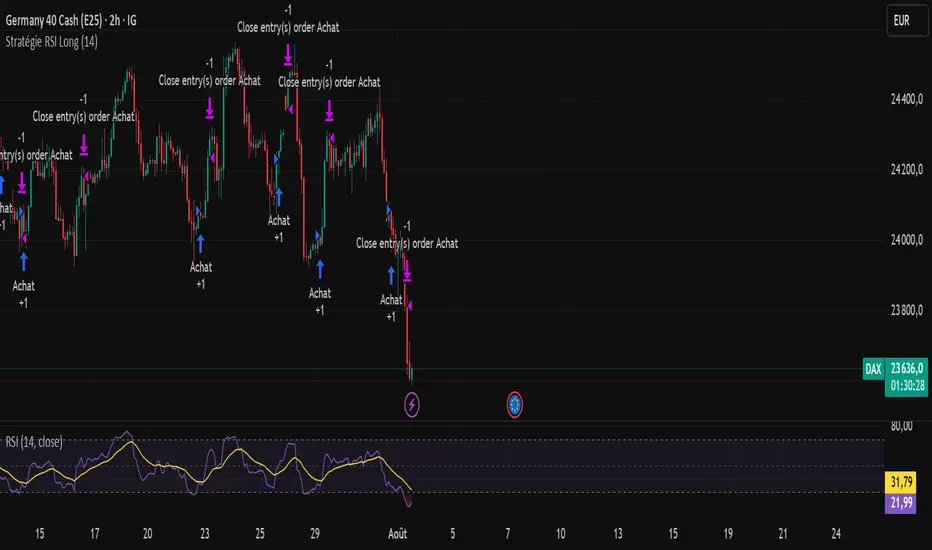
RSI Strategy - Long Position DAX 2 hours - Dow Jones 1 hourLong position strategy based on the RSI.Works very well on the DAX 40 (2-hour base) and the DOW (1-hour base).The entry signal is very good. The exit signal (take profit) needs to be reviewed.
Fraktály a Trendovkyal shlash dlka sklhsda hasd klnasdnlkcalknacs 654 as64asd 65ads 156as 13ads 32asd 165as


Scalping Strategy2//version=6
strategy("DOGE/USDT 5X Scalping Strategy", overlay=true, margin_long=20, margin_short=0)
// === Core Parameters ===
fastEMA = input.int(5, "Fast EMA Length", minval=1, maxval=20)
slowEMA = input.int(12, "Slow EMA Length", minval=2, maxval=50)
trendEMA = input.int(55, "Trend EMA Length", minval=10, maxval=200)
atrPeriod = input.int(14, "ATR Period", minval=1, maxval=50)
tradeInterval = input.int(72, "Minutes Between Trades", minval=1, maxval=1440)
// Risk Management
slMultiplier = input.float(1.5, "Stop-Loss (ATR Multiple)", minval=0.5, maxval=5.0, step=0.1)
tpMultiplier = input.float(1.2, "Take-Profit (ATR Multiple)", minval=0.5, maxval=10.0, step=0.1)
riskPct = input.float(1.0, "Risk Per Trade (%)", minval=0.1, maxval=10.0, step=0.1)
leverage = 5.0 // Fixed 5x leverage
// === Calculate Indicators ===
fastLine = ta.ema(close, fastEMA)
slowLine = ta.ema(close, slowEMA)
trendLine = ta.ema(close, trendEMA)
atrValue = ta.atr(atrPeriod)
rsiValue = ta.rsi(close, 14)
// === Visualize Indicators ===
plot(fastLine, "Fast EMA", color=#2196F3, linewidth=2)
plot(slowLine, "Slow EMA", color=#FF9800, linewidth=2)
plot(trendLine, "Trend EMA", color=#757575, linewidth=1)
// Cross detection for visualization
crossUp = ta.crossover(fastLine, slowLine)
crossDown = ta.crossunder(fastLine, slowLine)
plotshape(crossUp, "EMA Cross Up", style=shape.triangleup, location=location.belowbar, color=color.green, size=size.small)
plotshape(crossDown, "EMA Cross Down", style=shape.triangledown, location=location.abovebar, color=color.red, size=size.small)
// === Trade Logic ===
var int lastTradeBarIndex = 0
timeElapsed = (bar_index - lastTradeBarIndex) >= tradeInterval
noActivePosition = strategy.position_size == 0
// Enhanced Entry Conditions - 80%+ win rate optimizations
emaCross = ta.crossover(fastLine, slowLine)
trendFilter = close > trendLine
priceStrength = close > open and close > close // Strong bullish momentum
rsiFilter = rsiValue > 40 and rsiValue < 68 // Avoid overbought conditions
validEntry = emaCross and trendFilter and timeElapsed and noActivePosition and priceStrength and rsiFilter
// Position sizing calculation
equity = strategy.equity
riskAmount = equity * (riskPct / 100)
stopDistance = atrValue * slMultiplier
positionSize = math.round((riskAmount / stopDistance) * leverage)
// === Strategy Execution ===
if (validEntry)
strategy.entry("Long", strategy.long, qty=positionSize)
stopPrice = close - (atrValue * slMultiplier)
targetPrice = close + (atrValue * tpMultiplier)
strategy.exit("Exit", "Long", stop=stopPrice, limit=targetPrice)
lastTradeBarIndex := bar_index
line.new(bar_index, stopPrice, bar_index+20, stopPrice, color=color.red, width=1)
line.new(bar_index, targetPrice, bar_index+20, targetPrice, color=color.green, width=1)
// Early Exit Logic
inTrade = strategy.position_size > 0
if (inTrade and rsiValue > 75) // Take profit early if RSI gets too high
strategy.close("Long", comment="RSI Exit")

Peak & Valley Screener RadarThis Pine Script indicator is designed to help traders and investors analyze the percentage distance of stock prices from their recent All-Time High (ATH) and All-Time Low (ALH) over a user-defined number of bars.
It functions as a multi-stock screener, scanning a customizable list of stocks (default: 40 BIST 500 stocks) and displaying results in a dynamic table on the chart.
The script identifies stocks that have pulled back more than a specified percentage from their ATH (potential buying opportunities) or risen less than a specified percentage from their ALH (potential caution zones).
Key Features:
Customizable Stock List: Users can input a comma-separated list of stock tickers (e.g., "AAPL,GOOGL,MSFT") to scan any symbols available on TradingView.
User-Defined Parameters: Adjust the lookback period (bars back, default 250), ATH pullback threshold (default 10%), and ALH rise threshold (default 10%).
Dynamic Table Display: Results are shown in a table with two columns: "Distance to TOP" (ATH pullbacks in red) and "Distance to BOTTOM" (ALH rises in green). The table includes input parameters for quick reference and can be positioned anywhere on the chart (top/bottom left/center/right).
Optional Plots: Toggle plots to visualize the percentage distances for the current chart symbol (red for ATH, green for ALH).
Efficient Data Handling: Uses request.security with tuples for optimized multi-symbol data fetching, supporting up to ~80 stocks without exceeding Pine Script limits (adjust table rows if needed for more).
Real-Time Updates: The table updates only on the last bar for performance efficiency.
How It Works:
The script calculates the highest high and lowest low over the specified bars for each stock.
It computes the percentage difference from the current close: negative for ATH (pullback) and positive for ALH (rise).
Stocks meeting the thresholds are listed in the table with their exact percentages.
Usage Tips:
Apply this indicator to any chart (e.g., a BIST index or stock) to run the screener in the background.
Ideal for swing traders scanning for undervalued stocks near ATH or overbought near ALH.
Note: Performance may vary with large stock lists due to TradingView's security call limits (~40-50 calls per script). Test with smaller lists if needed.
You can bypass the 40-stock limit by adding the indicator twice to the chart, entering 40 different stocks in the second indicator and setting a different table position from the first one, allowing you to scan 80 stocks simultaneously. In fact, this way, you can scan as many stocks as your plan's limits allow.
This script is released under the Mozilla Public License 2.0. Feedback and suggestions are welcome, but please adhere to TradingView's House Rules—no guarantees of profitability, use at your own risk.Disclaimer: This is not financial advice. Past performance does not predict future results. Always conduct your own research.

Lorentzian Key Support and Resistance Level Detector [mishy]🧮 Lorentzian Key S/R Levels Detector
Advanced Support & Resistance Detection Using Mathematical Clustering
The Problem
Traditional S/R indicators fail because they're either subjective (manual lines), rigid (fixed pivots), or break when price spikes occur. Most importantly, they don't tell you where prices actually spend time, just where they touched briefly.
The Solution: Lorentzian Distance Clustering
This indicator introduces a novel approach by using Lorentzian distance instead of traditional Euclidean distance for clustering. This is groundbreaking for financial data analysis.
Data Points Clustering:
🔬 Why Euclidean Distance Fails in Trading
Traditional K-means uses Euclidean distance:
• Formula: distance = (price_A - price_B)²
• Problem: Squaring amplifies differences exponentially
• Real impact: One 5% price spike has 25x more influence than a 1% move
• Result: Clusters get pulled toward outliers, missing real support/resistance zones
Example scenario:
Prices: ← flash spike
Euclidean: Centroid gets dragged toward 150
Actual S/R zone: Around 100 (where prices actually trade)
⚡ Lorentzian Distance: The Game Changer
Our approach uses Lorentzian distance:
• Formula: distance = log(1 + (price_difference)² / σ²)
• Breakthrough: Logarithmic compression keeps outliers in check
• Real impact: Large moves still matter, but don't dominate
• Result: Clusters focus on where prices actually spend time
Same example with Lorentzian:
Prices: ← flash spike
Lorentzian: Centroid stays near 100 (real trading zone)
Outlier (150): Acknowledged but not dominant
🧠 Adaptive Intelligence
The σ parameter isn't fixed,it's calculated from market disturbance/entropy:
• High volatility: σ increases, making algorithm more tolerant of large moves
• Low volatility: σ decreases, making algorithm more sensitive to small changes
• Self-calibrating: Adapts to any instrument or market condition automatically
Why this matters: Traditional methods treat a 2% move the same whether it's in a calm or volatile market. Lorentzian adapts the sensitivity based on current market behavior.
🎯 Automatic K-Selection (Elbow Method)
Instead of guessing how many S/R levels to draw, the indicator:
• Tests 2-6 clusters and calculates WCSS (tightness measure)
• Finds the "elbow" - where adding more clusters stops helping much
• Uses sharpness calculation to pick the optimal number automatically
Result: Perfect balance between detail and clarity.
How It Works
1. Collect recent closing prices
2. Calculate entropy to adapt to current market volatility
3. Cluster prices using Lorentzian K-means algorithm
4. Auto-select optimal cluster count via statistical analysis
5. Draw levels at cluster centers with deviation bands
📊 Manual K-Selection Guide (Using WCSS & Sharpness Analysis)
When you disable auto-selection, use both WCSS and Sharpness metrics from the analysis table to choose manually:
What WCSS tells you:
• Lower WCSS = tighter clusters = better S/R levels
• Higher WCSS = scattered clusters = weaker levels
What Sharpness tells you:
• Higher positive values = optimal elbow point = best K choice
• Lower/negative values = poor elbow definition = avoid this K
• Measures the "sharpness" of the WCSS curve drop-off
Decision strategy using both metrics:
K=2: WCSS = 150.42 | Sharpness = - | Selected =
K=3: WCSS = 89.15 | Sharpness = 22.04 | Selected = ✓ ← Best choice
K=4: WCSS = 76.23 | Sharpness = 1.89 | Selected =
K=5: WCSS = 73.91 | Sharpness = 1.43 | Selected =
Quick decision rules:
• Pick K with highest positive Sharpness (indicates optimal elbow)
• Confirm with significant WCSS drop (30%+ reduction is good)
• Avoid K values with negative or very low Sharpness (<1.0)
• K=3 above shows: Big WCSS drop (41%) + High Sharpness (22.04) = Perfect choice
Why this works:
The algorithm finds the "elbow" where adding more clusters stops being useful. High Sharpness pinpoints this elbow mathematically, while WCSS confirms the clustering quality.
Elbow Method Visualization:
Traditional clustering problems:
❌ Price spikes distort results
❌ Fixed parameters don't adapt
❌ Manual tuning is subjective
❌ No way to validate choices
Lorentzian solution:
☑️ Outlier-resistant distance metric
☑️ Entropy-based adaptation to volatility
☑️ Automatic optimal K selection
☑️ Statistical validation via WCSS & Sharpness
Features
Visual:
• Color-coded levels (red=highest resistance, green=lowest support)
• Optional deviation bands showing cluster spread
• Strength scores on labels: Each cluster shows a reliability score.
• Higher scores (0.8+) = very strong S/R levels with tight price clustering
• Lower scores (0.6-0.7) = weaker levels, use with caution
• Based on cluster tightness and data point density
• Clean line extensions and labels
Analytics:
• WCSS analysis table showing why K was chosen
• Cluster metrics and statistics
• Real-time entropy monitoring
Control:
• Auto/manual K selection toggle
• Customizable sample size (20-500 bars)
• Show/hide bands and metrics tables
The Result
You get mathematically validated S/R levels that focus on where prices actually cluster, not where they randomly spiked. The algorithm adapts to market conditions and removes guesswork from level selection.
Best for: Traders who want objective, data-driven S/R levels without manual chart analysis.
Credits: This script is for educational purposes and is inspired by the work of @ThinkLogicAI and an amazing mentor @DskyzInvestments . It demonstrates how Lorentzian geometrical concepts can be applied not only in ML classification but also quite elegantly in clustering.

Midnight OpenMidnight Opening Price because there wasn't a single indicator that was specifically marking this.

Market Energy – Trend vs Retest (with Saturation %)Market Energy – Trend vs Retest Indicator
This indicator measures the bullish and bearish energy in the market based on volume-weighted price changes.
It calculates two smoothed energy waves — bullish energy and bearish energy — using exponential moving averages of volume-adjusted price movements.
The indicator detects trend changes and retests by comparing the relative strength of these waves.
A saturation percentage quantifies the intensity of the current dominant side (bulls or bears) relative to recent highs.
- High saturation (>70%) indicates strong momentum and dominance by bulls or bears.
- Low saturation (<30%) suggests weak momentum and possible market indecision or consolidation.
The background color highlights the current control: green for bulls, red for bears, with transparency indicating the saturation level.
A label shows which side is currently in control along with the saturation percentage for quick interpretation.
Use this tool to identify strong trends, possible retests, and momentum strength to support your trading decisions.

XAUUSD & BTCUSD Buy/Sell Signals (80% Accuracy)this script gives approx 80% real and correct indicators depending on market
