MA Crossover with +100 Target Label//@version=5
indicator("MA Crossover with +100 Target Label", overlay=true)
// === Input Parameters ===
shortPeriod = input.int(10, title="Short MA Period")
longPeriod = input.int(100, title="Long MA Period")
pointTarget = input.float(100.0, title="Target Points", step=0.1)
// === Moving Averages ===
shortMA = ta.sma(close, shortPeriod)
longMA = ta.sma(close, longPeriod)
// === Plotting MAs ===
plot(shortMA, title="Short MA", color=color.orange)
plot(longMA, title="Long MA", color=color.blue)
// === Crossover Detection ===
bullishCross = ta.crossover(shortMA, longMA)
bearishCross = ta.crossunder(shortMA, longMA)
// === Variables to Track Entry and Targets ===
var float buyPrice = na
var float sellPrice = na
var bool buyActive = false
var bool sellActive = false
// === On Buy Signal ===
if bullishCross
buyPrice := close
buyActive := true
sellActive := false // Reset opposite signal
sellPrice := na
label.new(bar_index, low, "Buy", style=label.style_label_up, color=color.green, textcolor=color.white)
// === On Sell Signal ===
if bearishCross
sellPrice := close
sellActive := true
buyActive :=
Indicators and strategies

RSI, CCI, ADX Panel (Custom TF for Each)RSI, CCI, and ADX Combined – Multi-Timeframe, Fully Customizable Panel Indicator for TradingView
Overview
This Pine Script indicator integrates the Relative Strength Index (RSI), Commodity Channel Index (CCI), and Average Directional Index (ADX) into a single, clean panel for effortless technical analysis. Each indicator operates independently, with customizable length, smoothing, and time frame for maximum flexibility. Traders can now monitor momentum, trend strength, and overbought/oversold conditions across different time frames—all in one place.
Key Features
Independent Controls: Set length, smoothing (ADX), and time frame individually for each indicator via the settings panel.
Multi-Timeframe Support: Each oscillator (RSI, CCI, ADX) can be calculated on its own time frame, enabling nuanced inter-timeframe analysis.
Customizable Visualization: Adjust line color and thickness for each indicator to match your chart style.
Clean, Non-Overlay Display: All three indicators are plotted in a dedicated panel beneath the price chart, reducing clutter.
Reference Levels: Includes standard reference lines for oversold/overbought (RSI, CCI) and trend threshold (ADX) for quick visual cues.
Usage Ideas
Swing Trading: Compare short- and long-term momentum using different time frames for RSI, CCI, and ADX.
Trend Confirmation: Use ADX to filter RSI and CCI signals—only trade overbought/oversold conditions during strong trends.
Divergence Hunting: Spot divergences between time frames for early reversal signals.
Scalping: Set RSI and CCI to lower time frames for entry, while monitoring higher timeframe ADX for trend context.
How to Install
Paste the script into the Pine Editor on TradingView.
Add to chart. Adjust settings as desired.
Save as a template for quick reuse on any chart—all your custom settings will be preserved.
Customization
Edit lengths and time frames in the indicator’s settings dialog.
Toggle reference lines on/off as needed.
Fine-tune line appearance (color, thickness) for clarity.
Note:
This indicator does not provide automated buy/sell signals. It is a customizable analytical tool for manual or semi-automated trading. Use in combination with other technical or fundamental analysis for best results.
Combine Momentum, Trend, and Volatility—Seamlessly and Visually—With One Indicator.

Two MA Crossover with Labels//@version=5
indicator("Two MA Crossover with Labels", overlay=true)
// === Input Parameters ===
shortPeriod = input.int(10, title="Short MA Period")
longPeriod = input.int(100, title="Long MA Period")
// === Moving Averages ===
shortMA = ta.sma(close, shortPeriod)
longMA = ta.sma(close, longPeriod)
// === Plotting MAs ===
plot(shortMA, color=color.orange, title="Short MA")
plot(longMA, color=color.blue, title="Long MA")
// === Crossover Conditions ===
bullishCross = ta.crossover(shortMA, longMA)
bearishCross = ta.crossunder(shortMA, longMA)
// === Labels ===
if bullishCross
label.new(bar_index, low, "Buy", style=label.style_label_up, color=color.green, textcolor=color.white)
if bearishCross
label.new(bar_index, high, "Sell", style=label.style_label_down, color=color.red, textcolor=color.white)

Period Separator with DatesSimple period separator with dates. You can customize lines and colours. Feel free to customize and share your thoughts in the comment section. Remember time is the only thing you need to master the markets. Keep your charts clean and enjoy trading! ;)

D-LevelsThis indicator accepts a comma-separated list of price ranges as input and visualizes each range as a distinct zone on the chart, using randomized colors for distinction.

Enhanced Order Block Zones v6I created this indicator to identify orders blocks and label them on timeframes of 15 minutes and lower. This only identifies fairly recent orders blocks based off the performance of the markets. Always remember orders blocks are more accurate at higher timeframes. However, this can be utilized to see more real time orders blocks as they form.

RSI + TSV Kombi📊 RSI + TSV Combo Indicator (Intraday Reversal Tool)
This custom TradingView indicator is designed for intraday traders who want to combine price momentum (via RSI) with volume-based confirmation (via TSV). It’s particularly powerful for spotting short-term reversals around key market zones like VWAP, support/resistance, or options levels.
🧠 What does the Indicator show?
The indicator contains two elements in one pane:
🔹 Top Line – RSI (Relative Strength Index)
Type: RSI(7) – a short-term version of the classic RSI
Color-coded:
🟢 Green when RSI < 30 → potential oversold → bullish bias
🔴 Red when RSI > 70 → potential overbought → bearish bias
⚪ Gray in between → neutral
🔎 Purpose: Identifies overextended price moves — early warning for possible reversal zones.
🔸 Bottom Bars – TSV (Time Segmented Volume)
Formula: EMA(change(close) * volume, 9)
Color-coded histogram:
🟢 Green when TSV > 0 → bullish volume momentum
🔴 Red when TSV < 0 → bearish volume momentum
🔎 Purpose: Confirms whether price moves are supported by actual volume — helps filter false signals from RSI.
⚖️ How to Interpret the Indicator
✅ Long Setup
RSI is below 30 (green line)
TSV bars turn green or cross above 0
Ideally at a support level or near VWAP
➡️ Buy signal confirmed by volume
❌ Short Setup
RSI above 70 (red line)
TSV bars are red or turning red
Ideally at a resistance zone or VWAP deviation
➡️ Sell signal confirmed by selling pressure
⚠️ Avoid trades when...
RSI is oversold/overbought, but TSV disagrees
(e.g. RSI < 30 but TSV is red → weak confirmation)
🧭 Practical Usage in Intraday Trading (e.g. 5-minute chart)
Step What to look for
Setup Zone RSI hits extreme level (under 30 or above 70)
Volume Confirmation TSV bars flip color (red → green or vice versa)
Entry Price breaks candle high/low with volume support
Exit VWAP, volume node, or next support/resistance zone
🔧 Options for Expansion
This script is already running cleanly, but you could easily extend it with:
📍 Buy/Sell Arrows on chart when both RSI + TSV align
🔔 Alerts for instant trade triggers
💡 Overlay version that places symbols directly on the price chart
🔒 Filter to only show signals above/below VWAP
Let me know — I can build any of these for you.
✅ Summary
This RSI + TSV Combo is a simple yet powerful tool to:
Spot momentum reversals
Confirm trades with volume
Stay disciplined and rule-based in fast-moving intraday setups
It’s especially useful when combined with:
VWAP
Volume Profile Zones (HVNs/LVNs)
Key psychological or options levels

ATR HUDThis script displays the Average True Range value for your chart's timeframe and displays it in a small tidy table. ATR is a valuable indicator for position sizing, stop placement, profit expectancy and other trade planning considerations. With this script you can keep the current ATR value visible without taking up much precious window space. You can select your preferred smoothing method, lookback period, and window position in the settings. Enjoy!

Previous Day High/Low/Close - Static Daily Lines (Custom Colors)previous day high low closing
statick line can be change with tihe time frame 5 to 15

Goldbach Swing Points [z3nius]This script checks if the swing point's time (hour + minute) is a Goldbach number. Only works on CME futures charts.

Altcoin Breakout Detector//@version=5
indicator("Altcoin Breakout Detector", overlay=true)
resistanceLevel = input.float(50.0, "Resistance Level", minval=0.0, maxval=100.0)
breakoutZoneTop = input.float(25.0, "Breakout Zone Top", minval=0.0, maxval=100.0)
shortMA = ta.sma(close, 5) // 5-period moving average for trend confirmation
// Define buy signal conditions
lastPrice = close
secondLastPrice = close
lastVolume = volume
avgVolume = ta.sma(volume, 20) // 20-period simple moving average of volume
buySignal = lastPrice > resistanceLevel and secondLastPrice <= resistanceLevel and lastVolume > avgVolume * 1.5 and lastPrice > shortMA
// Plot buy signal
plotshape(buySignal, title="Buy Signal", location=location.belowbar, color=color.green, style=shape.triangleup, size=size.small)
// Highlight breakout zone
hline(breakoutZoneTop, "Breakout Zone", color=color.orange, linestyle=hline.style_dashed)
bgcolor(color.new(color.orange, 90)) // Constant shading for the breakout zone (0 to 25.00)


Trend StrengthTrend Strength Dashboard (11-Point System)
Description:
This indicator is a visually enhanced dashboard that evaluates 11 key technical signals to assess bullish momentum for stocks and ETFs. Each condition is displayed in a easy reading table for quick interpretation and visual appeal.
Signals include:
Higher highs and higher lows
Price above EMA21 and SMA200
SMA50 > SMA200
Positive slope on SMA50 and SMA200
RSI trending upward
Ideal for traders who want a clean, at-a-glance summary of market strength without scanning multiple charts or indicators.

Custom EMA 9/21/50/200Chart Screenshots: Include a chart screenshot showing the EMAs with different colors and line styles (e.g., EMA 9 dashed, EMA 21 dotted, EMA 50 solid, EMA 200 solid) to demonstrate the visual output.
Backtest Results: If you want to add credibility, you can mention that the indicator is designed for visual analysis but can be integrated into strategies (though no trading logic is included here).
TradingView Guidelines: Ensure compliance with TradingView’s publishing rules (e.g., original content, no misleading claims).
This description is concise yet comprehensive, highlighting the indicator’s features and usability to attract traders on TradingView. Let me know if you need help with additional publishing steps or want to tweak the description further!
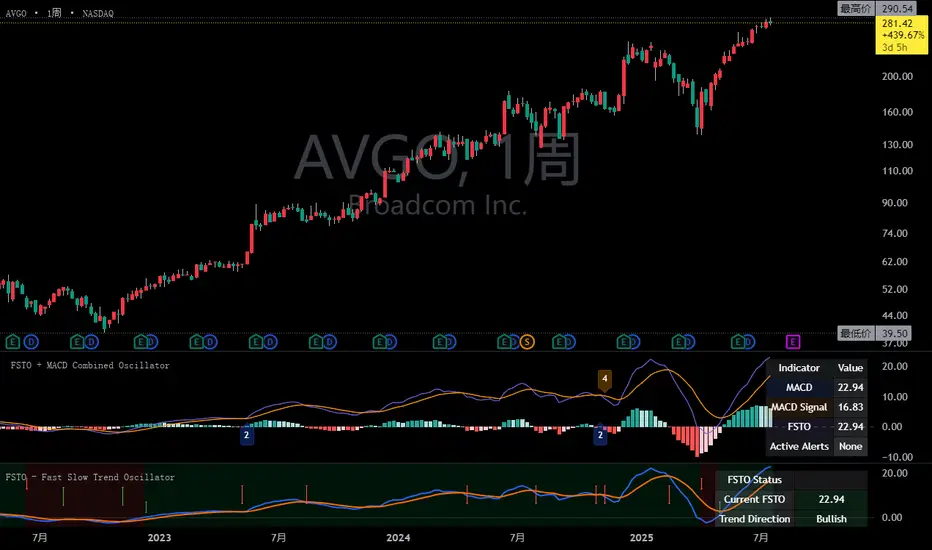
FSTO + MACD Combined OscillatorFSTO + MACD Combined Oscillator with Advanced Alerts
Introduction
The FSTO + MACD Combined Oscillator is a powerful technical analysis tool that synergizes two proven momentum indicators to deliver high-confidence trading signals. By combining the Moving Average Convergence Divergence (MACD) with the Fast Slow Trend Oscillator (FSTO), this indicator provides unique insights into market momentum, trend direction, and potential reversal points.
Key Features
1. Dual Indicator Integration
MACD Component:
Fast EMA (user-configurable period)
Slow EMA (user-configurable period)
Signal line with customizable smoothing
Histogram showing momentum strength
FSTO Component:
Short-term EMA (price-based)
Long-term EMA (price-based)
Signal line with adjustable period
Zero-line crossover detection
2. Advanced Alert System
Four specialized alert conditions that trigger only when both indicators confirm momentum shifts:
Bullish Reversal Alert
FSTO crosses above zero + MACD transitions from falling to rising
Strong trend reversal signal
Bullish Momentum Alert
FSTO crosses above signal line + MACD transitions from falling to rising
Confirmation of bullish momentum
Bearish Reversal Alert
FSTO crosses below zero + MACD transitions from rising to falling
Strong trend reversal signal
Bearish Momentum Alert
FSTO crosses below signal line + MACD transitions from rising to falling
Confirmation of bearish momentum
3. Visual Indicators
Color-coded plots:
MACD line (blue)
MACD signal line (orange)
FSTO line (purple)
FSTO signal line (amber)
Histogram:
Green: Strengthening bullish momentum
Light green: Weakening bullish momentum
Red: Strengthening bearish momentum
Light red: Weakening bearish momentum
Alert markers:
Numbered labels (1-4) at chart extremes
Color-coded for quick identification
4. Information Panel
Real-time display of:
Current MACD and FSTO values
Trend direction (bullish/bearish)
Momentum status (rising/falling)
Active alerts with color coding
How It Works
The indicator calculates two parallel momentum measurements:
MACD = EMA(close, fast_length) - EMA(close, slow_length)
FSTO = EMA(close, short_period) - EMA(close, long_period)
The true power emerges when these indicators confirm each other's signals:
MACD detects momentum shifts in price derivatives
FSTO identifies trend changes in price itself
Combined signals filter out false positives
Trading Applications
1. Trend Identification
Bullish Trend: FSTO > 0 and MACD > signal line
Bearish Trend: FSTO < 0 and MACD < signal line
2. High-Probability Entries
Long Entry: Alert 1 or 2 triggers
Short Entry: Alert 3 or 4 triggers
3. Exit Signals
MACD histogram color change (green to light green)
FSTO crossing signal line against trend direction
4. Risk Management
Stop placement below recent swing low (bullish)
Stop placement above recent swing high (bearish)
Position sizing based on histogram strength
Recommended Settings
Market MACD Fast MACD Slow FSTO Short FSTO Long
Stocks 12 26 12 26
Cryptocurrency 10 20 10 20
Forex 8 17 8 17
Commodities 14 28 14 28
Benefits
Synergistic Signals: Combines price-based and derivative-based momentum
Reduced False Signals: Requires confirmation from both indicators
Customizable Alerts: Enable/disable specific alert types
Visual Clarity: Color-coded elements for quick interpretation
Multi-Timeframe: Works on all timeframes from 1-minute to monthly
How to Use
Add indicator to TradingView chart
Configure periods based on market and timeframe
Enable desired alerts in settings
Set up notifications through TradingView alert system
Combine with price action analysis for best results
The MACD + FSTO Combined Oscillator provides professional traders with a sophisticated yet intuitive tool for identifying high-probability trade setups across all financial markets. Its unique alert system ensures you never miss critical momentum shifts confirmed by dual-indicator analysis.
TMAD Algo Supply DemandThis Pine Script identifies supply and demand zones using volume profile analysis between pivot points or a fixed look-back period. It dynamically highlights these zones with color-coded boxes based on whether price is currently above (bullish) or below (bearish) each zone.

Percentage Buy, Target, Stop + OverlayPercentage Buy, Target, Stop + Overlay
This tool helps traders plan entries and exits using fixed percentage offsets instead of volatility. It plots Buy, Target, and Stop levels on the chart based on a user‑defined entry price and simple percentage multipliers—giving a clear, objective framework for risk/reward.
NOTE: To activate the lines and table, enter a Buy Price greater than zero.
What It Does
Buy Price Input: Manually enter your intended entry price (e.g. planned or executed trade).
Percentage‑Based Target and Stop:
Target Price = Buy × (1 + Target % / 100)
Stop Price = Buy × (1 – Stop % / 100)
Visual Overlay: Draws horizontal lines at Buy, Target, and Stop levels on your chart.
Interactive Table: Displays Buy, Target, Stop and their percentages in a customizable on‑chart table.
Customization Options
Line Settings
Choose color, style (solid/dashed/dotted), and width for each line.
Extend lines to the right only or both directions.
Table Settings
Position table (top/bottom × left/right).
Toggle rows for Buy, Target, Stop, and percentage values.
Adjust text colors and background transparency.
How to Use It for Trading
Plan Your Trade: Enter your entry price.
Set Exits: Specify target and stop percentages to instantly see risk/reward zones.
Visual Reference: Lines update in real time as you adjust inputs—ideal for live monitoring or backtesting.
Straightforward Risk Management: Fixed percentages offer a simple alternative when ATR or volatility‑based levels aren’t preferred.
Ideal For
Traders who prefer fixed percentage targets/stops
Quick risk/reward visualization
Beginners seeking a clear, rule‑based exit framework
Any trader wanting an alternative to volatility‑based sizing

FSTO - Fast Slow Trend OscillatorFSTO Indicator: Fast Slow Trend Oscillator
Introduction
The FSTO (Fast Slow Trend Oscillator) is a powerful momentum indicator designed to identify trend direction, strength, and potential reversal points in financial markets. Based on the relationship between short-term and long-term exponential moving averages (EMAs), FSTO provides clear visual signals and actionable alerts to help traders make informed decisions.
Key Features
1. Dual-Line Visualization
FSTO Line: The difference between short-term and long-term EMAs
Signal Line: Smoothed version of the FSTO line for confirmation
2. Comprehensive Trend Analysis
Zero Line: Clearly marks the boundary between bullish and bearish territory
Color Zones:
Green area: Positive momentum (bullish)
Red area: Negative momentum (bearish)
3. Intelligent Alert System
Zero Line Cross Alerts: Signals when trend direction changes
Signal Line Cross Alerts: Identifies entry and exit points
Visual Markers: Triangle indicators highlight important cross events
4. Information Panel
Real-time display of:
Current FSTO value
Trend direction (Bullish/Bearish)
Momentum strength (Strengthening/Weakening)
How It Works
FSTO calculates the difference between two EMAs:
复制
FSTO Line = EMA(close, shortPeriod) - EMA(close, longPeriod)
Signal Line = EMA(FSTO, signalPeriod)
The indicator then:
Identifies when FSTO crosses above/below zero (trend change)
Detects when FSTO crosses above/below its signal line (entry/exit signals)
Visualizes momentum strength through color zones
Provides real-time alerts for key events
Recommended Settings
Market Short EMA Long EMA Signal Line
Stocks 12 26 9
Cryptocurrency 8 21 5
Forex 10 30 7
Commodities 14 28 8
Trading Signals
Bullish Trend: FSTO > 0
Bearish Trend: FSTO < 0
Buy Signal: FSTO crosses above signal line
Sell Signal: FSTO crosses below signal line
Strong Buy: Bullish cross below zero line
Strong Sell: Bearish cross above zero line
How to Use
Add the indicator to your TradingView chart
Configure EMA periods based on your trading style
Set up alerts for key events:
Zero line crosses (trend changes)
Signal line crosses (entry/exit points)
Combine with other indicators for confirmation
Use information panel for quick market assessment
Benefits
Clear visualization of trend direction
Early detection of momentum shifts
Customizable parameters for different markets
Actionable alerts for timely trading decisions
Comprehensive information panel for quick analysis
The FSTO indicator is an essential tool for traders seeking to identify trend direction, momentum strength, and potential reversal points across all timeframes and market conditions.

Volume Heatmap ProVolume Heatmap Pro - Statistical Volume Analysis Indicator
First and foremost, credit goes to xdecow. You can find the original indicator here:
I forked this indicator to make some changes that I wanted (mainly being able to color the volume bars and candlesticks independently).
Overview:
Volume Heatmap Pro is an advanced volume analysis tool that uses statistical analysis to identify significant volume anomalies in real-time. By calculating how many standard deviations the current volume is from its moving average (Z-score), it provides a visual heatmap that instantly highlights unusual volume activity.
Key Features:
📊 Statistical Volume Analysis
- Measures volume using Z-score calculations (standard deviations from mean)
- Dynamically adapts to each instrument's unique volume profile
- Identifies statistically significant volume spikes and drops
🎨 Visual Heatmap System
- Color-coded candlesticks and volume bars based on volume intensity
- Five threshold levels: Extra High (4σ), High (2.5σ), Medium (1σ), Normal (-0.5σ), and Low
- Multiple display modes: backgrounds, lines, or both
- Customizable colors for all threshold levels
⚙️ Flexible Configuration
- Adjustable moving average and standard deviation lengths (default: 610)
- Two color modes: Heatmap (volume-only) or Up/Down (volume + direction)
- Volume bar opacity control
🔔 Smart Alerts
- Set alerts for any threshold level
- Separate alerts for up/down volume bars
- Monitor unusual volume activity across multiple instruments
Use Cases:
- Identify institutional activity and large player participation
- Spot potential breakouts or reversals with volume confirmation
- Monitor volume climax and exhaustion patterns
- Analyze volume trends across different timeframes
- Validate price movements with statistical volume analysis
Perfect For:
Day traders, swing traders, VPA traders, and investors who want to add visual confirmation to their volume analysis and quickly identify when "smart money" is active in the market.

Student-t Weighted Acceleration & Velocity⚙️ Student-t Weighted Acceleration & Velocity
Author: © GabrielAmadeusLau
Category: Momentum, Smoothing, Divergence Detection
🔍 Overview
Student-t Weighted Acceleration & Velocity is a precision-engineered momentum indicator designed to analyze the rate of price change (velocity) and rate of change of velocity (acceleration). It leverages Student-t weighted smoothing, bandpass filtering, and divergence detection to reveal underlying momentum trends, shifts, and potential reversals with high sensitivity and low noise.
🧠 Key Features
🌀 1. Student-t Weighted Moving Average
Applies Student-t distribution weights to price data.
Controlled by:
ν (Degrees of Freedom): Lower ν increases weight on recent data, improving sensitivity to fast-moving markets.
Window Length: Sets the lookback period for weighted averaging.
🚀 2. Velocity & Acceleration Calculation
Velocity: Measures how fast price is moving over time.
Acceleration: Measures the change in velocity, revealing turning points.
Both are calculated via:
Butterworth High-pass Filter
Super Smoother Low-pass Filter
Fast Root Mean Square (RMS) normalization
Optionally smoothed using a Super Smoother EMA.
🎯 3. Signal Conditions
Strong Up: When smoothed velocity crosses above the overbought threshold and acceleration is positive.
Strong Down: When smoothed velocity crosses below the oversold threshold and acceleration is negative.
Visual cues:
Green & red triangle shapes for signals.
Colored histogram & column plots.
Optional bar coloring based on A/V behavior.
🔎 4. Divergence Detection Engine
Built-in multi-timeframe divergence system with:
Bullish/Bearish Regular Divergence
Bullish/Bearish Hidden Divergence
Customizable settings:
Pivot detection, confirmation logic, lookback limits.
Heikin Ashi mode for smoothed divergence detection.
Configurable line style, width, and color.
Visual plots of divergence lines on price chart.
⚙️ Custom Inputs
A/V Calculation Parameters:
Lookback period, filter lengths (Butterworth, Super Smoother, RMS), EMA smoothing.
Divergence Settings:
Enable/disable confirmation, show last divergence only.
Adjustable pivot period and max lookback bars.
Heikin Ashi Mode:
Option to use Heikin Ashi candles for divergence detection only (without switching chart type).
Thresholds:
Overbought/Oversold Sigma levels for strong signal detection.
🔔 Alerts Included
Strong Up Alert: Momentum and acceleration aligned bullishly.
Strong Down Alert: Momentum and acceleration aligned bearishly.
All Divergence Types:
Bullish/Bearish Regular Divergence
Bullish/Bearish Hidden Divergence
Aggregated Divergence Alerts
📌 Use Cases
Spot momentum bursts and reversals with confirmation from both velocity and acceleration.
Identify divergence-based signals for early entries/exits.
Apply across multiple timeframes or pair with other trend filters.

OHLC_DayLibrary "OHLC_Day"
TODO: add library description here
openD(x)
Parameters:
x (int)
highD(x)
Parameters:
x (int)
lowD(x)
Parameters:
x (int)
closeD(x)
Parameters:
x (int)
