CPR by myBiniyog“CPR by myBiniyog” plots Central Pivot Range (CPR) and Daily Pivot Points (R1, R2, S1, S2) using clean and intuitive circle markers on price charts. Ideal for intraday traders who rely on key support and resistance zones.
🔹 **CPR Levels**:
- TC (Top Central)
- Pivot
- BC (Bottom Central)
🔹 **Daily Pivot Points**:
- R1 & R2 (Resistance Zones)
- S1 & S2 (Support Zones)
The CPR is based on previous day's OHLC data and can help traders predict:
- Narrow CPR = potential breakout day
- Wide CPR = potential sideways movement
The indicator auto-plots these levels as circles on intraday timeframes (like 5-min or 15-min charts). It's designed to be visually clean and fast to read.
Built in Pine Script v5. Open-source. Free for educational use.
Best suited for Nifty, Bank Nifty, stocks, crypto and forex traders who prefer CPR-based systems.
Made by: myBiniyog
Indicators and strategies

ICT All in One by GtraderICT All-in-One by GTrader – Description
This indicator is designed for traders who follow ICT or Smart Money Concepts. It helps you visualize key market sessions, time-based price levels, and structured macro behaviors in one clean and customizable tool.
The Killzone feature automatically draws session boxes for Asia, London, and New York (including AM, Lunch, and PM sessions). Each box can show the session name, high and low pivots, and can be customized with different colors, transparency levels, and labels.
You can also add horizontal lines at important times like the daily open or New York open. Up to five session open lines can be defined, each with customizable styles, colors, and optional text labels.
In addition, the indicator lets you display vertical time markers. These lines help you track key intraday moments such as killzone entries or important session changes. You can enable up to four of these, each with its own settings.
One of the most powerful features is the macro session tracker. This creates boxes during specific time windows where price action is monitored. It automatically draws the top and bottom price levels during that session and updates them live. It supports up to five macros and works best on lower timeframes like 1-minute, 3-minute, and 5-minute charts.
The entire script respects your selected timezone, so all sessions and times are adjusted accordingly. Everything is customizable—from label sizes and colors to how many days of drawings are shown on your chart.
This script is ideal for traders who rely on time-of-day behavior, structured price action, and ICT methodologies.

Custom Multiple SMAsThe Custom Breakout Indicator provides visual guidance for identifying entry and exit signals within the BreakoutCatcher strategy. It consists of a fan of multiple Simple Moving Averages (SMAs) that make current market conditions visually accessible:
Flat, tightly clustered fan → Market is consolidating
First candle closing outside the fan → Potential entry signal (breakout)
Wide, rapidly expanding fan → Market is overheated, avoid entries
Additionally, the indicator displays a yellow trendline (EMA 100) as an overarching trend filter:
Price above EMA 100 → Consider only long signals
Price below EMA 100 → Consider only short signals
🔗 Part of the BreakoutCatcher strategy – available at: www.twn-trading.com
✔️ Fully functional on all timeframes

Trend+Volume Divergence + Order Block Detector
The best in TF 5M
The script combines an order block detector (inspired by LuxAlgo) with a trend and volume divergence entry system.
The first part identifies both bullish and bearish order blocks based on volume pivots. These are typically zones where price has shown a high probability of reversal or strong reaction.
The order block algorithm uses recent volume pivots to detect likely institutional trading zones, marking them with colored boxes (green for bullish, red for bearish).
Bullish order blocks form when the price shows a volume-based pivot to the downside, suggesting possible accumulation at support.
Bearish order blocks appear at volume pivots to the upside, indicating likely distribution or resistance.
The script removes (“mitigates”) these order blocks when price action confirms that the zone is no longer respected.
Average (midpoint) order block levels are drawn as dashed or dotted lines based on your settings for visualization.
Whenever a new order block forms or is mitigated, alert conditions can be triggered.
The trend entry system computes and plots an Exponential Moving Average (EMA, default length 21) on the chart for basic trend detection.
A trend shift is detected when price crosses the EMA (from below is bullish, from above is bearish).
Additional confirmation for trade entries is provided by simple volume divergence logic:
Bullish if price is down but current volume exceeds prior volume.
Bearish if price is up but current volume is lower than the previous bar.
Large BUY (aqua up-triangle) and SELL (fuchsia down-triangle) arrows mark optimal entry points where both trend change and volume divergence are detected together.
Smaller triangles (‘Buy?’ or ‘Sell?’) are plotted where only a trend crossover is detected without supporting volume divergence.
The background color of the chart changes according to trend direction: green when price is above the EMA, red when below.
All major signals (order blocks and entry conditions) can generate alerts for automated or manual trade notifications.
The script is fully configurable via input parameters for block length, visualization style, EMA length, and mitigation settings.
The logic is suitable for scalping and short-term trading, especially on assets like gold (XAUUSD), but can be applied to any instrument or timeframe.
The script relies solely on built-in Pine functions and does not require external libraries or premium data.
The marked order blocks visually help traders identify zones with high probability of rejection or breakout.
By combining institutional-level order flows (via order block logic) with individual supply-demand signals (trend and volume divergence), the script aims to give robust entry ideas with clear visual cues on the chart.

Optimal Trend Change & Volume Divergence Entries
This TradingView Pine Script combines two technical analysis elements: trend change detection via EMA and volume divergence. The core of the script is the Exponential Moving Average (EMA) with a length of 21, which is plotted on the price chart. When the closing price crosses above the EMA21, a possible bullish trend change is identified. Conversely, when the closing price crosses below the EMA21, a bearish trend change is signaled. To avoid false entries, the script introduces a candlestick confirmation, requiring a green candle for bullish signals and a red one for bearish signals.
Volume divergence is integrated to provide additional context to the trend change. Bullish volume divergence occurs when the price registers a lower close than the previous bar, but the volume increases, suggesting waning selling pressure and a potential reversal. Bearish volume divergence is recognized when the price closes higher than the previous bar, but the volume declines, indicating possible exhaustion of buying strength. Only when both a trend change and the appropriate volume divergence signal occur on the same candle is a main entry generated.
The script visualizes these optimal buy entries with a large aqua upward arrow and optimal sell entries with a large fuchsia downward arrow. These arrows make it easy for traders to spot high-probability setups on the chart. When only a trend change is detected without volume divergence, the script plots smaller green or red arrows as additional context but marks them as less optimal entries.
The background color of the chart subtly changes to green for trending up and red for trending down, which helps the user quickly assess the prevailing market bias. Alerts can be set for the optimal entries, so traders do not need to monitor the chart constantly. The volume divergence logic in this version is kept classic and straightforward for reliability and speed. This approach looks for immediate (bar-to-bar) divergences instead of more complex, multi-bar patterns.
By requiring both a trend change and volume divergence, the script aims to reduce false signals and highlight stronger opportunities. The EMA21 offers a dynamic support/resistance level, enhancing decision-making for both scalpers and short-term traders. Volume divergence confirms whether a trend change is likely genuine or just a pullback.
Even in ranging conditions, the extra confirmation of volume trends helps filter out mediocre trades. With easily customizable inputs such as EMA length, traders can adapt the script to different instruments and timeframes. Placing visual markers and background changes directly on the price chart aids fast, intuitive trading decisions.
The script is lightweight and runs smoothly on most TradingView accounts. The customizable alerts give traders flexibility in their strategy execution. Advanced users can extend the script with more complex divergence conditions if needed. Overall, this script helps traders to identify and act on high-probability trend reversal setups, especially valuable for gold (XAUUSD) scalping.

Gold SCALP XAUUSD (SMA200/PSAR/ADX/ATR/Arrows)
This script is a custom scalping indicator designed for XAUUSD (gold) trading, suitable for low timeframes such as 1-minute or 5-minute charts.
It combines several proven technical analysis tools: the 200-period Simple Moving Average (SMA), Parabolic SAR (PSAR), Average Directional Index (ADX), and Average True Range (ATR).
The script first calculates the 200-period SMA to determine the overall market trend – above the SMA is bullish, below is bearish.
The PSAR indicator is included to pinpoint short-term reversal points and precise breakout moments.
ADX is calculated manually within the script to measure the strength of the prevailing trend; only strong trends trigger signals.
ATR is used to dynamically set take-profit and stop-loss levels, adapting to current volatility.
A buy signal is generated when the close price crosses above the PSAR, price is above the 200 SMA (bullish environment), and ADX indicates a strong trend above the threshold.
A sell signal appears when the close crosses below the PSAR, price is below SMA 200, and ADX confirms a strong bearish trend.
Arrows are plotted on the chart for every valid buy or sell signal, making trade entries visually clear.
Take-profit and stop-loss levels are plotted as crosses above or below the entry, calculated as multiples of ATR.
The background color subtly changes to green or red, indicating whether the market is bullish or bearish per trend filter.
Users can quickly evaluate trend conditions and momentum at a glance using these color cues.
Parameters for SMA, PSAR, ADX, ATR, and profit/stop levels can be manually adjusted to fit the user’s risk and trading style.
ADX and DI (Directional Indicators) are calculated from price action, not with a built-in, and the code follows the standard ADX mathematical formula.
Signals appear only when the trend is strong, avoiding sideways or choppy movements and helping filter out false positives.
The script does not open or close trades automatically; it is strictly an informational and visual trading tool.
All the plots, shapes, and backgrounds are intended to increase clarity and make decision-making quick during scalping.
The code is written in Pine Script v5, fully compatible with TradingView charts.
It is especially useful for traders looking to capture quick moves but needing strict technical filtering for their scalping approach.
Combining dynamic and static volatility, directional, and trend-following tools helps maximize probability and reduce whipsaw trades.
The modular design enables further customization, such as adding more timeframes or integrating with alerts, based on user preference.

Multi-Timeframe EMA50 Overlaythis is EMA50 WD41, means EMA50 weekly, daily, 4h, 1h in one time frame.
So you don't need to check EMA50 every time frame.
When EMA50 daily under EMA50 4h, and 1h i can say it's bullish trend, especially when you see weekly EMA50 under all EMA50.
it's work for bearish trend also, when EMA50 daily above EMA50 4h, and 1h i can say the trend is bearish, espesially when you see weekly EMA50 is above every EMA50.
this indicator help you to understand market is in bullish or bearish trend! happy trading!

Angled Gann Time-Price Squares with S/RThis is a Pine Script indicator that implements Angled Gann Time-Price Squares based on W.D. Gann's trading theory. Here's what it does:
Core Functionality
Detects pivot highs and lows using a configurable lookback period
Creates angled squares by connecting pivot points to current price action when specific geometric conditions are met
Validates square formation by checking if the price movement follows proper Gann angles (typically 45°, 135°, etc.) within a tolerance range
Key Features
Real-time square tracking: Shows both completed squares and forming squares in progress
Support/Resistance levels: Automatically generates S/R lines from:
Square edge extensions
Diagonal extensions (pivot centers)
Quarter/half levels within squares (25%, 50%, 75%)
Visual feedback: Color-coded squares (green for up, red for down, orange for forming)
Projection lines: Predicts where squares might complete based on Gann angle theory
Gann Theory Application
The indicator follows Gann's principle that time and price move in geometric harmony. It looks for price movements that form perfect squares when plotted on a chart, where the diagonal of the square represents the natural flow of price and time at specific angles.
The generated support/resistance levels are particularly valuable because they're based on completed geometric patterns rather than just horizontal price levels, making them potentially more significant according to Gann methodology.


Variance and Moving Averages StrategyThe Variance and Moving Averages Strategy is a long-only trend-following system that combines volatility filtering with classic moving-average signals. It computes 5-, 15-, and 30-period simple moving averages (MA5, MA15, MA30) to identify a clear uptrend (MA5 > MA15 > MA30) and only enters when recent price variance (measured over the past 30 bars as the variance of (high–low)/close) is very low—avoiding choppy or noisy conditions. Once in a position, it employs a dual exit: a trend-based stop-loss (closing when MA5 falls below MA30) and a volatility-based take-profit (exiting when variance spikes above a high threshold), thus “buying low-volatility breakouts” and “selling on trend reversal or volatility expansion.”


RSI(14) Custom by ChadRSI 14 : this indicator works in low time frame like 1h and 4h, for entry long position and short position. when the line touch 70 mean the price is overbought, when the line touch 50 it"s neutral, and when the line touch 30 mean price is oversold.

5-Indicator Swing StrategyCustom 5-Indicator Swing Strategy for 4H Chart
---
Key Features:
1. Price Uptrend Detection
Uses 50-period EMA as trend filter
Only takes long positions when price is above EMA
2. RSI Momentum Confirmation
RSI must be above 40 and rising (3-bar confirmation)
Includes overbought exit at RSI > 70
3. MACD Bullish Crossover
Detects when MACD line crosses above signal line
Uses standard 12/26/9 settings (customizable)
4. Volume Spike Detection
Identifies volume spikes 1.5x above 20-period average
Confirms breakout strength
5. Fibonacci Retracement Levels
Calculates dynamic Fibonacci levels from recent swing high/low
Enters when price is near 38.2% to 61.8% support levels
Additional Features:
Risk Management: Stop Loss: 2 x ATR below entry price / Take Profit: 3 x ATR above entry price
ATR Length: 14 periods
Visual Indicators: Clear entry/exit signals with shapes
Information Table: Real-time status of all 5 conditions
Multi-Panel Display: RSI, MACD, and Volume in separate panels
Customizable Parameters: All inputs can be adjusted
Alert System: Built-in alerts for entry and exit signals

2Saucy custom MA'sEMA's 9/21/50/200 - Designated for "scalping" 1m/3m/5m/15/1h/4h. Works best as it EMA's move faster with price.
SMA's 10/20/50/200 - Works more for swing trading and/or finding setups on weekly and daily time frames.
By combining these two simultaneously trading intra-day is made much simpler.
Yours truly,
#2Saucy

Ehlers Two-Pole StochasticThis indicator implements John Ehlers' Two-Pole Stochastic Filter, a smoother alternative to the traditional stochastic oscillator. Instead of relying on raw %K values, it applies a second-order IIR filter (recursive smoothing) to reduce noise and improve trend clarity.
It outputs a single line oscillating between 0 and 1, with less lag and false signals compared to standard stochastic implementations.
Key Features:
Uses a two-pole filter to smooth the normalized stochastic (%K).
Ideal for detecting clean reversals and trend continuations.
Designed for minimal visual noise and greater signal confidence.
Interpretation:
Values near 1.0 may suggest overbought conditions.
Values near 0.0 may suggest oversold conditions.
Crosses above 0.5 can signal bullish shifts, and below 0.5 bearish shifts.
Recommended Settings:
Default smoothing factor (alpha) is 0.7 — higher values make the output more responsive, while lower values smooth further.
Inspired by concepts from Cybernetic Analysis for Stocks and Futures by John F. Ehlers.
Dynamic SL/TP Levels (ATR or Fixed %)This indicator, "Dynamic SL/TP Levels (ATR or Fixed %)", is designed to help traders visualize potential stop loss (SL) and take profit (TP) levels for both long and short positions, refreshing dynamically on each new bar. It assumes entry at the current bar's close price and uses a fixed 1:2 risk-reward ratio (TP is twice the distance of SL in the profit direction). Levels are displayed in a compact table in the chart pane for easy reference, without cluttering the main chart with lines.
Key Features:
Calculation Modes:
ATR-Based (Dynamic): SL distance is derived from the Average True Range (ATR) multiplied by a user-defined factor (default 1.5x). This adapts to the asset's volatility, providing breathing room based on recent price movements.
Fixed Percentage: SL is set as a direct percentage of the current close price (default 0.5%), offering consistent gaps regardless of volatility.
Long and Short Support: Calculates and shows SL/TP for longs (SL below close, TP above) and shorts (SL above close, TP below), with toggles to hide/show each.
Real-Time Updates: Levels recalculate every bar, making them readily available for entry decisions in your trading system.
Display: Outputs to a table in the top-right pane, showing precise values formatted to the asset's tick size (e.g., full decimal places for crypto).
How to Use:
Add the indicator to your chart via TradingView's Pine Editor or library.
Adjust settings:
Toggle "Use ATR?" on/off to switch modes.
Set "ATR Length" (default 14) and "ATR Multiplier for SL" for dynamic mode.
Set "Fixed SL %" for percentage mode.
Enable/disable "Show Long Levels" or "Show Short Levels" as needed.
Interpret the table: Use the displayed SL/TP values when your strategy signals an entry. For risk management, combine with position sizing (e.g., risk 1% of account per trade based on SL distance).
Example: On a volatile asset like BTC, ATR mode might set a wider SL for realism; on stable pairs, fixed % ensures predictability.
This tool promotes disciplined trading by tying levels to price action or fixed rules, but it's not financial advice—always backtest and use with your full strategy. Feedback welcome!

Nadaraya,poly100,MA ribbon,volume nến,RSInadaraya
polynomial 100
volume nến
rsi break out 75,25
MA Ribbon

Alt Szn Oracle - Institutional GradeThe Alt Szn Oracle is a macro-level indicator built to help traders front-run altseason by tracking liquidity, dominance rotation, sentiment, and capital flows—all in one signal. It’s designed for those who don’t just chase pumps, but want to understand when the tide is turning and why. This tool doesn't predict specific coin breakouts—it tells you when the market as a whole is gearing up to rotate into higher beta assets like altcoins, including memes and microcaps.
The index consolidates ten macro inputs into a normalized, smoothed score from 0–100. These include Bitcoin and Ethereum dominance, ETH/BTC, altcoin market cap (Total3), relative volume flows, and stablecoin supply (USDT, USDC, DAI)—which act as proxies for risk-on appetite and dry powder entering the system. It also incorporates manually updated sentiment metrics from Google Trends and the Fear & Greed Index, giving it a behavioral edge that most indicators lack.
The logic is simple but powerful: when BTC dominance is falling, ETH/BTC is rising, altcoin volume increases relative to BTC/ETH, and stablecoins start moving—you're likely in the early innings of rotation. The index is also filtered through a volatility threshold and smoothed with an EMA to eliminate chop and fakeouts.
Use this indicator on macro charts like TOTAL3, TOTAL2, or ETHBTC to gauge market health, or overlay it on specific coins like PEPE, DOGE, or SOL to confirm if the tide is in your favor. Interpreting the score is straightforward: readings above 80 suggest euphoria and signal it’s time to de-risk, 60–80 indicates expansion and confirms altseason is underway, 40–60 is neutral, and 20–40 is a capitulation zone where smart money accumulates.
What sets this apart is that it doesn’t just track price—it reflects the flow of capital, the positioning of liquidity, and the sentiment of the crowd. Most altseason indicators are lagging, overfitted, or too simplistic. This one is modular, forward-looking, and grounded in real capital rotation theory.
If you're a trader who wants to time the cycle, not guess it, this is your tool. Refine it, fork it, or expand it to your niche—DeFi, NFTs, meme coins, or L1s. It’s a framework for reading the macro winds, not a signal service. Use it with discipline, and you’ll catch the wave while others drown in noise.

EMA Reclaim Alert - FVG StrategyThis script identifies momentum-based trend reclaims using two Exponential Moving Averages (EMAs), and plots entry, stop-loss, and take-profit levels for trade signals. It also highlights potential fakeouts.

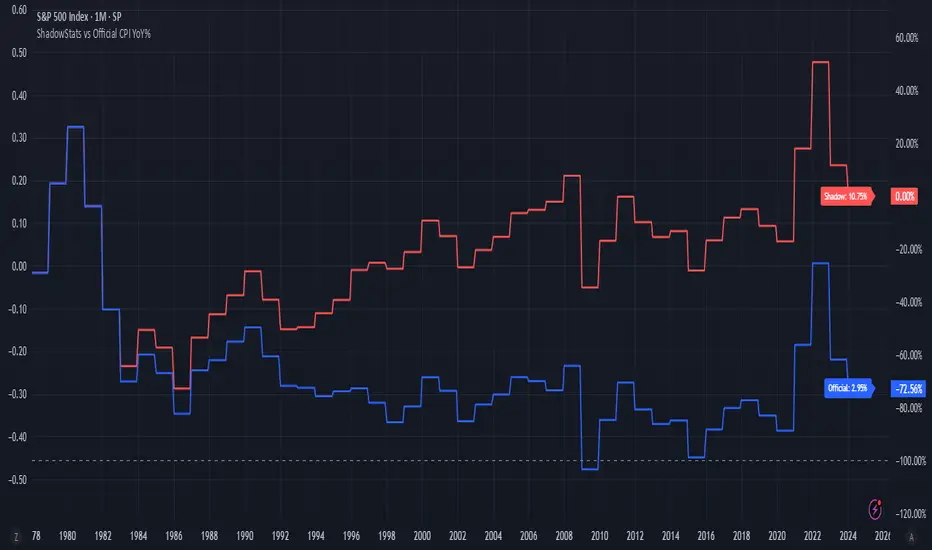
ShadowStats vs Official CPI YoY%This chart visualizes and compares the year-over-year (YoY) percentage change in the Consumer Price Index (CPI) as calculated by the U.S. government versus the alternative methodology used by ShadowStats, which reflects pre-1980 inflation measurement techniques. The red line represents ShadowStats' CPI YoY% estimates, while the blue line shows the official CPI YoY% reported by government sources. This side-by-side view highlights the divergence in reported inflation rates over time, particularly from the 1980s onward, offering a visual representation of how different calculation methods can lead to vastly different interpretations of inflation and purchasing power loss.
Dual MACD + TSI [CryptoSmart] by IgnotusA sophisticated dual momentum indicator combining a custom MACD Histogram with Divergence Detection and a TSI (True Strength Index) oscillator, designed for advanced technical analysis in crypto and other fast-moving markets.
---
🔍 Key Features:
- Custom MACD Histogram (MACD 1):
- Configurable fast/slow lengths and signal smoothing method (EMA/SMA).
- Advanced divergence detection (Regular & Hidden Bullish/Bearish patterns).
- Visual alerts and labels directly on the chart.
- Built-in divergence alerts for easy integration with TradingView alerts.
- TSI Oscillator (MACD 2):
- True Strength Index with customizable fast/slow periods and signal line smoothing.
- Overbought/oversold levels and optional background shading for quick visual cues.
- Fully optional elements (TSI Line, Signal Line, OB/OS levels) – disabled by default for clean charting.
- User-Friendly Design:
- Optional components can be toggled on/off via the settings panel.
- Works great as a standalone momentum filter or as part of a multi-indicator dashboard.
---
📈 How to Use:
- Use the MACD Histogram divergences to spot potential reversals.
- Combine with the TSI oscillator to confirm trend strength or detect overextended moves.
- Enable/disable components to avoid clutter and focus on what matters most.
---
Crafted for traders who want precision, flexibility, and visual clarity in their charts. Whether you're scalping or swing trading, this indicator helps you stay ahead of the curve.
---
Feel free to tweak the values and customize it to your strategy. Happy trading!

GOLD Auto-Alert Strategy [Enhanced+Signals]1M scalping Indicator , Always take trade above adx 25 and take trades after signal only after the crossing lies. use RSI for over bought and over sold confirmation

Volumatic + Adaptive Trend Flow [Fusion] by Ignotus📌 Description
```
This script combines two public open source indicators available on TradingView:
1. Volumatic Variable Index Dynamic Average
© BigBeluga
License: Creative Commons Attribution-NonCommercial-ShareAlike 4.0 International https:creativecommons.org/licenses/by-nc-sa/4.0/
Original link:
2. Adaptive Trend Flow
© QuantAlgo
License: Mozilla Public License 2.0 (MPL-2.0)
https:mozilla.org/MPL/2.0/
Original link:
This indicator merges both scripts without modifying their internal logic, maintaining all their functionality, settings, and alerts.
This work is a custom compilation for educational and analytical purposes, complying with the attribution and redistribution terms of both licenses.
I do not claim to be the author of the original code for either indicator.
⚠️ Note on the CC BY-NC-SA license:
The license for the first indicator prohibits commercial use without explicit permission.
Therefore, this script should not be used for commercial purposes without the authorization of the original creator (BigBeluga).
```
---
✅ What does this indicator include?
This indicator combines two powerful tools in a single script:
🔹 Volumatic Variable Index Dynamic Average
- Volume and trend-based indicator.
- Detects liquidity zones and dynamic support/resistance.
- Uses VIDYA (Variable Index Dynamic Average) along with ATR to identify trend changes.
- Includes visual volume signals, dynamic support/resistance lines, and smart labels.
🔹 Adaptive Trend Flow
- Adaptive indicator for market volatility.
- Identifies bullish and bearish trends using calculations based on EMAs and standard deviation.
- Includes candle color, dynamic background, entry/exit signals, and built-in alerts.
---
🛡️ Responsible Use
- This indicator is NOT designed for automatic trading and does not guarantee profits.
- It is recommended to use it as a technical analysis tool, always under your own supervision and discretion.
- Do not use this script for commercial purposes or on external platforms without the explicit consent of the original authors.
---
📣 Credits
- Creator of the combined indicator: Ignotus
- Original source of the indicators: TradingView
- Final result license: MPL-2.0 (except where otherwise indicated by copyright of the original author)
