Trading CalculatorTrading Calculator Indicator
VIBE CODED WITH GROK 3
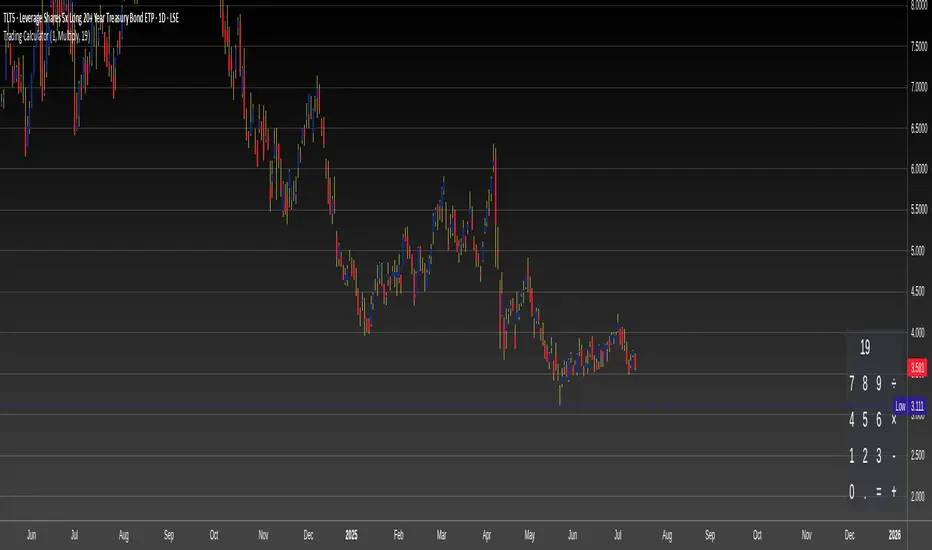
The Trading Calculator is a Pine Script indicator designed to perform quick and useful trading-related calculations directly on your chart. It allows traders to execute basic arithmetic operations—such as addition, subtraction, multiplication, and division—as well as calculate percent change and average using either numerical values or trading variables (e.g., close, open, high, low, volume). The indicator displays its results in a table that resembles a calculator interface, making it both functional and visually intuitive. Unlike typical indicators, it does not overlay on the price chart but instead appears in a separate pane.
Inputs
Formula (new | old): First value or variable (e.g., 100, close, close ). Example: close uses the current closing price.
Operator: Mathematical operation (e.g., Plus, Minus, Multiply). Example: Plus adds the two inputs.
Second Input: Second value or variable (e.g., 50, open, close ). Example: open uses the current opening price.
Indicators and strategies
Golden Ratio Trend Persistence [EWT]Golden Ratio Trend Persistence
~~~~~~~~~~~~~~~~~~~~~~~~~~~~~~~~~~~~~~~~~~~~
Overview
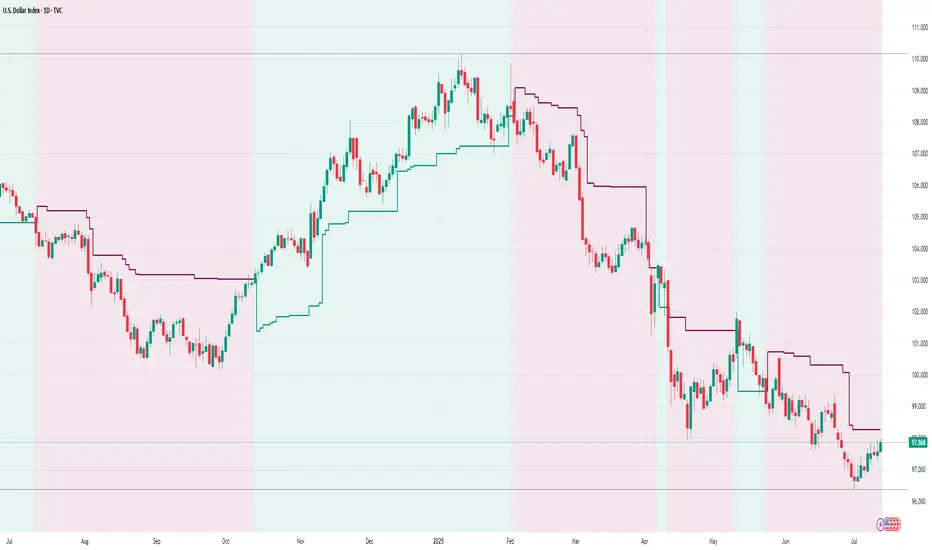
The Golden Ratio Trend Persistence is a dynamic tool designed to identify the strength and persistence of market trends. It operates on a simple yet powerful premise: a trend is likely to continue as long as it doesn't retrace beyond the key Fibonacci golden ratio of 61.8%.
This indicator automatically identifies the most significant swing high or low and plots a single, dynamic line representing the 61.8% retracement level of the current move. This line acts as a "line in the sand" for the prevailing trend. The background color also changes to provide an immediate visual cue of the current market direction.
~~~~~~~~~~~~~~~~~~~~~~~~~~~~~~~~~~~~~~~~~~~~
The Power of the Golden Ratio (61.8%)
The golden ratio (ϕ≈1.618) and its inverse (0.618, or 61.8%) are fundamental mathematical constants that appear throughout nature, art, and science, often representing harmony and structure. In financial markets, this ratio is a cornerstone of Fibonacci analysis and is considered one of the most critical levels for price retracements.
Market movements are not linear; they progress in waves of impulse and correction. The 61.8% level often acts as the ultimate point of support or resistance. A trend that can hold this level demonstrates underlying strength and is likely to persist. A breach of this level, however, suggests a fundamental shift in market sentiment and a potential reversal.
~~~~~~~~~~~~~~~~~~~~~~~~~~~~~~~~~~~~~~~~~~~~
How to Use This Indicator
This indicator is designed for clarity and ease of use.
Identifying the Trend : The visual cues make the current trend instantly recognizable.
A teal line with a teal background signifies a bullish trend. The line acts as dynamic support.
A maroon line with a maroon background signifies a bearish trend. The line acts as dynamic resistance.
Confirming Trend Persistence : As long as the price respects the plotted level, the trend is considered intact.
In an uptrend, prices should remain above the teal line. The indicator will automatically adjust its anchor to new, higher lows, causing the support line to trail the price.
In a downtrend, prices should remain below the maroon line.
Spotting Trend Reversals : The primary signal is a trend reversal, which occurs when the price closes decisively beyond the plotted level.
Potential Sell Signal : When the price closes below the teal support line, it indicates that buying pressure has failed, and the uptrend is likely over.
Potential Buy Signal : When the price closes above the maroon resistance line, it indicates that selling pressure has subsided, and a new uptrend may be starting.
Think of this tool as an intelligent, adaptive trailing stop that is based on market structure and the time-tested principles of Fibonacci analysis.
~~~~~~~~~~~~~~~~~~~~~~~~~~~~~~~~~~~~~~~~~~~~
Input Parameters
You can customize the indicator's sensitivity through the following inputs in the settings menu:
Pivot Lookback Left : This number defines how many bars to the left of a candle must be lower (for a pivot high) or higher (for a pivot low) to identify a potential swing point. A higher value will result in fewer, but more significant, pivots being detected.
Pivot Lookback Right : This defines the number of bars that must close to the right before a swing point is confirmed. This parameter prevents the indicator from repainting. A higher value increases confirmation strength but also adds a slight lag.
Fibonacci Ratio : While the default is the golden ratio (0.618), you can adjust this to other key Fibonacci levels, such as 0.5 (50%) or 0.382 (38.2%), to test for different levels of trend persistence.
Adjusting these parameters allows you to fine-tune the indicator for different assets, timeframes, and trading styles, from short-term scalping to long-term trend following.
Kanal MA 5 GarisTentu! Berikut ini adalah **deskripsi indikator dalam bahasa Inggris** yang bisa langsung kamu pakai untuk dipublikasikan di TradingView:
---
### 📌 **Indicator Title (Name):**
**Engulfing + RSI OB/OS Filter (1-Bar Confirmation)**
---
### 📝 **Description for TradingView:**
This custom indicator combines classic **Engulfing Candlestick Patterns** with **RSI-based overbought/oversold filters** for smarter signal confirmation.
### 🔍 Key Features:
✅ Detects 4 engulfing types:
* **BE1 (Bullish Engulfing 1):** Current close > previous high
* **BE2 (Bullish Engulfing 2):** Current high > previous high AND current close > previous open
* **SE1 (Bearish Engulfing 1):** Current close < previous low
* **SE2 (Bearish Engulfing 2):** Current low < previous low AND current close < previous open
✅ Detects RSI Overbought (OB) and Oversold (OS) conditions:
* **OB** (Overbought): RSI > 70
* **OS** (Oversold): RSI < 30
✅ **Smart confirmation rule:**
* **BE1/BE2** signals only appear **if the previous candle was OS (RSI < 30)**
* **SE1/SE2** signals only appear **if the previous candle was OB (RSI > 70)**
### 🎯 Usage:
This indicator helps traders avoid false engulfing signals by confirming momentum exhaustion using RSI. It is ideal for identifying **potential reversals** from overbought or oversold zones.
You can customize the RSI period and OB/OS threshold from the settings.
---
Let me know if you’d like a shorter version or want me to add strategy tips for the description!


Volume MA Crossover SignalsDisplay the 10-day Simple Moving Average volume in red .
Display the 20-day Simple Moving Average volume in orange.

Risk Distribution HistogramStatistical risk visualization and analysis tool for any ticker 📊
The Risk Distribution Histogram visualizes the statistical distribution of different risk metrics for any financial instrument. It converts risk data into histograms with quartile-based color coding, so that traders can understand their risk, tail-risks, exposure patterns and make data-driven decisions based on empirical evidence rather than assumptions.
The indicator supports multiple risk calculation methods, each designed for different aspects of market analysis, from general volatility assessment to tail risk analysis.
Risk Measurement Methods
Standard Deviation
Captures raw daily price volatility by measuring the dispersion of price movements. Ideal for understanding overall market conditions and timing volatility-based strategies.
Use case: Options trading and volatility analysis.
Average True Range (ATR)
Measures true range as a percentage of price, accounting for gaps and limit moves. Valuable for position sizing across different price levels.
Use case: Position sizing and stop-loss placement.
The chart above illustrates how ATR statistical distribution can be used by looking at the ATR % of price distribution. For example, 90% of the movements are below 5%.
Downside Deviation
Only considers negative price movements, making it ideal for checking downside risk and capital protection rather than capturing upside volatility.
Use case: Downside protection strategies and stop losses.
Drawdown Analysis
Tracks peak-to-trough declines, providing insight into maximum loss potential during different market conditions.
Use case: Risk management and capital preservation.
The chart above illustrates tale risk for the asset (TQQQ), showing that it is possible to have drawdowns higher than 20%.
Entropy-Based Risk (EVaR)
Uses information theory to quantify market uncertainty. Higher entropy values indicate more unpredictable price action, valuable for detecting regime changes.
Use case: Advanced risk modeling and tail-risk.
VIX Histogram
Incorporates the market's fear index directly into analysis, showing how current volatility expectations compare to historical patterns. The CAPITALCOM:VIX histogram is independent from the ticker on the chart.
Use case: Volatility trading and market timing.
Visual Features
The histogram uses quartile-based color coding that immediately shows where current risk levels stand relative to historical patterns:
Green (Q1): Low Risk (0-25th percentile)
Yellow (Q2): Medium-Low Risk (25-50th percentile)
Orange (Q3): Medium-High Risk (50-75th percentile)
Red (Q4): High Risk (75-100th percentile)
The data table provides detailed statistics, including:
Count Distribution: Historical observations in each bin
PMF: Percentage probability for each risk level
CDF: Cumulative probability up to each level
Current Risk Marker: Shows your current position in the distribution
Trading Applications
When current risk falls into upper quartiles (Q3 or Q4), it signals conditions are riskier than 50-75% of historical observations. This guides position sizing and portfolio adjustments.
Key applications:
Position sizing based on empirical risk distributions
Monitoring risk regime changes over time
Comparing risk patterns across timeframes
Risk distribution analysis improves trade timing by identifying when market conditions favor specific strategies.
Enter positions during low-risk periods (Q1)
Reduce exposure in high-risk periods (Q4)
Use percentile rankings for dynamic stop-loss placement
Time volatility strategies using distribution patterns
Detect regime shifts through distribution changes
Compare current conditions to historical benchmarks
Identify outlier events in tail regions
Validate quantitative models with empirical data
Configuration Options
Data Collection
Lookback Period: Control amount of historical data analyzed
Date Range Filtering: Focus on specific market periods
Sample Size Validation: Automatic reliability warnings
Histogram Customization
Bin Count: 10-50 bins for different detail levels
Auto/Manual Bin Width: Optimize for your data range
Visual Preferences: Custom colors and font sizes
Implementation Guide
Start with Standard Deviation on daily charts for the most intuitive introduction to distribution-based risk analysis.
Method Selection: Begin with Standard Deviation
Setup: Use daily charts with 20-30 bins
Interpretation: Focus on quartile transitions as signals
Monitoring: Track distribution changes for regime detection
The tool provides comprehensive statistics including mean, standard deviation, quartiles, and current position metrics like Z-score and percentile ranking.
Enjoy, and please let me know your feedback! 😊🥂

Buy sell Trend VolumeThis indicator analyzes the flow of volume and price changes to identify potential trends.
Understanding Volume Indicator: A Comprehensive Guide
Introduction. The volume indicator is a vital tool investors and traders use to understand the liquidity and market activity in trading.

Quantum Harmonic Oscillator Overlay🧪 Quantum Harmonic Oscillator Overlay
A visual model of price behavior using quantum harmonic oscillation principles
📜 Indicator Overview
The Quantum Harmonic Oscillator Overlay applies concepts from both classical physics (harmonic motion) and quantum mechanics (energy states) to model and visualize how price orbits around a central trend line. It overlays a Linear Regression line (representing the “mean position” or ground state of price) and calculates surrounding energy levels (σ-zones) akin to quantum shells that price can "jump" between.
This indicator is particularly useful for visualizing mean reversion, volatility compression/expansion, and momentum-driven price breakthroughs.
🧠 Core Concepts
Linear Regression Line (LSR): This is the calculated center of gravity or equilibrium path of price over a user-defined period. Think of it like the lowest energy state or central axis around which price vibrates.
Standard Deviation Zones (σ-levels):
1σ: The majority of normal price activity; within this range, price tends to fluctuate if in balance.
2σ: Indicates volatility or possible breakout pressure.
3σ: Represents extreme movement — a phase shift in energy, potentially leading to reversal or continuation with higher momentum.
Quantum Analogy: Just like in a quantum harmonic oscillator, particles (here, prices) move probabilistically between discrete energy states. The further the price moves from the center, the more "energy" (momentum, volume, volatility) is implied.
⚙️ Input Parameters
Setting Description
Linear Regression Length The number of bars used to calculate the regression trend (default 100). Affects the central path and responsiveness.
σ Multipliers (1σ, 2σ, 3σ) Determine how far each band is from the regression line. Adjusting these can highlight different price behaviors.
Show Energy Level Zones Toggle visibility of the colored bands around the regression line.
Show LSR Center Line Toggles visibility of the white Linear Regression line itself.
🎨 Visual Components
Color Zone Interpretation
✅ Green ±1σ Normal oscillation / mean reversion area. Ideal for range-bound strategies.
🟧 Orange ±2σ Warning zone; price may be gaining momentum or volatility.
🔴 Red ±3σ High-momentum state or anomaly. These regions may imply trend exhaustion, reversals, or breakouts.
White Line: The LSR — the average trajectory of the price movement.
Pink Dots: Appear when price exceeds Zone 3 (outside ±3σ) — a signal of extreme behavior or a possible regime shift.
📈 How to Use This Indicator
1. Detect Overextensions
When price touches or breaches the 3σ zone, it is likely overextended. This can be used to anticipate potential snapbacks or strong breakout trends.
2. Identify Mean Reversion Trades
If price exits the 2σ or 3σ zones and returns toward the center line, this signals a likely mean reversion setup.
3. Volatility Compression or Expansion
Flat zones between σ levels suggest calm markets; widening bands suggest expanding volatility.
4. Use with Confirmation Tools
Combine with momentum oscillators (MACD, RSI) or volume-based signals to confirm reversals or continuation outside Zone 3.
🔮 Philosophical Note
This indicator embodies the metaphor that the market behaves like a quantum oscillator — price particles exist in a probabilistic field and jump between discrete zones of volatility and energy. Tracking these transitions allows the trader to see price behavior as rhythmic, wave-like, and multidimensional rather than purely linear.

Elite Trend FusionThis indicator combines multiple technical analysis tools to assist traders in identifying trends, support/resistance levels, and potential trading opportunities. Developed by @IQ-TRADER with contributions to the Alpha Section by @KivancOzbilgic, this script overlays the following components on your chart:
EMA1: A customizable Exponential Moving Average for short-term trend analysis.
SMA Cluster (50, 100, 200): Simple Moving Averages on daily timeframes to identify long-term trends and key support/resistance zones.
Anchored VWAP x2 (VWAPCVD & VWAPARZ): Two Volume Weighted Average Price lines anchored to user-defined dates, providing insights into price levels relative to volume from specific points in time.
AlphaTrend: A custom trend-following indicator based on ATR and MFI, helping to gauge market direction and volatility.
Usage InstructionsInstallation:
Copy and paste the script into the Pine Script editor on TradingView, then add it to your chart.
Customization:Adjust the periods for EMA, SMA50, SMA100, and SMA200 under the "Inputs" tab.
Set the anchor dates for VWAPCVD and VWAPARZ to analyze specific historical periods.
Enable or disable individual components (EMA1, SMA50, SMA100, SMA200, VWAPCVD, VWAPARZ, AlphaTrend) and toggle labels via the settings.
Customize colors and line thickness to suit your preferences.
Modify the AlphaTrend multiplier and period for tailored sensitivity.
Interpretation:
Use the EMA1 for short-term momentum and crossovers with SMAs.
Monitor SMA crossovers (e.g., SMA50 crossing SMA200) for trend changes.
The Anchored VWAPs act as dynamic support/resistance levels based on the selected anchor dates.
AlphaTrend provides a visual guide for trend direction; use it alongside other indicators for confirmation.
Labels on the last bar show the current value and percentage distance from the price for each enabled indicator.
Pine Screener Module Usage:
Add this indicator to the Pine Screener to filter stocks, forex pairs, or other instruments based on the calculated distances (in percentage) between the close price and SMA50, SMA100, SMA200, VWAPCVD, and VWAPARZ.
In the Screener, use the "SMA50 Distance (%)", "SMA100 Distance (%)", "SMA200 Distance (%)", "VWAPCVD Distance (%)", and "VWAPARZ Distance (%)" columns to identify overbought/oversold conditions or potential reversal points.
Example filters: Set conditions like "SMA50 Distance (%) > 5" to find stocks trading significantly above the 50-day SMA, or "VWAPCVD Distance (%) < -2" to spot assets below the anchored VWAP, indicating potential support levels.
Combine multiple conditions (e.g., SMA50 Distance (%) > 5 AND AlphaTrend > previous AlphaTrend) to refine your scan for bullish trends.
Note: Ensure the indicator is applied to the chart or screener with the desired timeframe for accurate results.
Notes
This is an overlay indicator, meaning it plots directly on the price chart.
The script uses daily SMA calculations for consistency across timeframes.
Labels appear only on the last bar and are customizable.
This tool is for educational and informational purposes only. Trading involves risks, and it is recommended to consult a financial advisor before making decisions.
The script is credited to @IQ-TRADER with acknowledgment to @KivancOzbilgic for the Alpha Section contribution, adhering to intellectual property guidelines.
No Financial Advice: The description explicitly states that the indicator is for educational use and not financial advice, complying with TradingView's policy against promoting trading signals as guarantees.
Clear Usage: Step-by-step instructions are provided to ensure users can apply the indicator effectively, including screener usage.
No External Links or Promotions: No external links or promotional content is included, aligning with platform rules.

Silver Bullet ICT – Sweep + FVG + OB🧠 Silver Bullet ICT – Sweep + FVG + OB (Smart Money Tool)
✅ Works on:
NASDAQ / US100
SPX500 / DAX / FX majors
BTC/USD and other crypto
Any asset with high liquidity and volatility during the New York PM session
📊 Strategy Flow:
“We observe what the 4H candle at 16:00 CET produces – then execute the trade on the 5-minute chart if a sweep is confirmed.”
🎯 Logic Breakdown:
Session Timeframe:
Defined between 16:00–17:00 CET – configurable in settings.
Wait for Sweep:
A liquidity grab above previous high (or below previous low) during session.
Marked with triangle (▲ red for high, ▼ green for low).
Confirmed Signal:
A candle closes against the sweep direction.
Volume (optional) is above 20-SMA.
Triggers BUY (green label) or SELL (red label).
Entry Execution:
After the first 4H candle closes at 16:00 CET, look for a confirmed signal on 5-minute chart.
Rozegranie sygnału tylko, gdy zamknie się świeca potwierdzająca sweep.
Confluence:
OB (Order Blocks) and FVG (Fair Value Gaps) help refine targets and context.
Additional box is drawn to visualize session range.
🕊️ Notes:
Does not repaint sweep confirmations
Built-in alerts for sweep and entry signals
Customizable volume filter, box visuals, and session times

Friedrich's Ichimoku & EMA Strategy📈 Friedrich's Ichimoku & EMA Strategy
This strategy combines the strength of the Ichimoku Cloud with the long-term trend confirmation of the 200 EMA to identify high-probability long entries.
🧠 Strategy Logic
Entry Conditions:
- Price is above the Ichimoku Cloud (bullish confirmation).
- Price is above the 200 EMA (long-term trend is up).
Exit Conditions:
- Price falls below the Ichimoku Cloud, or
- Price drops below the 200 EMA while in an open position.
📊 Visual Features
Plots Lead Line 1 & 2 of the Ichimoku Cloud.
Fills the cloud area for clear visual trend recognition.
Plots the 200 EMA to show long-term trend alignment.
🔔 Alerts
Long Entry Signal: When all conditions align for a long.
Close Signal: When price invalidates the setup.
🕒 Recommended Use
Best used on the 6H (6-hour) timeframe.
Optimized for Bitcoin (BTC/USD), but adaptable to other trending assets.
💡 Use Case
This strategy is designed for traders who want to:
Ride strong trends.
Use a rule-based approach with clear visual guidance.
You can customize the Ichimoku or EMA settings to fit your asset or time frame.

Tiny Candle + High Volume DetectorTiny Candle + High Volume Detector
This simple indicator highlights candles with:
A very small body (user-defined % of the close)
A significant volume spike (volume > X times average)
📊 Use this to spot:
Compression zones before breakout
Smart money absorption
Hidden accumulation
⚙️ Adjustable Parameters:
Max Body Size (% of close)
Volume Spike Multiplier
Volume SMA Period
🔔 Alerts are included.
Works on all timeframes and instruments. Best used in trending or consolidating environments to detect buildup before expansion.

Supply & Demand Zones (Buyer/Seller Buildup)
This indicator automatically detects high-probability Supply and Demand Zones, highlighting key buyer and seller buildup areas based on price structure and volume behavior.
It helps traders identify potential reversal zones by:
Marking strong support (demand) and resistance (supply) levels
Tracking price rejections and consolidations
Visualizing where buyer/seller momentum accumulates
Filtering noise to focus only on the most relevant zones

Ex Highset the High that we want to set , such as 10 days, 20 days, 60 days, 120 days, 250 days, etc.

S&P500 Screener Logic with Market Cap (v6)The script uses indicators to show if a equity is good enough for investment


Turtle Trading System + ATRTurtle Trading System + ATR
This Pine Script v5 indicator implements a Turtle Trading System with ATR integration.
It plots a 20-day high (red), 20-day low (blue), and an ATR-based level (orange) shifted upward by a user-defined percentage (default 5%).
Customizable inputs include lookback period (default 20), ATR period (default 14), and ATR offset.
Dynamic labels show the 20-day high, low, and ATR values at the current bar, updating with price.
Suitable for trend-following strategies, it highlights breakout and volatility levels.

Universal ATR Grid from Entry Price with AlertsUniversal ATR Grid from Entry Price with Alerts
This Pine Script v6 indicator creates a dynamic price grid based on a user-defined entry price and ATR for selected instruments (SOLUSDT, XRPUSDT, DOGEUSDT, PEPEUSDT, WIFUSDT).
Users can customize the entry price, ATR, number of levels (up to 5), and step multiplier per instrument.
The grid shows long (green) and short (red) levels around the entry price (gray), with labels offset right.
Lines extend from labels to the current bar, updating dynamically.
Alerts trigger on breakouts of long, short, and entry levels. Instrument names can be modified in the script.


RSI Cross Alert (Overbought/Oversold)Alerts when RSI breaks below 70 and when RSI breach 30 and above

Gradient Candles + MACD + EMAs + WMA + EMA CrossGradient candles that change color based on MACD values selected under custom settings. Also display of the moving averages I use the most. EMA and MACD crosses can be displayed or turned off.

Volume Scanner (Spikes & Drops) [Context]
💡 In many trading strategies, volume is used as a filter — but not all volume matters.
What really counts are moments when volume suddenly spikes or drops — these are the bars where something important might be happening: a large player enters the market, a fakeout occurs, or a trend shift begins.
🎯 What this indicator does:
This script highlights only the most significant volume anomalies, filtering out the noise and focusing on real movement:
🔺 Green background = Volume Spike (sudden increase)
🔻 Red background = Volume Drop (sudden decrease)
📊 Optional contextual filter:
Enable price context to show signals only when volume shifts occur alongside a breakout of recent high/low.
Fully customizable: control the strength of spikes/drops, the lookback period, and the minimum gap between signals.
📦 Great for:
Adding a clean volume filter to price action strategies
Quickly spotting key volume bars in real time
Works on any timeframe and market (crypto, forex, stocks, indices)

Multiple of Net Asset Value (mNAV)This TradingView indicator calculates and displays the multiple of Net Asset Value (mNAV) for a selected symbol. It uses the asset symbol held, the quantity of assets held, and the number of outstanding shares to compute mNAV per share. The indicator compares the current price to mNAV, showing how many times the asset is trading above or below its mNAV. Users can configure up to four custom mNAV multiples for reference lines, helping to visualize overvaluation or undervaluation relative to mNAV. Ideal for analyzing ETFs, trusts, or crypto funds with transparent holdings.
