Ultra Supply & DemandUltra Supply and Demand fixed.
Order Block Detection: Identifies potential order blocks (demand/supply zones)
Indicators and strategies

VisionThis indicator helps visually distinguish and analyze the Asian, London, and New York trading sessions. It's a great tool for intraday traders focusing on time-based liquidity zones.
🔧 Features:
Asian range box, London / New York high-low lines with distinct colors.
Customizable time windows, Asian range deviations and colors.

Zero-Lag RSI DivergenceZero-Lag RSI Divergence
Overview
This indicator identifies RSI divergences in real-time without delay, providing immediate signals as price-momentum discrepancies develop. The indicator analyzes price action against RSI momentum across dual configurable periods, enabling traders to detect potential reversal opportunities with zero lag.
Key Features
Instant Divergence Detection : Identifies bullish and bearish divergences immediately upon formation without waiting for candle confirmation or historical validation. This eliminates signal delay but may increase false signals due to higher sensitivity.
Dual Period Analysis : Configure detection across two independent cycles - Short Period (default 15) and Long Period (default 50) - allowing for multi-timeframe divergence analysis and enhanced signal validation across different market conditions.
Visual Divergence Lines : Automatically draws dashed lines connecting divergence points between price highs/lows and corresponding RSI peaks/troughs, clearly illustrating the momentum-price relationship.
Customizable RSI Parameters : Adjustable RSI length (default 14) allows optimization for different market volatility and trading timeframes.
How It Works
The indicator continuously monitors price action patterns and RSI momentum:
- Bullish Divergence : Detected when price makes lower lows while RSI makes higher lows, suggesting potential upward momentum
- Bearish Divergence : Identified when price makes higher highs while RSI makes lower highs, indicating potential downward momentum
The algorithm uses candle color transitions and immediate RSI comparisons to trigger signals without historical repainting , ensuring backtesting accuracy and real-time reliability.
How To Read
Important Notes
Higher Signal Frequency : The zero-lag approach increases signal sensitivity, generating more frequent alerts that may include false signals. Consider using additional confirmation methods for trade entries.
Non-Repainting : All signals are generated and maintained without historical modification, ensuring consistent backtesting and forward-testing results.
Input Parameters
RSI Length: Period for RSI calculation (default: 14)
Short/Long Periods: Lookback periods for divergence detection (default: 15/50)
Line Colors: Customizable colors for short and long period divergence lines
Label Settings: Optional divergence labels with custom text
This indicator is designed for traders seeking immediate divergence identification across multiple timeframes while maintaining signal integrity and backtesting reliability.

20/40/6020/40/60 candle separator. Three lines only on all timeframes. Range length and height included. Doesn't mess up the scaling. Togglable elements and movable lines.

Enhanced Swing + Intraday Strategy + Entry/Exit LabelsPurpose
This TradingView Pine Script is designed for swing traders who hold trades for 3–5 days, but also occasionally do intraday trading. It combines momentum indicators, moving averages, and support/resistance tools to give a complete picture of trend direction, entries, and exits.
Features and Logic Breakdown
1. 20-Day Simple Moving Average (Daily Timeframe)
Fixed to the daily chart, regardless of your active chart timeframe.
Acts as a trend filter and price magnet, especially useful for mean reversion setups.
Helps assess whether the stock is overbought/oversold relative to its 1-month average.
2. VWAP (Volume-Weighted Average Price)
Useful for intraday trades.
Acts as an intraday "fair value" and gravity zone.
Helps identify entries near institutional support/resistance.
3. 9-EMA and 20-EMA (Current Timeframe)
Short-term trend signals.
When 9 EMA crosses above 20 EMA → bullish entry.
When 9 EMA crosses below 20 EMA → bearish exit.
4. Entry/Exit Labels
Plots "Enter" label (green) when 9 EMA crosses above 20 EMA.
Plots "Exit" label (red) when 9 EMA crosses below 20 EMA.
Helps visually track signals without guesswork.
5. Alerts
Built-in conditions to trigger alerts for:
Bullish cross (9 EMA above 20 EMA)
Bearish cross (9 EMA below 20 EMA)
6. Bollinger Bands (20-period, 2 Std Dev)
Shows volatility expansion/contraction around the 20-period SMA.
Can help identify overextended prices or squeeze setups.
Plotted as gray upper/lower bands with shading.
7. MACD (12/26/9) – Hidden
Measures momentum and trend strength.
Lines and histogram are hidden by default but can be toggled on in settings.
8. RSI (14) – Hidden
Measures overbought/oversold conditions.
Hidden by default but plotted between 0–100 with 30/70 lines.
How to Use
On Daily Charts:
Use the script for core swing entries. Enter long on 9 EMA > 20 EMA when price is near the 20-day SMA. Confirm with RSI/MACD if needed.
On Intraday Charts:
Use VWAP and EMAs to manage exits or find sharp intraday pullbacks.
The 20-day SMA still acts as an anchor.
Recommended Trade Flow
1. Identify price trend: Is it above or below the 20-day SMA?
2. Wait for EMA cross entry signal ("Enter" label).
3. Check if RSI is in neutral (not overbought) and MACD histogram is rising.
4. Manage trade using VWAP and 20-day SMA as guide.
5. Exit when "Exit" label triggers or price extends from VWAP.

DCA by Vuong Thai v2 %verview of "DCA by Vuong Thai %" – Upgraded Version
Main Function:
This script automatically detects optimal DCA (Dollar-Cost Averaging) buy points and smart profit-taking zones based on a combination of technical signals: EMA, candlestick patterns, volume, RSI, and price distance from EMA.
It helps you optimize capital allocation using a structured averaging-down strategy and exit trades when a target price range is reached.
✅ Buy Logic (Buy Signal)
A buy signal is triggered when all of the following conditions are met:
Strong bullish candlestick: Green candle with a longer lower wick than upper wick
Price is below the EMA → indicating a downtrend
Volume is above the moving average (if volume filtering is enabled)
Price is at least a certain percentage below the EMA (e.g., ≥ 1%)
RSI is below 30 → indicating an oversold condition
No repeat buys unless price makes a new low → helps avoid premature entries
👉 When a buy signal appears:
A DCA Zone (buy region) is drawn on the chart
A label with the corresponding DCA percentage is displayed automatically (e.g., "DCA 5%", "DCA 10%")

Silver Bull Flag Breakout AlertDescription:
This script detects a bullish breakout in Silver (XAGUSD) above $37.60, confirming a bull flag continuation pattern on the daily chart. It optionally plots a 21 EMA as a trailing stop and includes a customizable alert condition for trade execution or monitoring.
Features:
• Alerts on daily close above $37.60
• Optional trailing stop (21 EMA)
• Visual breakout marker
• Ideal for swing trades targeting $41–$45

SessionsThis indicator displays 3 minimalistic session boxes.
You can change the time, timezone input, box colors.
This script also has a timeframe filter.
For example, if you wish that the indicator disables itself when you switch to a higher timeframe chart, it will do it automatically.

Multi-Timeframe Bands (final, with labels)This is a simple Kelt style Band indicator draws colored horizontal bands representing the high (top) and low (bottom) for each of the following timeframes:
4h: Blue (bottom), Red (top)
1D: Gold (bottom/top)
1W: Purple (bottom/top)
1M: Orange (bottom/top)
Quarterly: Light purple (bottom/top)
The script works on any chart timeframe, and the bands will update dynamically.

RSI PotentialRSI Potential
This indicator does more than just track RSI; it measures the "energy" or "fuel" left in a trend. It answers a critical question: how much further can the price move before momentum is exhausted?
The key insight is that high momentum often means low potential, and vice versa. This inverse relationship is what allows the indicator to provide powerful, forward-looking signals about trend health and potential reversals.
Think of it like a race car:
Momentum is the car's current speed.
Potential is the amount of fuel left in the tank.
A car at top speed (high momentum) is burning fuel rapidly (potential is decreasing). A car just starting (low momentum) has a full tank of fuel (high potential). This indicator helps you see the fuel gauge, not just the speedometer.
This indicator plots three distinct components in a separate pane below your chart:
1. Upside Potential (Green Line)
What it shows: The percentage price increase required to hit the Overbought RSI Level. In other words, how much "fuel" is left for the upward trend.
How to interpret it:
Low Value (Approaching Zero): This is a warning sign. It means the price is already in high gear, and there is very little room left to run before hitting overbought exhaustion. Even if the price is rocketing up (high momentum), low potential signals the rally is likely on its last legs.
High Value: This indicates the market has a full tank of fuel for a rally. Even if the price is moving sideways or slowly (low momentum), the high potential suggests that if a new uptrend starts, it has the energy to be sustainable and significant.
2. Downside Potential (Red Line)
What it shows: The percentage price decrease required to hit the Oversold RSI Level—the "fuel" for a downtrend.
How to interpret it:
Low Value (Approaching Zero): A warning for bears. The price may be dropping fast (high momentum), but it's running out of energy to fall further. This signals seller exhaustion and increases the probability of a bounce or reversal.
High Value: The market has significant room to fall before becoming oversold. This can confirm the health of a new downtrend or suggest that a current downtrend has more to go.
3. Net Potential (Columns / Histogram)
What it shows: The net balance of energy: Upside Potential - Downside Potential. It answers, "Which side has more fuel in the tank?"

Price - MA DifferencePrice difference from MA plots the difference between the closing price and a moving average (either SMA or EMA) in a separate pane

Sessions by EC35 (Berlin Zeit)This script displays the Asia session (red), London session (green), and NY session (blue). Have fun

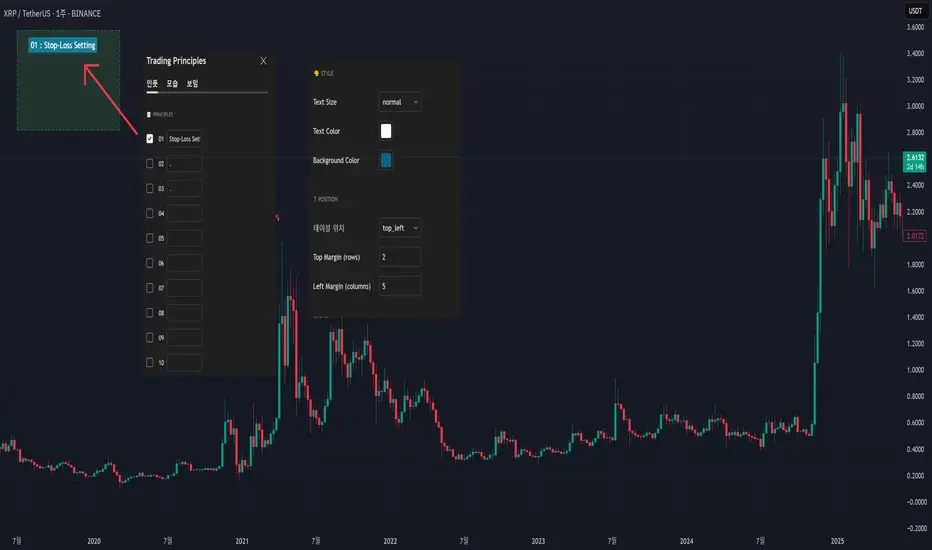
My Own Trading Principles - for Avoiding Emotional TradingThis indicator lets you clearly mark your personal trading principles right on the chart.
Far too often, traders dive into the market without clear guidelines, only to find themselves facing substantial losses and ultimately stepping away discouraged.
Imagine having your own carefully-crafted set of trading rules?tailored just for you. By adhering to these principles, you can better manage risks, limit losses, and build a sustainable, long-term approach to trading.
Writing notes on your monitor or jotting them down on random sticky pads can be forgettable?and let's admit it, we've all misplaced a note or two! Why not keep your rules clearly visible directly on your chart, guiding your trades with consistency and confidence?
When I first began trading, my mentors consistently emphasized the importance of having my own set of trading principles. And guess what?they were right! It really does matter.
I've included numerous menu options so you can freely customize its appearance.
This script is open-source; feel free to modify and adapt it to your own needs.
Volume-Confirmed Price Momentum# **Volume-Confirmed Price Momentum (VCPM) Indicator**
## **🔍 Overview**
Introducing the **Volume-Confirmed Price Momentum (VCPM)**, a sophisticated dual-metric indicator designed to identify high-probability momentum moves by analyzing the relationship between price action and volume dynamics. This indicator combines correlation analysis with volume strength validation to filter out weak signals and highlight institutional-backed movements.
---
## **⚙️ Core Mechanics**
**Price-Volume Correlation Engine:**
- Calculates real-time correlation between price movements and volume
- Configurable lookback period (default: 8 bars)
- Option to use price changes or absolute values
- Correlation range: -1.0 (perfect negative) to +1.0 (perfect positive)
**Volume Strength Analyzer:**
- Compares current volume against its moving average (default: 128 periods)
- Normalizes volume ratio to 0-1 scale for consistent interpretation
- Identifies when volume significantly exceeds historical norms
---
## **📊 Signal Generation**
### **🟢 Bullish Confirmation Signal**
**Trigger:** Positive correlation > 0.6 + Volume ratio > 0.5
- Price and volume moving in harmony upward
- Above-average volume confirms the move
- Indicates strong institutional buying interest
### **🔴 Bearish Confirmation Signal**
**Trigger:** Negative correlation < -0.6 + Volume ratio > 0.5
- Price declining with increasing volume
- Suggests distribution or institutional selling
- High-confidence bearish momentum
---
## **🎯 Trading Applications**
**Breakout Validation:**
Filter false breakouts by requiring volume confirmation before entering positions.
**Trend Continuation:**
Identify when existing trends have strong volume backing for continuation plays.
**Distribution Detection:**
Spot potential tops when price struggles despite high volume (negative correlation).
**Entry Timing:**
Built-in alert system notifies when both conditions align for optimal entry points.
---
## **🔧 Customization Features**
- **Correlation Period:** Adjust sensitivity (2-500 bars)
- **Volume Averaging:** Modify volume comparison timeframe
- **Alert Thresholds:** Fine-tune correlation and volume ratio triggers
- **Visual Options:** Toggle volume histogram display
- **Price Source:** Choose from OHLC or custom sources
---
## **💡 Why VCPM Works**
Traditional momentum indicators often generate false signals during low-volume periods. VCPM solves this by requiring **dual confirmation**: price momentum must be supported by corresponding volume activity. This approach:
- Reduces whipsaws and false breakouts
- Identifies institutional participation
- Provides higher conviction trade setups
- Works across all timeframes and markets
---
## **📈 Best Use Cases**
✅ **Crypto markets** (high volatility, volume-driven)
✅ **Stock breakouts** (earnings, news events)
✅ **Forex majors** (during high-impact news)
✅ **Futures trading** (momentum confirmation)
---
## **⚠️ Important Notes**
- Works best in liquid markets with consistent volume data
- Combine with support/resistance levels for enhanced accuracy
- Consider market context (trending vs. ranging conditions)
- Not recommended for extremely low-volume periods
---
## **🚀 Getting Started**
1. Add VCPM to your chart as a sub-panel indicator
2. Configure correlation threshold (start with 0.6)
3. Set volume ratio threshold (start with 0.5)
4. Enable alerts for automated signal detection
5. Backtest on your preferred timeframe and instrument
---
**Ready to enhance your momentum trading with volume confirmation? Try VCPM and experience the difference institutional-backed signals can make in your trading results.**
*Available in Pine Script v6 - Compatible with all TradingView accounts*

Multiplied and Divided Moving Average
Customize Settings:
Access the indicator settings to adjust:
MA Type (SMA, EMA, WMA, VWMA, RMA)
MA Length (default: 14)
Multiply Factor (default: 5.0)
Divide Factor (default: 5.0)
Source (default: close)
Show Buy/Sell Labels (default: enabled)
Blue line: Base moving average.
Green line: Moving average multiplied by the specified factor.
Red line: Moving average divided by the specified factor.
"Buy" label: Appears when price crosses below the red line (potential oversold signal).
"Sell" label: Appears when price crosses above the green line (potential overbought signal).
The Buy/Sell labels are based on price crossing the multiplied/divided lines, which may produce signals in volatile markets. Test the indicator in your trading context to ensure it aligns with your strategy.
The showLabels toggle allows you to declutter the chart if desired.

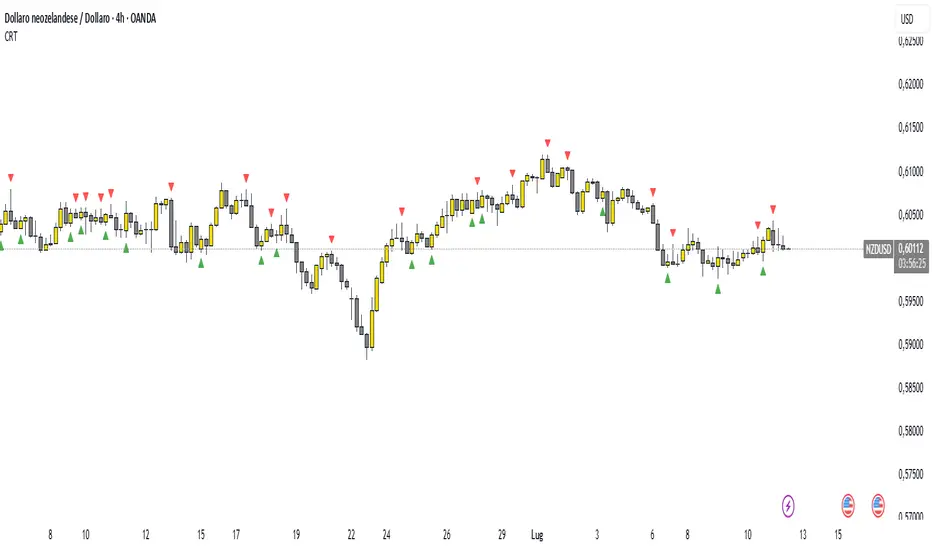
Candle Range Theory (CRT) indicator📌 Indicator Name: Candle Range Theory (CRT) indicator
This indicator detects potential bullish and bearish reversal setups based on specific candlestick price action behavior. It is designed to highlight moments when the market may be rejecting extremes and preparing to reverse direction — but only after confirmation with the closing price.
🔍 How It Works:
Bullish Setup (Long Signal):
The previous candle is bearish (closes lower than it opens).
The current candle makes a lower low than the previous one.
The current candle closes above the previous candle’s close.
Bearish Setup (Short Signal):
The previous candle is bullish (closes higher than it opens).
The current candle makes a higher high than the previous one.
The current candle closes below the previous candle’s close.
Signals are only triggered after the bar is fully closed, to avoid premature entries.
🔔 The script includes alert conditions for both long and short setups so you can receive notifications instantly.
🎥 Inspiration:
The idea for this indicator came from the excellent educational content presented in this video:
"How to Read Candlesticks Like a Pro"
We highly recommend watching it to better understand the price action principles behind this signal.
Daily 50‑ & 200‑SMA Ceiling Radar — EnhancedDescription:
This custom TradingView indicator, developed by Trader Malik and licensed under Trades Per Minute, is a powerful visual tool for identifying how price behaves relative to major daily moving averages — the 50-SMA and 200-SMA. It helps traders quickly understand key technical dynamics such as trend alignment, MA proximity, and short-term momentum sentiment — all displayed on a clean, minimal overlay with visual alerts and an adjustable data table.
FEATURES
1. Daily 50 & 200 Simple Moving Averages (SMA):**
- Displayed directly on the chart using distinct blue and orange lines.
- These serve as primary trend filters and support/resistance zones.
2. Price Highlighting:
- A red background flashes momentarily when the price crosses either the 50-SMA or 200-SMA.
- A green background fills the chart when price is above both MAs (bullish zone).
- A red background persists if price is below both MAs (bearish zone).
3. MA Gap Analysis Table:
- 50-SMA Row**: Shows % gap between 50-SMA and 200-SMA.
- 200-SMA Row**: Shows % gap between 200-SMA and 50-SMA.
- Sentiment Row**: Displays short-term trend bias based on the slope of the past 7 daily closes — Bullish, Neutral, or Bearish.
USER SETTINGS
Table Location: Choose between **Top Right** or **Bottom Right** of the chart.
Table Size: Select **Small**, **Medium**, or **Large** to suit screen preferences and layout aesthetics.
This script is **intellectual property of Trades Per Minute** and distributed by **Trader Malik** for use under licensing terms. Redistribution or repurposing without authorization is strictly prohibited.

Dynamic 5% Below SuperTrend ResistanceA indicator which give me horizontal line 5% distant from supertrend price and price of this indicator should be on the price bar

SMA - ATR with Dual SMAs + Candle Body Inside SignalsSMA - ATR with Dual SMAs + Candle Body Inside Signals

Dynamic Spot vs Perps Premium (Area Plot)This is a script to give you an easy overall view on the spot perp premium which could indicate the momentum is drove by spot or perps

EMA 9/21 Crossover with 0.23% TP and 0.10% SL🔍 Strategy Logic:
Buy Entry: When EMA 9 crosses above EMA 21
Sell Entry: When EMA 9 crosses below EMA 21
🎯 Trade Management:
Target Profit: +0.23%
Stop Loss: -0.10%
Works well on lower timeframes (1m, 5m, 15m) for intraday scalping
✅ Use Cases:
Scalping and short-term trading
Works across assets (Gold, Nifty, BankNifty, Crypto, Forex)
Ideal for traders who prefer fast entry-exit setups

Intelligent Top & Bottom Finder v9.8 Keyvankh📈 Intelligent Top & Bottom Finder v9.8 Keyvankh
A next-generation all-in-one trading system for precise tops, bottoms, and reversals across all timeframes.
---
🟢 Overview
This indicator is a powerful and intelligent solution for detecting market tops and bottoms, key reversals, and S/R zones with institutional-grade accuracy. Designed for traders seeking an edge in any market (crypto, forex, stocks), it combines advanced candlestick recognition, multi-indicator confirmation, smart support/resistance clustering, and strict signal filtering into one seamless tool.
---
🔎 How Does It Work?
1. Advanced Support & Resistance Clustering
Automatically detects and draws high-probability support and resistance zones using dynamic ATR-based pivot clustering.
Highlights breakouts and retest (flip) zones in real-time, adapting to changing market structure.
2. Full Candlestick Pattern Recognition
Scans for 15+ classic and advanced patterns: Engulfing, Pin Bar, Doji, Three Bar, Marubozu, Hammer, Shooting Star, Three White Soldiers, Three Black Crows, Tweezer, Morning/Evening Star, Kicker, Belt Hold, and more.
Scores each pattern’s strength based on location (S/R zone, retest, breakout), volume context, and confirmation signals.
3. Multi-Indicator Confirmation Engine**
Integrates and scores confirmation from up to five additional sources:
RSI Games 1.2** (smoothed LTF momentum shifts)
MACD Divergence** (bullish/bearish momentum reversal)
QQE+ v7 Advanced** (dynamic volatility filter)
OBV Trend Filter** (volume-backed trend validation)
Volume Game** (net volume spike and reversal detection)
Each module can be enabled or disabled to fit your personal trading style.
4. Institutional S/R and Retest Logic
Real-time recognition of major trendline breaks, retest zones, and price flips.
Automatic labeling and coloring of S/R zones, retest boxes, and confirmation candles.
5. Smart Buy & Sell Signal Generation**
Combines all scoring modules with strict logical filters and “failsafe override” logic (guaranteeing signal on confirmed hammers, engulfings, etc. even if other filters disagree).
Plots clear “BUY” and “SELL” labels only when a strong, multi-factor signal appears—minimizing noise and maximizing reliability.
Built-in fallback logic (optional) for edge cases.
6. Alerts & Automation Ready
TradingView alerts for all BUY, SELL, or ANY signal conditions—perfect for auto-trading or notification setups.
---
*⚙️ Customizable Inputs
Enable/Disable any module (RSI Games, MACD, OBV, QQE+, Candlestick Scanner, Volume Game)
Minimum Confirmations** required for a signal (1–10)
Pivot/Zone Sensitivity:** ATR multiplier, pivots per cluster, retest bar duration
LTF (Lower Timeframe) Confirmation:** Fully configurable
---
📊 How To Use**
Apply on any timeframe and symbol**—crypto, stocks, forex, indices.
Use as a **standalone reversal/entry tool** or to confirm your own technical setups.
Combine with your favorite momentum, trend, or volume indicators for advanced confluence.
Set up **TradingView alerts** for auto-trading, Telegram/email notifications, or trade journaling.
---
🟢 What Makes This Unique?
All-in-one multi-indicator fusion:** No more juggling a dozen scripts.
Institutional logic:** Goes beyond basic signals with true S/R, retest, and volume logic.
Full transparency:** Source code is clear and commented (if published open-source).
Fast and reliable:** Optimized for minimal lag and maximum accuracy.
---
⚠️ Disclaimer**
This indicator is a tool to assist with trade timing and risk management. **No system is 100% accurate.** Always use in conjunction with your own analysis and risk management practices.
---
📚 Credits & License**
Created by Keyvan Khodakhah.
You may use, modify, or share this script under the (mozilla.org).
Please credit the original author if you fork or reuse in public.
---
Questions, feedback, or collaboration? Contact: Keyvankh
---
Precision in technical analysis comes from layers of confluence and discipline. This tool brings that precision to your chart.

HTF Candle Extremes Zigzag (Drawn on LTF)HTF Candle Extremes Zigzag (Drawn on LTF)
This indicator plots zigzag lines connecting the extremes (highs and lows) of Higher Timeframe (HTF) candles directly on your lower timeframe (LTF) chart. It visually highlights trend changes and HTF candle structure by drawing colored lines representing uptrends and downtrends based on HTF candle extremes.
"Key Features"
Higher Timeframe Tracking: Select any HTF to track candle extremes using the built-in security function.
Zigzag Lines: Connects HTF candle lows to highs in an intuitive zigzag pattern.
Trend Indication: Uptrend lines are green, downtrend lines are red (customizable colors).
Customizable Line Width: Adjust the thickness of the zigzag lines for better visibility.
Drawn on Lower Timeframe: All lines appear on your active lower timeframe chart, allowing easy visual correlation.
"How It Works"
The script fetches the open, high, low, close, and time data of the specified HTF candle. It detects new HTF bars and identifies trend direction changes by comparing the highs and lows of consecutive HTF candles.
- When an uptrend is detected, vertical lines are drawn from low to high of the HTF candle, connected to the previous extreme low.
- When a downtrend is detected, vertical lines are drawn from high to low, connected to the previous extreme high.
- Transitions between trends are highlighted by connecting the last extreme of the previous trend to the current extreme, creating a clean zigzag pattern.
Usage Notes:
Ideal for traders who want to visualize HTF market structure and trend changes while analyzing price action on lower timeframes.
---
© The_Forex_Steward
(mozilla.org)
