Date Marker GPTDate Marker GPT
By Jimmy Dimos (corrected by ChatGPT-o3)
Description
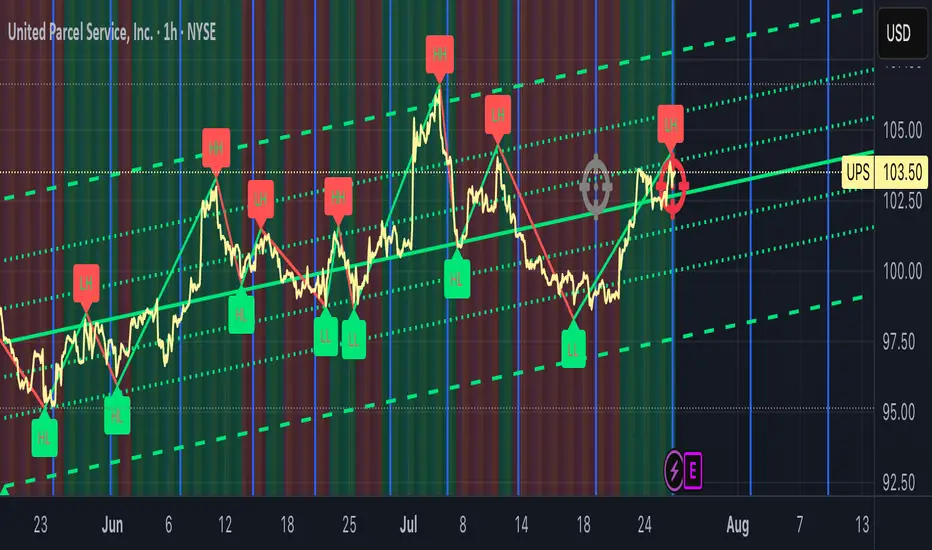
This overlay indicator automatically plots vertical lines at each weekly option-expiration timestamp (Friday at 3 PM CST) for both historical and upcoming periods, helping you visualize key expiration dates alongside your price action and regression tools. Shown is my Date Maker GPT vertical blue Lines, Linear Regression Channel(not part of my script) and zigzag++ also not part of my script.
⸻
Key Features
• Past Expirations: Draws 12 past Friday markers at 3 PM CST
• Future Expirations: Projects 12 upcoming Friday markers at 3 PM CST
• Timezone Handling: Uses UTC internally (21:00 UTC = 3 PM CST)
• Customizable: num_fridays_past and num_fridays_future inputs let you adjust how many weeks to display
⸻
How It Works
1. Timestamp Calculation
• Uses Pine Script’s dayofweek() and timestamp() functions to find each Friday at the target hour.
• Two helper functions, get_previous_friday() and get_next_friday(), compute offsets in days/weeks based on the current bar’s date.
2. Drawing Lines
• Loops through the specified number of weeks in the past and future.
• Calls line.new() for each expiration timestamp, extending lines across the entire chart.
⸻
Usage Tips
• Overlay this script on any OHLC chart to see how price tends to cluster around option expirations.
• Combine with a linear regression or trend-channel indicator to anticipate likely trading ranges leading into expiration.
• Tweak the num_fridays_past and num_fridays_future parameters to focus on shorter or longer horizons.
⸻
Disclaimer: This tool is provided for educational and analytical purposes only. It is not financial advice. Always conduct your own research and risk management.
Indicators and strategies
Step-OMA with SignalsThe Step-OMA with Signals is a sophisticated trend-following indicator that combines Loxx's Optimized Moving Average (OMA) algorithm with an advanced step function to create a highly responsive yet smooth trend detection system. This indicator excels at identifying trend changes early while minimizing false signals through its adaptive filtering mechanism.
Core Algorithm Components
1. Optimized Moving Average (OMA) Foundation
Based on Loxx's advanced OMA implementation
Uses a 6-stage exponential smoothing process
Incorporates adaptive period calculation based on market noise
Employs Jurik-style smoothing techniques for superior signal quality
2. Step Function Integration
Implements a step-based trend detection mechanism
Uses ATR-based dynamic threshold calculation
Maintains trend consistency through threshold memory
Provides clear trend change identification
3. Adaptive Noise Filtering
Automatically adjusts to market volatility
Calculates optimal averaging periods based on price noise
Reduces false signals in choppy market conditions
Speed (Default: 3.0, Range: -1.5 to unlimited)
This is the most critical parameter affecting indicator behavior:
Positive Speed Values (0 to 10.0+):
Creates faster, more responsive signals
Higher values increase sensitivity to recent price action
Negative Speed Values (-1.5 to -0.1):
Produces smoother, more conservative signals
Reduces noise and false breakouts
Creates delayed but more reliable trend confirmations
Adaptive (Default: True)
When enabled: Automatically adjusts averaging period based on market noise
When disabled: Uses fixed length parameter
Recommendation: Keep enabled for most market conditions
Sensitivity Factor (Default: 3.0)
Controls the threshold distance for trend change detection
Lower values: More frequent signals, higher sensitivity
Higher values: Fewer but more reliable signals
Optimal range: 2.0-5.0 depending on market volatility
Step Size Period (Default: 50)
Determines the ATR calculation period for dynamic thresholds
Affects the indicator's adaptation to volatility changes
Lower values: More reactive to recent volatility
Higher values: More stable threshold calculation
For a trading application, Step-OMA is a suitable base filter to complement other types of signaling indicators (oscillators, momentum indicators).
Disclaimer: This indicator is a technical analysis tool and should be used in conjunction with proper risk management and comprehensive market analysis. Past performance does not guarantee future results.
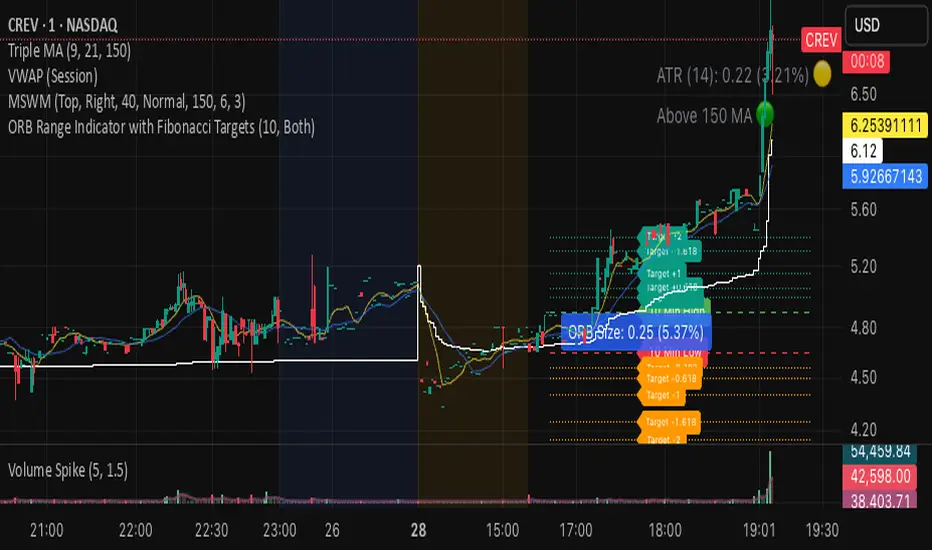
ORB Range Indicator with Fibonacci Targets
This script plots the Opening Range (ORB) high and low based on a configurable time window (5–45 minutes from the U.S. session open at 9:30 AM EST).
Once the ORB window closes, the indicator draws horizontal lines marking:
ORB High and Low
The size of the range in price and %
Fibonacci-based price targets above and below the range (0.382, 0.618, 1.000, 1.618, 2.000)
You can control:
Which Fibonacci levels to display
Whether to show long targets, short targets, or both
All drawings are automatically cleared at the start of each trading day.
Ideal for breakout traders using ORB and Fibonacci extensions for target planning.
Momentum Reversal StrategyBEST USE IN 15MIN TIME FRAME EURUSD / XAUSUD
1. Strategy Overview
This strategy hunts short-term momentum reversals at key levels during high-liquidity sessions.
Timeframes: 5-minute for entries; 15-minute for trend context
Sessions: London for EUR/USD & GBP/USD; New York for XAU/USD
Pairs: EUR/USD, GBP/USD, XAU/USD
Indicators (3 max):
EMA(20) and EMA(50) (close)
MACD (12, 26, 9) histogram
Optional: RSI(14) (for divergence filter)
2. Entry Rules
Trend Filter (15 min):
Long only if EMA20 > EMA50; short only if EMA20 < EMA50.
Price-Action Zone (5 min):
Identify recent swing high/low within past 20 bars.
Draw horizontal support (for longs) or resistance (for shorts).
Indicator Alignment (5 min):
MACD histogram crossing from negative to positive for longs, positive to negative for shorts.
Candle close beyond EMA20 in direction of trade.
Candle Confirmation:
Bullish engulfing or hammer at support for longs; bearish engulfing or shooting star at resistance for shorts.
Entry Execution:
Place market order on candle close that meets all above.
3. Exit Rules
Stop-Loss (SL):
Long: 1.5× ATR(14) below entry candle low.
Short: 1.5× ATR(14) above entry candle high.
Take-Profit (TP):
Set at 2× SL distance (RR 1:2).
Trailing SL:
After price moves 1× SL in profit, trail SL to breakeven.
Partial Booking:
Close 50% at 1× SL (50% of TP), move SL to entry.
Close remaining at full TP.
4. Trade Management
False Signal Filter: Skip trades when RSI(14) > 70 for longs or < 30 for shorts (avoids overbought/oversold extremes).
One Trade at a Time: No multiple positions on same pair.
Session Cutoff: Close any open trade 15 minutes before session end.
5. Risk Parameters
Risk per Trade: 1% of account equity.
Reward Target: ≥2% (1:2 RR) per trade.
Win-Rate Expectancy: ≥75% based on indicator confluence and price-action confirmation.

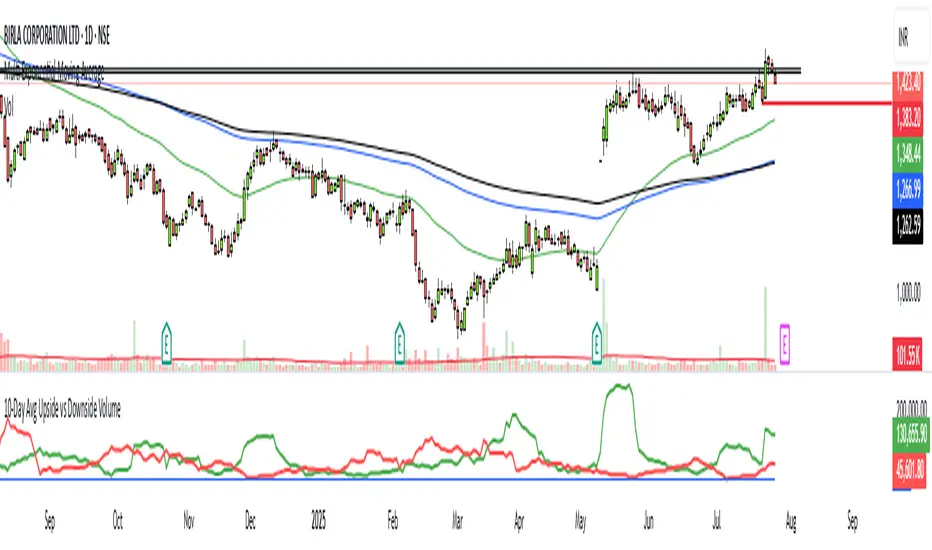
Key Indicators Dashboard (KID)📌 Overview
Key Indicators Dashboard (KID) is a comprehensive all-in-one technical analysis tool designed for discretionary, systematic, and quantitative traders. It brings together multiple essential trading metrics into a highly customizable, interactive dashboard that overlays directly on your TradingView chart.
🎯 What Does KID Do?
KID consolidates all vital market metrics into a single, glanceable dashboard—saving screen space and analysis time. Whether you are screening equities or monitoring open positions, the KID panel updates dynamically, highlighting actionable signals and market conditions based on your own thresholds and trading style.
🛠 Key Features
⦿ Volatility and Range Metrics
ADR (Average Daily Range, % and Value): Quantifies average price movement over a defined period, with threshold-based color highlights.
ATR (Average True Range, % and Value): Measures volatility as both value and percentage of price.
⦿ Relative Strength and Trend Metrics
Relative Strength (RS) vs. Benchmark: Dynamically calculated using a customizable comparative symbol (default: NSE:NIFTYMIDSML400).
IBD-style RS Rating: Weighted average of price changes over several periods (3, 6, 9, and 12 months).
Trend Detection: Uses Supertrend indicator to visually identify up/down market trends.
⦿ Liquidity and Volume Analysis
Relative Volume (RVol): Comparison of current volume to moving average volume.
Turnover (in Cr): Average turnover calculation to assess liquidity.
Market Cap & Free Float: Real-time computation using price and outstanding/floating shares.
⦿ Trend Strength and Structure
MA Extensions: Compares price extension from a selected moving average, depicted as ATR multiples and percentages.
Moving Averages (MAs): Choice of EMA/SMA with customizable lengths, including up to four plotted MAs and detection of MA crossovers.
⦿ Breakout and Tightness Detectors
52-Week High/Low: Calculates and optionally marks the highest and lowest prices over 252 trading days, including percentage distance from current price.
Minervini Trend Template: The Trend Template is a set of technical criteria designed to identify stocks in strong uptrends.
• Price > 50-DMA > 150-DMA > 200-DMA
• 200-DMA is trending up for at least 1 month
• Price ≥ 52-week high proximity
• Price is at least 30% above its 52-week low.
• Price is within at least 25 percent of its 52-week high
• Table highlights when a stock meets all above criteria.
Tightness Indicator: Highlights periods with compressed price action relative to historical ranges.
⦿ Candlestick Patterns and Power Bars
Inside Bar Detection: Color- and shape-based highlighting of "inside bars" for pattern traders.
PowerBar (Purple Dot): Flags bars with strong price movement paired with high volume, using ROC and volume thresholds.
⦿ Sector/Industry
Automatically reflects symbol sector and industry if available from trading platform data.
⚙️ Customizable Visualization
Switchable between vertical or horizontal layout.
Works in dark/light mode
User-configurable to toggle any indicator ON or OFF.
User-configurable Moving (EMA/SMA), Period/Lengths and thresholds.
🔔 Built-in Alerts
Supports automatic alert creation for:
ADR%, ATR/ATR %, RS, RS Rating, Turnover
Moving Average Crossover (Bullish/Bearish)
52-Week High/Low
Inside Bars (Bullish/Bearish)
Tightness
Minervini Trend Template
⏳PineScreener Capabilities
The indicator’s alert conditions act as filters for PineScreener.
Available Screener Filters & Alerts:
Price Filters: Minimum and maximum price cutoffs.
Daily Change Filters: Minimum and maximum daily percent move.
Volatility Filters: ADR% and ATR% thresholds met or exceeded.
Liquidity Filters: Minimum average turnover and relative volume cutoffs.
Momentum/Trend Filters:
• Strong RS/RS Rating
• Uptrend/Downtrend state (Supertrend-based)
• Price extensions (detect overbought/oversold situations quickly)
• Breakout proximity via 52-week high/low alerts
Pattern and Setup Detection:
• Minervini Trend Template
• Inside Bar
• Tightness (compressed/volatility contraction setups)
• PowerBar (High ROC + high volume bars)
• MA crossover or above/below specific MAs
⦿ (Optional) : For horizontal table orientation increase Top Margin to 16% in Chart (Canvas) settings to avoid chart overlapping with table.
⚡ Add this script to your chart and start making smarter trade decisions today! 🚀

WT + Stoch RSI Reversal Combo📊MR.Z RSI : WT + Stochastic RSI Reversal Combo
This custom indicator combines WaveTrend oscillator and Stochastic RSI to detect high-confidence market reversal points, filtering signals so they only appear when both indicators align.
🔍 Core Components:
✅ WaveTrend Oscillator
Based on smoothed deviation from EMA (similar to TCI logic)
Plots:
WT1 (main line)
WT2 (signal line = SMA of WT1)
Uses overbought/oversold thresholds (default: ±53) to filter signals
✅ Stochastic RSI
Momentum oscillator based on RSI's stochastic value
Plots:
%K: smoothed Stoch of RSI
%D: smoothed version of %K
Adjustable oversold/overbought thresholds (default: 20/80)
🔁 Combined Reversal Signal Logic:
🔼 Buy Signal
WT1 crosses above WT2 below WT oversold level (e.g., -53)
%K crosses above %D below Stoch RSI oversold level (e.g., 20)
🔽 Sell Signal
WT1 crosses below WT2 above WT overbought level (e.g., 53)
%K crosses below %D above Stoch RSI overbought level (e.g., 80)
🔔 Signals are only plotted and alerted if both conditions are true.
📌 Features:
Toggle on/off:
WaveTrend lines and histogram
Stochastic RSI
Combined Buy/Sell signals
Horizontal reference lines (±100, OB/OS)
Fully customizable smoothing lengths and thresholds
Signal plots:
✅ Green up-triangle = Combo Buy
✅ Red down-triangle = Combo Sell
Optional: Circle/cross markers for WT-only and Stoch-only signals
🔔 Built-in alerts for Buy/Sell signals
📈 Use Cases:
Reversal Trading: Wait for both indicators to confirm momentum shift
Entry Filter: Use in combination with trend indicators (like EMA)
Scalping or Swing: Works on intraday and higher timeframes

PdH e PdL (Dia Anterior)Simple line that shows with labels the Previous day high and previous day low.

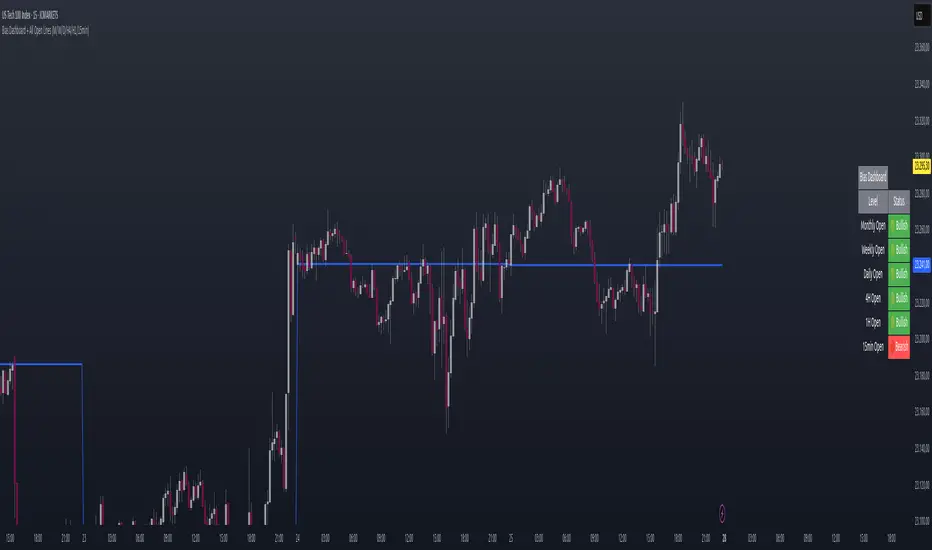
Bias Dashboard + All Open Lines (M/W/D/H4/H1/15min)What does the script do?
This script displays a dashboard that shows the current market bias relative to the open prices of multiple timeframes:
Monthly
Weekly
Daily
4H
1H
15min
Additionally, it plots horizontal lines at each of these open levels on the chart.
How it works
Fetch Open Prices:
The script uses request.security() to get the open prices for each timeframe.
Determine Bias:
Compares the current close price to each open:
If close > open, then "Bullish"
If close < open, then "Bearish"
Display Dashboard:
A visual dashboard shows:
The timeframe label
Whether the current price is above (bullish) or below (bearish) that level
Plot Lines:
Colored horizontal lines are drawn on the chart to indicate each timeframe’s open level.
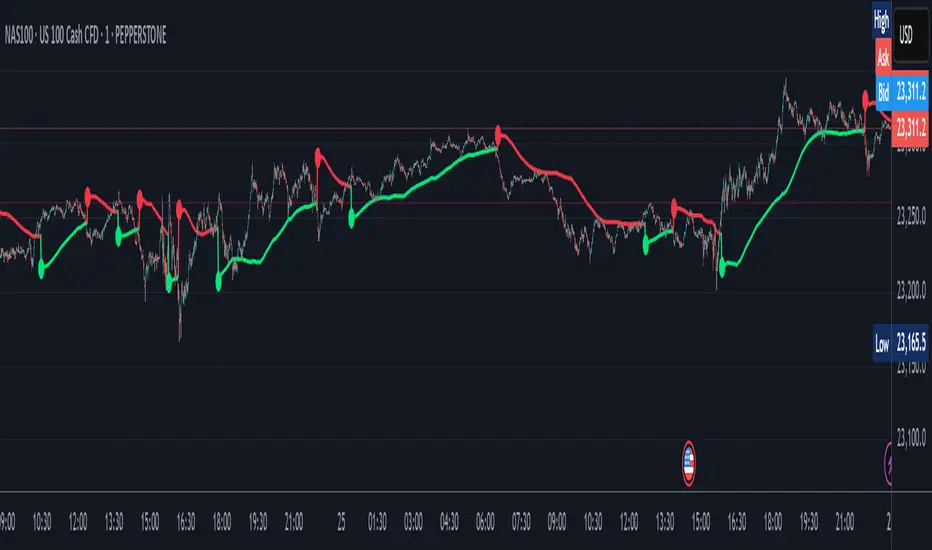
SulLaLuna PO3 Acceleration Tracker### 🚀 **Power of 3 Acceleration Script | Enter the Cave of Wonder 🧙♂️**
> *“When we find the God Candle, we don’t just ride it—we ritualize it.”*
> — The Calzolaio Way
🌕 The **SulLaLuna PO3 Acceleration Tracker** is a tool born from Smart Money theory, built with surgical logic, and forged to ride the **acceleration phase** with confluence and confidence.
Inspired by the teachings of (youtu.be), this indicator captures the moment of explosive expansion—the candle after the manipulation wick, the price action spark that ignites the trend.
---
### ⚔️ The PO3 Framework (ICT)
* **Accumulation** – Compression, trap laid
* **Manipulation** – Liquidity taken, fakeouts triggered
* **Expansion** – God Candle. This is where we enter.
This script automatically detects that exact **post-manipulation acceleration** candle and plots:
* ✅ TP/SL based on risk-reward
* ✅ Dynamic trend dashboard (15m to 1D)
* ✅ Long/Short trade markers
* ✅ Custom alerts and dashboard positioning
---
### 🔁 **Use Confluence**
> ⚠️ *No entry should ever be made on one signal alone.*
For optimal precision, pair this script with a **trend-strength and momentum filter**.
I personally use (), a brilliant tool that dynamically adapts to volatility and momentum changes using a responsive EMA and wave strength logic. It's CC BY-NC-SA 4.0 licensed and adds serious edge in distinguishing true trends from false breaks.
💡 Look for PO3 entries that align with:
* ✅ Bullish dominance in trend speed
* ✅ Dynamic EMA slope support
* ✅ MTF Trend agreement on the SulLaLuna dashboard
---
### ✨ The Cave of Wonder
This is more than just a script—this is your **map**.
The Cave of Wonder isn’t a place, it’s a **process**. Each PO3 entry is a torch lighting the path deeper into the vaults of financial freedom.
When you use this with **discipline**, **data**, and **divine timing**, you don't just take trades.
You take **territory**.
---
### 🔗 Try It. Trade It. Ritualize It.
🛠️ Built by @Calzolaio
🎓 Based on PO3 by @TheMovingAverage
📊 Powered by trend confluence from @Zeiierman
> “Capture the Acceleration. Honor the Trend. Trade with the Moon.” 🌕

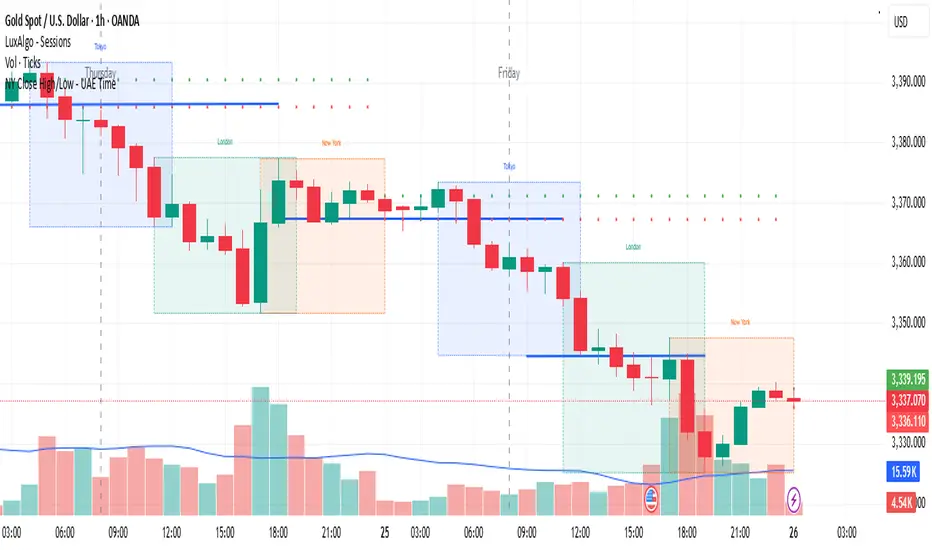
NY Close High/Low - UAE Time📌 Indicator Name:
New York Session Close High/Low – UAE Time
📄 Description:
This indicator automatically marks the high and low of the New York trading session closing candle, based on UAE local time (Asia/Dubai).
🕒 Time Logic:
The New York session closes at 5:00 PM EST, which corresponds to 1:00 AM UAE time (next day).
The indicator captures the 12:00 AM to 1:00 AM UAE time candle, which represents the final hour of the New York session.
✅ Features:
Marks the high and low of the NY close candle.
Updates dynamically each day.
Lines are plotted using UAE local time (Asia/Dubai).
Works on most timeframes (recommended: 1H or higher).
📈 Use Cases:
Identify key liquidity zones at the NY session close.
Use as support/resistance or breakout reference.
Combine with your existing trading strategy for precision entries.
Pivot Squeeze StrategyStrategy based on Pivot Squeeze Oscillator Indicator for backtesting.
Features:
- Pivot Lookback adjustment
- Trade Both Directions, Long Trades Only, Short Trades Only
- Use Pivot Divergence Breakout logic, Pivot Divergence MA Cross Zero logic, or Pivot Divergence MA Cross Slow MA logic
- Adjustments for Breakout Threshold
- Risk Management (Stop Loss/Take Profit/etc)
- Visual Information
- Backtesting Period customization

Custom Opening TimesThis indicator displays custom opening levels on your chart. Define multiple opening times, each with its own customizable style. Display these levels as horizontal lines at the opening price, or as vertical lines to mark the opening time.
Custom Opening Times
4 Independent Groups with 4 custom opening levels each
Set any custom opening time (displayed in New York Local Time)
Choose between Opening Price lines, Vertical time markers, or Both
Cutoff Times: Stop extending lines after specified times
Higher Timeframe Levels
5 Configurable HTF levels supporting any timeframe
Display opening prices from Daily, Weekly, Monthly, Quarterly, and custom timeframes
Show Previous High/Low levels from higher timeframes

Infalible SL y TP estrategy
**🔥 Professional Trend-Following Strategy with Dynamic Risk Management**
#### 📈 **Key Features**
✅ **High-Probability Entries:** Uses **ADX > 25** to trade only strong trending markets.
✅ **Smart Stop Loss:** Dynamic **2x ATR** trailing stop to adapt to volatility.
✅ **2:1 Risk-Reward:** Take Profit levels set at **2x SL distance** for consistent gains.
✅ **Real-Time Visuals:** Auto-updating TP/SL lines and entry markers.
---
#### 🛠 **Indicators Used**
1. **SMAs (14 & 28):** Classic crossover for entry signals.
2. **ADX (14):** Filters trades in strong trends (ADX ≥ 25).
3. **ATR (14):** Calculates stop loss distance (2x ATR).
---
#### ⚙ **Recommended Settings**
- **Markets:** Forex, Crypto, Trending Stocks.
- **Timeframes:** 15min - 4H (day trading) or Daily (swing trading).
- **Customizable:**
- `ATR Multiplier` (default: `2.0`).
- `Risk-Reward Ratio` (default: `2:1`).
---
#### 📉 **Entry/Exit Rules**
🔹 **LONG:**
- When **SMA(14) crosses ABOVE SMA(28)** + **ADX ≥ 25**.
- **SL:** Entry price - (2 x ATR).
- **TP:** Entry price + (4 x ATR).
🔹 **SHORT:**
- When **SMA(14) crosses BELOW SMA(28)** + **ADX ≥ 25**.
- **SL:** Entry price + (2 x ATR).
- **TP:** Entry price - (4 x ATR).
---
#### 🎨 **Clear Visualization**
- Fast SMA (blue) & Slow SMA (red).
- Live TP (green) and SL (red) levels.
---
#### 💡 **Why This Works**
✔ **Fewer False Signals:** ADX filter avoids choppy markets.
✔ **Adaptive Risk:** ATR-based SL adjusts to volatility.
✔ **Professional-Grade:** Strict 2:1 risk-reward discipline.
---
#### 📢 **Backtest & Optimize!**
👉 **Tip:** Tweak `ATR Multiplier` for different assets (e.g., 1.5 for forex, 3 for crypto).
👉 **Pro Tip:** Use TradingView’s **Strategy Tester** to optimize parameters.
📌 **Want a Trailing Stop or Volume Filter? Comment below!**
---
🔹 **Disclaimer:** Past performance ≠ future results. Always backtest before live trading.
---
### 🌟 **Like & Follow for More Advanced Strategies!** 🌟

S&D DirectionThis indicator displays the most recent candle close direction for up to five custom timeframes, as selected in the settings. For each chosen timeframe, it shows whether the last confirmed candle close was bullish (close above the previous high) or bearish (close below the previous low). The indicator labels each timeframe in the top right corner, using green text for bullish closes and red for bearish closes. The displayed timeframes can be customized, and the direction (long/short) is clearly shown after each label.

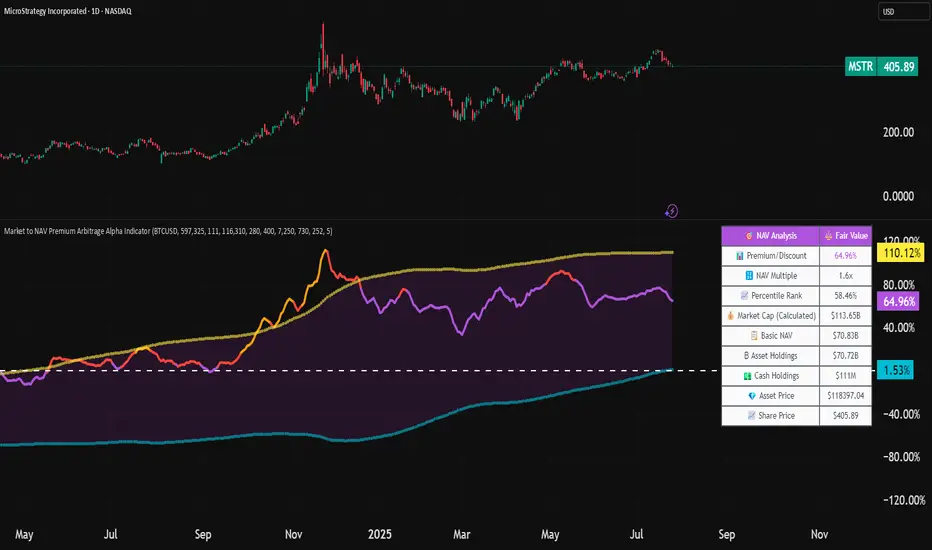
Market to NAV Premium Arbitrage Alpha IndicatorBitcoin treasury companies such as Microstrategy are known for trading at significant premiums. but how big exactly is the premium? And how can we measure it in real time?
I developed this quantitative tool to identify statistical mispricings between market capitalization and net asset value (NAV), specifically designed for arbitrage strategies and alpha generation in Bitcoin-holding companies, such as MicroStrategy or Sharplink Gaming, or SPACs used primarily to hold cryptocurrencies, Bitcoin ETFs, and other NAV-based instruments. It can probably also be used in certain spin-offs.
KEY FEATURES:
✅ Real-time Premium/Discount Calculation
• Automatically retrieves market cap data from TradingView
• Calculates precise NAV based on underlying asset holdings (for example Bitcoin)
• Formula: (Market Cap - NAV) / NAV × 100
✅ Statistical Analysis
• Historical percentile rankings (customizable lookback period)
• Standard deviation bands (2σ) for extreme value detection (close to these values might be seen as interesting points to short or go long)
• Smoothing period to reduce noise
✅ Multi-Source Market Cap Detection
• You can add the ticker of the NAV asset, but if necessary, you can also put it manually. Priority system: TradingView data → Calculated → Manual override
✅ Advanced NAV Modeling
• Basic NAV: Asset holdings + cash.
• Adjusted NAV: Includes software business value, debt, preferred shares. If the company has a lot of this kind of intrinsic value, put it in the "cash" field
• Support for any underlying asset (BTC, ETH, etc.)
TRADING APPLICATIONS:
🎯 Pairs Trading Signals
• Long/Short opportunities when premium reaches statistical extremes
• Mean reversion strategies based on historical ranges
• Risk-adjusted position sizing using percentile ranks
🎯 Arbitrage Detection
• Identifies when market pricing significantly deviates from fair value
• Quantifies the magnitude of mispricing for profit potential
• Historical context for timing entry/exit points
CONFIGURATION OPTIONS:
• Underlying Asset: Any symbol (default: COINBASE:BTCUSD) NEEDS MANUAL INPUT
• Asset Quantity: Precise holdings amount (for example, how much BTC does the company currently hold). NEEDS MANUAL INPUT
• Cash Holdings: Additional liquid assets. NEEDS MANUAL INPUT
• Market Cap Mode: Auto-detect, calculated, or manual
• Advanced Adjustments: Business value, debt, preferred shares
• Display Settings: Lookback period, smoothing, custom colors
IT CAN BE USED BY:
• Quantitative traders focused on statistical arbitrage
• Institutional investors monitoring NAV-based instruments
• Bitcoin ETF and MSTR traders seeking alpha generation
• Risk managers tracking premium/discount exposures
• Academic researchers studying market efficiency (as you can see, markets are not efficient 😉)
10-Day Avg Upside vs Downside VolumeUpside Volume: The total volume on days when the stock closes higher than the previous day.
Downside Volume: The total volume on days when the stock closes lower than the previous day.
It calculates the 10-day simple moving average of both upside and downside volumes.
An optional ratio line is included to visualize relative buying vs selling pressure.
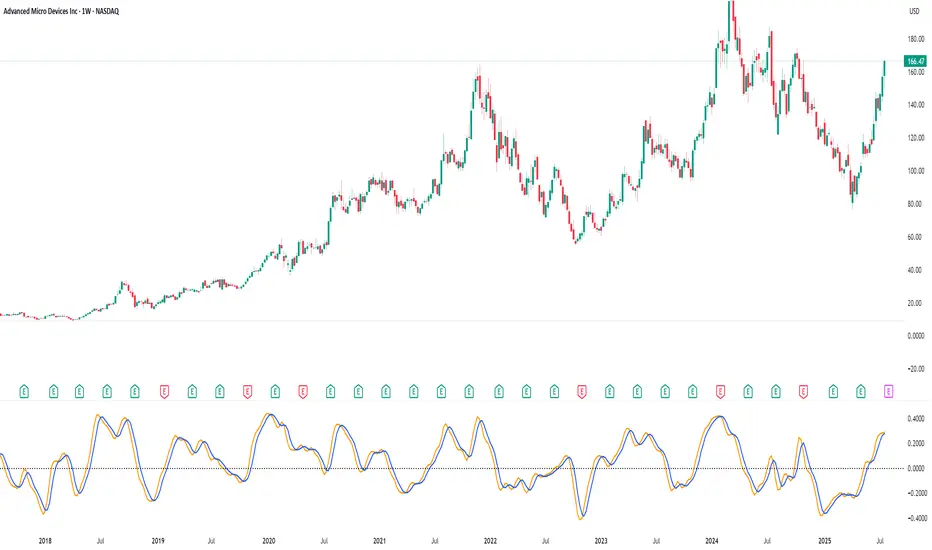
RV Indicator This Pine Script defines a custom Relative Volatility (RV) Indicator, which measures the ratio of directional price movement to volatility over a specified number of bars. Below is a full explanation of what this script does.
Title:
RV Indicator — Relative Volatility Oscillator
Purpose:
This indicator measures how aggressively price is moving compared to recent volatility, and smooths the result with a signal line. It can be used to gauge momentum shifts and trend strength.
How It Works – Step by Step
1. Measuring Price Momentum (v1)
It calculates the difference between the close and open prices of the last 4 candles.
A weighted average is applied:
The current candle and the one 3 bars ago get weight 1.
The two middle candles (1 and 2 bars ago) get weight 2.
This creates a smoothed momentum measure:
If close > open (bullish), v1 is positive.
If close < open (bearish), v1 is negative.
2. Measuring Volatility (v2)
Similarly, it calculates the high-low range for the last 4 candles.
The same weighting (1, 2, 2, 1) is applied.
This gives a smoothed volatility measure.
3. Combining Momentum and Volatility (RV Ratio)
For the past ti bars (default: 10), it sums up:
All v1 values (momentum sum)
All v2 values (volatility sum)
Then it divides them:
𝑅𝑉= sum of price momentum % sum of volatility
This produces the RV value:
RV > 0: Momentum is bullish (price is generally moving up relative to its volatility).
RV < 0: Momentum is bearish (price is moving down relative to its volatility).
4. Smoothed Signal Line (rvsig)
A smoothed version of the RV is created using a weighted average of the latest 4 RV values.
This acts like a signal line, similar to how MACD uses a signal line.
Crossovers between RV and this signal line can be used to detect shifts in momentum.
5. Visual Output
Orange Line (RV): Shows the raw momentum/volatility ratio.
Blue Line (Signal): A smoother line that follows RV more slowly.
Zero Line: Divides bullish vs. bearish momentum.
How to Use It in Trading
1. Look for Crossovers:
If RV crosses above its signal line → Possible buy signal (momentum turning bullish).
If RV crosses below its signal line → Possible sell signal (momentum turning bearish).
2. Check the Zero Line:
If both RV and Signal are above zero, momentum is bullish.
If both are below zero, momentum is bearish.
3. Filter False Signals:
Combine RV with a trend filter (like a 50 or 200 EMA) to avoid trading against the main trend.
Disclaimer: This script is for informational and educational purposes only. It does not constitute financial advice or a recommendation to buy or sell any asset. All trading decisions are solely your responsibility. Use at your own risk.
Swing FX Pro Panel v1Description:
"Swing FX Pro Panel v1" is a professional swing trading strategy tailored for the Forex market and other highly liquid assets. The core logic is based on the crossover of two Exponential Moving Averages (EMA), allowing the strategy to detect trend shifts and generate precise entry signals.
The script includes an interactive performance panel that dynamically displays:
initial capital,
risk per trade (%),
the number of trades taken during a selected period (e.g., 6 months),
win/loss statistics,
ROI (Return on Investment),
maximum drawdown,
win ratio.

EMA 8/21/50 + VWAP Crossover Alert IndicatorOverview of the Indicator
This is a custom Pine Script v5 indicator for TradingView titled "EMA 8/21/50 + VWAP Crossover Alert Indicator" (short title: "EMA+VWAP Cross Alert"). It's designed as an overlay indicator, meaning it plots directly on your price chart rather than in a separate pane. The primary purpose is to detect and alert on crossovers between the 8-period Exponential Moving Average (EMA) and the 21-period EMA, which can signal potential bullish or bearish momentum shifts. These are classic short-term trend reversal or continuation signals often used in trading strategies like momentum or swing trading.
To enhance analysis, it also includes:
A 50-period EMA for medium-term trend context (e.g., to confirm if the overall trend aligns with the crossover).
A Volume Weighted Average Price (VWAP) line, which provides a benchmark for the average price weighted by volume, useful for identifying intraday value areas or fair price levels.
The indicator works across all timeframes (e.g., Daily, 4H, 1H, 15M, 5M, 3M) because the calculations are based on the chart's current bars and adapt to volatility and data resolution. It's not a trading strategy (no entry/exit logic or backtesting), but an alert tool—signals are visual and can trigger notifications in TradingView. Always combine it with risk management, as crossovers can produce false signals in ranging or choppy markets.

Scalper - Pattern Recognition & Price Action🔍 Introducing the Ultimate Scalping Toolkit for TradingView
📊 “Scalper – Pattern Recognition & Price Action”
💥 Unlock precision trading with one of the most advanced Pine Script indicators ever built!
✅ Key Features:
📌 Multiple Moving Averages (SMA, EMA, HMA, VWMA & more) – fully customizable per timeframe
🔍 Candlestick Pattern Detection – from Engulfing & Doji to Morning/Evening Stars and Three Soldiers/Crows
⚡ Smart Price Action Tools – Fair Value Gaps, Order Blocks, Breakout Zones
🧠 Confluence Engine – Aggregates multi-signal zones for high-probability entries
📉 Dynamic Support & Resistance Lines – auto-detected from historical swing points
📈 RSI & CCI Reversal Zones – spot hidden turning points before the crowd
🎯 Perfect for Scalpers, Day Traders & Pattern Hunters
💡 This is not just another indicator — it's a complete trading assistant that identifies structure, signals strength, and simplifies decision-making.
🚀 Plug it into your TradingView chart today and start seeing the market in a whole new way.
👉 DM us for access : t.me

Gann Single Square Swing Trading System with Gann AnglesGann Single Square Swing Trading System
This script automatically detects "squares" - geometric patterns where price movement equals time movement. When price moves the same distance as the number of bars (time), it creates powerful support/resistance levels based on Gann theory.
Key Visual Elements
• Box: The detected square pattern
• Dark Blue Line (50%): Most important trading level
• Green Lines: Profit target levels (125%, 150%)
• Red Lines: Stop loss levels (-25%, -50%)
• Colored Angle Lines: Gann angles for trend direction
• Quality Score: Blue label showing setup strength (aim for 70%+)
Simple Trading Rules
LONG Trades (Green 🟢 Square)
1. Entry: Buy when price touches the dark blue 50% line from above
2. Stop Loss: Place below the red -25% line
3. Take Profit: Exit at green 125% line (first target) or 150% line (second target)
SHORT Trades (Red 🔴 Square)
1. Entry: Sell when price touches the dark blue 50% line from below
2. Stop Loss: Place above the red -25% line
3. Take Profit: Exit at green 125% line (first target) or 150% line (second target)
Entry Checklist
✅ Square quality score > 70%
✅ Price touches 50% level (dark blue line)
✅ Volume above average (if volume filter enabled)
✅ Clear square formation visible
Alerts
The script generates automatic alerts when price reaches the 50% trading level. Enable alerts in TradingView to get notified of setups.
Bottom Line: Wait for the alert → Check quality score → Enter at 50% level → Set stop at red line → Take profit at green line.

Stochastic Z-Score [AlgoAlpha]🟠 OVERVIEW
This indicator is a custom-built oscillator called the Stochastic Z-Score , which blends a volatility-normalized Z-Score with stochastic principles and smooths it using a Hull Moving Average (HMA). It transforms raw price deviations into a normalized momentum structure, then processes that through a stochastic function to better identify extreme moves. A secondary long-term momentum component is also included using an ALMA smoother. The result is a responsive oscillator that reacts to sharp imbalances while remaining stable in sideways conditions. Colored histograms, dynamic oscillator bands, and reversal labels help users visually assess shifts in momentum and identify potential turning points.
🟠 CONCEPTS
The Z-Score is calculated by comparing price to its mean and dividing by its standard deviation—this normalizes movement and highlights how far current price has stretched from typical values. This Z-Score is then passed through a stochastic function, which further refines the signal into a bounded range for easier interpretation. To reduce noise, a Hull Moving Average is applied. A separate long-term trend filter based on the ALMA of the Z-Score helps determine broader context, filtering out short-term traps. Zones are mapped with thresholds at ±2 and ±2.5 to distinguish regular momentum from extreme exhaustion. The tool is built to adapt across timeframes and assets.
🟠 FEATURES
Z-Score histogram with gradient color to visualize deviation intensity (optional toggle).
Primary oscillator line (smoothed stochastic Z-Score) with adaptive coloring based on momentum direction.
Dynamic bands at ±2 and ±2.5 to represent regular vs extreme momentum zones.
Long-term momentum line (ALMA) with contextual coloring to separate trend phases.
Automatic reversal markers when short-term crosses occur at extremes with supporting long-term momentum.
Built-in alerts for oscillator direction changes, zero-line crosses, overbought/oversold entries, and trend confirmation.
🟠 USAGE
Use this script to track momentum shifts and identify potential reversal areas. When the oscillator is rising and crosses above the previous value—especially from deeply negative zones (below -2)—and the ALMA is also above zero, this suggests bullish reversal conditions. The opposite holds for bearish setups. Reversal labels ("▲" and "▼") appear only when both short- and long-term conditions align. The ±2 and ±2.5 thresholds act as momentum warning zones; values inside are typical trends, while those beyond suggest exhaustion or extremes. Adjust the length input to match the asset’s volatility. Enable the histogram to explore underlying raw Z-Score movements. Alerts can be configured to notify key changes in momentum or zone entries.

Momentum 8% 4% 9MMomentum 8% 4% 9M is a simple yet effective visual indicator designed to highlight significant daily price moves and high volume activity on your stock charts.
Features:
Daily Price Move Highlights:
Background turns green when the daily price gain is equal to or greater than 8%, signaling strong bullish momentum.
Background turns red when the daily price drop is equal to or less than -4%, indicating notable bearish moves.
High Volume Marker:
Displays a small yellow upward triangle below the bar on days when the trading volume exceeds 9 million, helping you easily spot volume spikes.
This indicator provides clear visual cues directly on your price chart, making it easier to spot days of unusual market activity without cluttering your chart with excessive labels. It is ideal for traders looking to quickly identify big moves and volume surges for further analysis or trading decisions.
How it works:
The script calculates the daily percentage change from the previous close and compares it with predefined thresholds (8% up, 4% down). Volume is checked against the threshold of 9 million shares. Appropriate background colors and shape markers are then plotted accordingly.
