Heikin Ashi Color Change Alert📈 Heikin Ashi Color Change Alert
This indicator detects color changes in Heikin Ashi candles and issues visual signals and alerts when a change is confirmed at bar close.
🔍 What it does:
Reconstructs Heikin Ashi candles directly from chart prices.
Detects when the color changes from bearish to bullish (or vice versa).
Prints a triangle symbol on the chart when the change occurs.
Allows you to set alerts so you never miss a potential reversal.
✅ How it works:
A bullish signal occurs when a red (bearish) Heikin Ashi candle is followed by a green (bullish) one.
A bearish signal occurs when a green (bullish) candle is followed by a red (bearish) one.
The detection is done only after the current candle is fully closed, ensuring cleaner signals.
🔔 Example Alerts:
"Heikin Ashi candle changed to bullish"
"Heikin Ashi candle changed to bearish"
This indicator is ideal for:
Traders who follow price action
Those who want to filter trends
Anyone who uses Heikin Ashi to smooth market noise and detect reversals
Indicators and strategies

Stochastic Trend Signal with MultiTF FilterIndicator Overview – Multi-Timeframe Stochastic Signal
This custom TradingView indicator combines multi-timeframe Stochastic analysis to generate high-probability, trend-following trading signals. It integrates:
Stochastic on the current timeframe to identify potential entry zones (overbought/oversold).
Stochastic on the 1D (daily) timeframe to confirm short-term trend direction.
Stochastic on the 1W (weekly) timeframe to filter out signals that go against the broader market trend.
🔔 Buy signals are triggered only when:
1D Stochastic > 50 (bullish bias),
Current timeframe Stochastic ≤ 20 (oversold),
After the first bullish candle,
And 1W Stochastic does not contradict the direction (must not be bearish).
🔻 Sell signals are triggered only when:
1D Stochastic < 50 (bearish bias),
Current timeframe Stochastic ≥ 80 (overbought),
After the first bearish candle,
And 1W Stochastic does not contradict the direction (must not be bullish).
The indicator also includes visual highlights:
✅ Green or red background when 1D and 1W trends align clearly.
⚠️ Gray background when 1D and 1W trends conflict — a warning to avoid low-probability setups.
📌 This indicator works best on the 4-hour (H4) timeframe, offering a balanced view between short-term signals and higher timeframe trend filters.

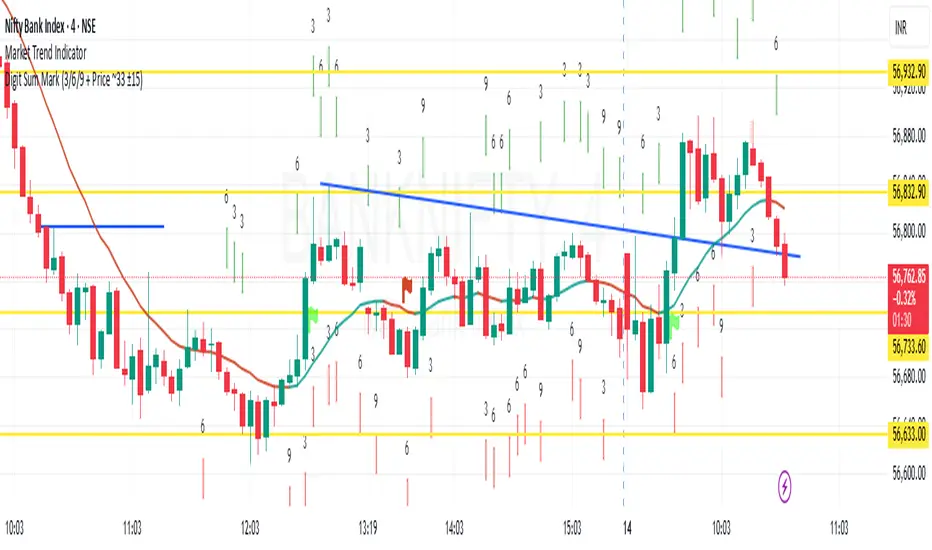
Digit Sum Mark (3/6/9 + Price ~33 ±15)This indicator highlights the price bars where the digit sum of high or low equals 3, 6, or 9, and the closing price is within a specific range (around ₹33 ±15, i.e., mod 100 ∈ ).
✨ Key Features:
Calculates digit sum of high and low values.
Adds +1 if the decimal portion > 0.50 (smart rounding logic).
Only activates when close price mod 100 is between 18 to 48, a zone inspired by the resonance around 33.
Marks the chart with green downward arrows (for high) and red upward arrows (for low) when digit sum = 3, 6, or 9.
📌 Inspired by Gann numerology and price vibration logic – especially the powerful influence of 3, 6, and 9 as noted by Nikola Tesla.
🚨 Best used on intraday or positional charts where price oscillates frequently around round figures.
🧠 Try pairing this with support/resistance tools for better accuracy!
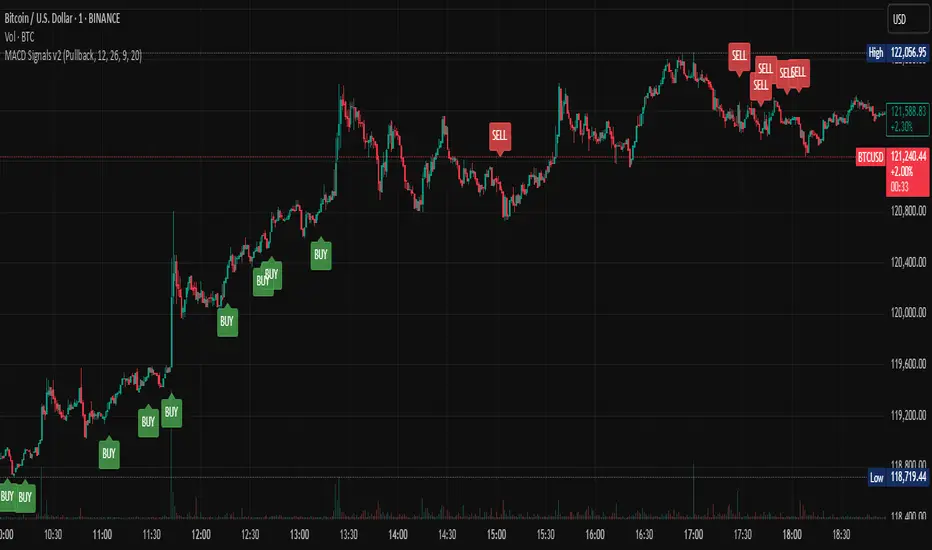
Multi-Mode MACD Signals v2Multi-Mode MACD Signals v2
Signal Types Explained ⚙️
You can now choose your preferred signal from a dropdown menu in the indicator's settings:
Pullback (Default): The original, high-probability strategy. It identifies "buy the dip" and "sell the rally" opportunities within an established trend.
Buy: Triggers on a bullish MACD/Signal line cross above the zero line.
Sell: Triggers on a bearish MACD/Signal line cross below the zero line.
Standard Crossover: The most common MACD signal. It's a pure momentum signal that triggers whenever the MACD line crosses the signal line, regardless of the trend.
Buy: MACD line crosses above the Signal line.
Sell: MACD line crosses below the Signal line.
Zero Line Cross: A trend-change signal. It identifies when the overall momentum shifts from bullish to bearish or vice-versa.
Buy: MACD line crosses above the Zero line.
Sell: MACD line crosses below the Zero line.
How Signals Are Displayed (Real-time vs. Confirmed)
This indicator addresses your request to have signals "display as it occurs" automatically. Here is how it works:
Real-time Alert (As it Occurs): On a live, developing candle, a "BUY" or "SELL" label may appear the instant the MACD conditions are met. This gives you the earliest possible warning.
Signal Repainting: Because the price is still moving within the live candle, the signal may appear and later disappear if the conditions are no longer met by the time the candle closes. This is known as "repainting".
Confirmed Signal: Once the candle closes, the signal is locked in and will never change. This is the confirmed, non-repainting signal.
To create alerts based on these signals, right-click a label on the chart, select "Add alert on Multi-Mode MACD Signals," and choose "Once Per Bar Close" for a confirmed signal or "Once Per Bar" for an earlier, real-time alert.
Customizable ORB BoxCustomizable ORB Box
📘 Description
A powerful and flexible Opening Range Breakout (ORB) visualization tool designed for intraday traders. This indicator plots the opening range using either the first candle or a user-defined custom timeframe, and updates in real time.
🔧 Key Features
First Candle Mode – Plots the high/low range of the first candle of each new trading day.
Custom Timeframe Mode – Builds the ORB box live over a chosen duration (e.g., 5, 15, 30 minutes) and finalizes it after the timeframe completes.
Dynamic Box Colors – Bullish and bearish color themes based on range closure direction.
Multi-Day Plotting – Displays ORB boxes across all days, not just today.
Alerts Included – Triggers when price breaks above or below the ORB range.
No repainting – Stable and historical-friendly behavior.
🕒 ETH Compatibility
This indicator respects your TradingView chart settings:
✅ If ETH is enabled, ORB begins with the first ETH candle.
✅ If ETH is disabled, ORB begins with Regular Trading Hours (RTH).
Tip: Control this via the chart’s ⚙️ “Session” settings for your instrument.
💡 How to Use
Use First Candle Mode for classic ORB strategy setups (quick early structure).
Use Custom Timeframe Mode on smaller timeframes (e.g., 3min) for dynamic range-building.
Combine with volume, VWAP, trendlines, or price action for breakout confirmation.

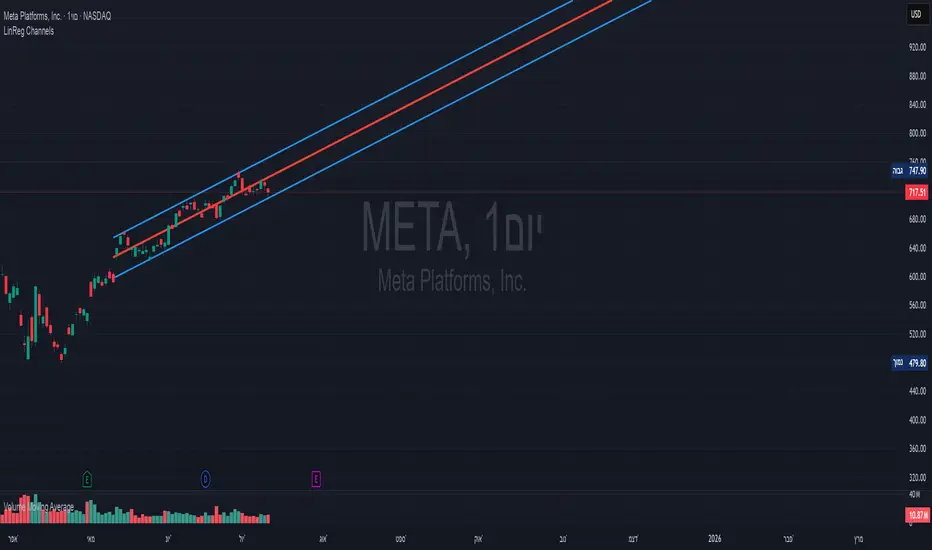
Linear Regression Channels📈 Linear Regression Channels
🌟 Overview
A professional dual linear regression channel indicator designed for comprehensive trend analysis. This powerful tool provides simultaneous short-term and long-term trend perspectives through two independent regression channels with customizable standard deviation bands.
🔧 Core Features
📊 Dual Channel System
Channel 1: 43-period regression analysis for long-term trend identification
Channel 2: 20-period regression analysis for short-term momentum tracking
Independent Configuration: Each channel fully customizable with separate parameters
Real-Time Updates: Dynamic calculations with every new candle
📐 Standard Deviation Bands
Multiple Levels: Configurable deviation bands (1σ, 2σ, 3σ)
Dynamic Support/Resistance: Automatically calculated price levels
Trend Boundaries: Clear visualization of trend strength and direction
Statistical Precision: Mathematically accurate regression calculations
🎨 Customization Options
🎭 Visual Styling
Individual Colors: Separate color schemes for each channel
Line Styles: Choose between Solid, Dashed, or Dotted lines
Line Width: Adjustable thickness (1-5 pixels) for optimal visibility
Extension Options: Project lines into the future for analysis
⚙️ Technical Parameters
Period Length: Fully adjustable lookback periods
Source Selection: Choose from Close, Open, High, Low, or custom sources
Deviation Levels: Customizable standard deviation multipliers
Display Control: Toggle individual channels on/off
📈 Trading Applications
🎯 Trend Analysis
Dual Timeframe Perspective: Simultaneous short and long-term view
Trend Confirmation: When both channels align in direction
Trend Strength: Measured by price position within channels
🔍 Support & Resistance
Dynamic Levels: Standard deviation bands as S/R zones
Channel Boundaries: Natural support and resistance areas
Confluence Trading: Multiple level confirmations
⚡ Entry & Exit Signals
Channel Breakouts: Trend continuation opportunities
Mean Reversion: Trades back to center line
Channel Crossovers: When price moves between timeframes
🚀 Key Benefits
✅ Multi-Timeframe Analysis - Complete market perspective
✅ Mathematical Precision - Least squares regression accuracy
✅ High Customization - Adaptable to any trading style
✅ Clean Interface - Professional chart appearance
✅ Performance Optimized - Smooth real-time operation
✅ Versatile Application - Works on all markets and timeframes
💡 Professional Usage
Combine both channels for confluence signals
Use longer channel for overall trend bias
Trade shorter channel signals within longer trend
Monitor channel width for volatility analysis
Essential tool for traders seeking precise trend analysis and dynamic support/resistance levels.

NY HIGH LOW BREAKNY HIGH LOW BREAK: A New York Session Breakout Strategy
The "NY HIGH LOW BREAK" indicator is a powerful TradingView script designed to identify and capitalize on breakout opportunities during the New York trading session. This strategy focuses on the initial price action of the New York market open, looking for clear breaches of the high or low established within the first 30 minutes. It's particularly suited for intraday traders who seek to capture momentum-driven moves.
Strategy Logic
The core of the "NY HIGH LOW BREAK" strategy revolves around these key components:
New York Session Opening Range Identification:
The script first identifies the opening range of the New York session. This is defined by the high and low prices established during the first 30 minutes of the New York trading session (from 7:01 AM GMT-4 to 7:31 AM GMT-4).
These crucial levels are then extended forward on the chart as horizontal lines, serving as potential support and resistance zones.
Breakout Signal Generation:
Long Signal: A buy signal is generated when the price breaks above the high of the New York opening range. Specifically, it looks for a candle whose open and close are both above the highLinePrice, and importantly, the previous candle's open was below and close was above the highLinePrice. This indicates a strong upward momentum confirming the breakout.
Short Signal: Conversely, a sell signal is generated when the price breaks below the low of the New York opening range. It looks for a candle whose open and close are both below the lowLinePrice, and the previous candle's open was above and close was below the lowLinePrice. This suggests strong downward momentum confirming the breakdown.
Supertrend Filter (Implicit/Future Enhancement):
While the supertrend and direction variables are present in the code, they are not actively used in the current signal generation logic. This suggests a potential future enhancement where the Supertrend indicator could be incorporated as a trend filter to confirm breakout directions, adding an extra layer of confluence to the signals. For example, only taking long breakouts when Supertrend indicates an uptrend, and short breakouts when Supertrend indicates a downtrend.
Second Candle Confirmation (Possible Future Enhancement):
The close_sec_candle function and openSEC, closeSEC variables indicate an attempt to capture the open and close of a "second candle" (30 minutes after the initial New York open). Currently, closeSEC is used in a specific condition for signal_way but not directly in the primary longSignal or shortSignal logic. This also suggests a potential future refinement where the price action of this second candle could be used for further confirmation or specific entry criteria.
Time-Based Filtering:
Signals are only considered valid within a specific trading window from 8:00 AM GMT-4 to 8:00 AM GMT-4 + 16 * 30 minutes (which is 480 minutes, or 8 hours) on 1-minute and 5-minute timeframes. This ensures that trades are taken during the most active and volatile periods of the New York session, avoiding late-session chop.
The script also highlights the New York session and lunch hours using background colors, providing visual context to the trading day.
Key Features
Automated New York Open Range Detection: The script automatically identifies and plots the high and low of the first 30 minutes of the New York trading session.
Clear Breakout Signals: Visually distinct "BUY" and "SELL" labels appear on the chart when a breakout occurs, making it easy to spot trading opportunities.
Timeframe Adaptability: While optimized for 1-minute and 5-minute timeframes for signal generation, the opening range lines can be displayed on various timeframes.
Customizable Risk-to-Reward (RR): The rr input allows users to define their preferred risk-to-reward ratio for potential trades, although it's not directly implemented in the current signal or trade management logic. This could be used by traders for manual trade management.
Visual Session and Lunch Highlights: The script colors the background to clearly delineate the New York trading session and the lunch break, helping traders understand the market context.
How to Use
Apply the Indicator: Add the "NY HIGH LOW BREAK" indicator to your chart on TradingView.
Select a Relevant Timeframe: For optimal signal generation, use 1-minute or 5-minute timeframes.
Observe the Opening Range: The green and red lines represent the high and low of the first 30 minutes of the New York session.
Look for Breakouts: Wait for price to decisively break above the green line (for a buy) or below the red line (for a sell).
Confirm Signals: The "BUY" or "SELL" labels will appear on the chart when the breakout conditions are met within the active trading window.
Implement Your Risk Management: Use your preferred risk management techniques, including stop-loss and take-profit levels, in conjunction with the signals generated. The rr input can guide your manual risk-to-reward calculations.
Potential Enhancements & Considerations
Supertrend Confirmation: Integrating the supertrend variable to filter signals would significantly enhance the strategy's robustness by aligning trades with the prevailing trend.
Stop-Loss and Take-Profit Automation: The rr input currently serves as a manual guide. Future versions could integrate automated stop-loss and take-profit placement based on this ratio, potentially using ATR for dynamic sizing.
Volume Confirmation: Adding a volume filter to confirm breakouts would ensure that only high-conviction moves are traded.
Backtesting and Optimization: Thorough backtesting across various assets and market conditions is crucial to determine the optimal settings and profitability of this strategy.
Session Times: The current session times are hardcoded. Making these user-definable inputs would allow for greater flexibility across different time zones and trading preferences.
The "NY HIGH LOW BREAK" is a straightforward yet effective strategy for capturing initial New York session momentum. By focusing on clear breakout levels, it aims to provide timely and actionable trading signals for intraday traders.

High Win Rate XAUUSD Strategy (EMA21 + RSI + Volume MA20)Buy Conditions:
Price above EMA 21
EMA 21 is rising
RSI > 55 and RSI increasing
Close is above EMA 21
Current candle is green (close > open)
Volume > MA20 of volume
Price below EMA 21
EMA 21 is falling
RSI < 45 and RSI decreasing
Close is below EMA 21
Current candle is red (close < open)
Volume > MA20 of volume

ADX GatekeeperADX Gatekeeper is an original strategy that combines three classic filters to improve trend-following accuracy and avoid choppy markets.
Combines RSI, OBV, and ADX filters to catch stronger trends and avoid sideways markets. RSI confirms momentum extremes, OBV confirms volume flow, and ADX filters low-trend conditions. Fully configurable for different market conditions.
RSI Filter: Avoids overbought/oversold traps by requiring RSI < 35 for longs and > 70 for shorts.
OBV Filter: Confirms directional volume with positive OBV changes for longs and negative for shorts.
ADX Filter: Filters out low-volatility sideways conditions by requiring ADX above a configurable threshold (default 45).
The combined conditions aim to identify stronger trend moves while avoiding choppy markets. All filters can be toggled on or off for flexibility.
Default risk: 10% of equity per trade. Users can adjust this.
Ideal for trend traders looking to filter noise and improve entry quality.

Gabriel's Relative Strength IndexGabriel’s RSI—The Reinvention of Relative Strength
Not your average RSI.
This is a fully reengineered Relative Strength Index that merges the power of advanced signal processing, adaptive smoothing, volume dynamics, and intelligent divergence detection into a single, modular toolkit designed for precision trading across all markets.
Whether you’re scalping crypto, swing trading equities, or dissecting futures contracts—Gabriel’s RSI adapts to your strategy with unrivaled control and clarity.
⚙️ 1. RSI Settings
RSI Length (Jurik): Set to 51 by default to mimic a 21-period standard RSI when Jurik smoothing is applied. Adjust lower (e.g., 22) to mimic a 9-period RSI. 32 would be almost ~14, 13.33 RSI.
RSI Source: The default is hlc3 for smoother RSI. Can be changed to any price-based series (close, open, etc.) for customization.
📡 VIX-Aware: Automatically switches to high/low/close during VIX spikes using a custom Z-score model if toggled. (I backtested it, and it catches bottoms better.) 📡
🎯 2. RSI Smoothing Options
MA Type: Smoothing applies to both RSI and its MA overlay simultaneously. I used to use the 56 EMA RSI, and it works well too.
Options: JMA, T3, Kalman, Laguerre, Super Smoother, ALMA, VWMA, LSMA, etc.
JMA: Best for adaptive recursive smoothing. A power of 2 and a phase of 50 are used.
T3: Smooth and lag-reduced, suitable for trend detection. The alpha is 0.7.
SMA + Bollinger Bands: Adds deviation-based envelopes for volatility spotting. BB StdDev: Only relevant if BBs are used. Controls bandwidth for overbought/oversold zones.
MA Length: Affects how smooth or reactive the RSI signal is.
📉 3. MACD Settings
Fast/Slow Length: Defaults (21/81) optimized for smoother MACD with SMA or T3. For Algo trading, EMA/JMA is best.
Signal Length: Shorter (e.g., 2) gives more reactive crossover signals; it can be increased.
Source: Default is close. Close works best for the settings I input. I also tuned some of the other MA types that worked for it.
MA Types: JMA and EMA reduce noise and increase signal generation. Select SMA for simplicity or T3 for trend-following.
Histogram: Bar colors signal strength and trend of MACD directly on your chart.
🔀 4. Directional Movement Index (DMI)
ADX Smoothing: High values (e.g., 100) offer strong trend confirmation with Hann Window smoothing 12, or 14 for either regular RMA or double smoothed.
DI Length: Affects DI+/- sensitivity. 100 ADX - 12/14 DI or 15 ADX - 35 DI are suggested, the latter for quicker boot time, as 100 bars is quite long.
Smoothing Type: Choose Hann Window for refined smoothing; RMA (SMMA) for simplicity. Double-smoothing is RMA -> Hann window, best of both types.
Volatility Type: ATR includes gaps for a full-range volatility; ADR is useful for gapless strategies, particularly OTC markets and intraday.
Plotted as area fills, 0 to 100 scaled.
Color-coded as Red (ADX), Orange (DI-), Blue (DI+).
📊 5. Volume Z-Score
%R Length: Normalizes volume to percentile range (73 swing, 112 exhaustion).
Z-Score Lengths: Compares short-term and long-term volume trends with Z-scores of volume.
Fast Z-Score < Slow Z-Score = Gives a Volume Squeeze.
Fast MA > Slow MA = Bullish Volume Divergence; volume has been fired. Not via Z-score, but instead via SMA, ALMA, and RMA of volume.
WPR Volume: Weighted %R used to highlight exhaustion/pivot points.
Plot volume bars after a volume squeeze has been fired; if bars aren't plotted, then it's under squeeze. Backtest on ES1! Prove it's good for catching bottoms below 15 minutes as well.
🧠 6. Divergence Engine
Pivot Settings: Pivot Period (12), Divergence minval Lookback (5), and max Lookback Bars (100) control sensitivity. Works well on any asset class; these are the optimal settings for the RSI.
Source Options: RSI, MACD, ADX, DI difference, or Volume %R.
Divergence Types: Regular (Mean Reversal), Hidden (Trend Continuation).
Heikin Ashi Mode: Enables use of HA candles on normal charts for smoother pivots. May distort values if your chart is H.A. so leave it unchecked then.
💥 7. Squeeze Momentum System (SQZMOM PRO)
Squeeze Types:
⚫ Wide (Black) — Regular Compression
🔴 Normal (Red) — Standard squeeze
🟡 Narrow (Yellow) — Golden squeeze
🟣 Very Narrow (Purple) — Extreme compression
🟢 Fired (Green) — Fired Squeeze = Breakout
Plotted on the very bottom of my indicator.
Momentum Bars:
🔷 Cyan = Rising
🔵 Blue = Pullback
🔴 Red = Falling
🟡 Yellow = Corrective
Plotted on the top of my indicator.
Reversal Signals: Dashed lines on momentum–JMA crossovers (DM-style pivot logic) ploted directly on the chart.
📈 8. Rate of Change (RoC)
RoC of Momentum: EMA-smoothed RoC on momentum for leading signals. Double smoothed, once and then another time for smoother signals.
RoC of Momentum → EMA → EMA → JMA Signal.
Signal Line: JMA used to filter noise and generate reversal signals.
Crossovers: Bullish/bearish signals based on RoC vs. signal line are plotted as triangles directly on your chart.
Optimized: Backtested for short-term setups like 1H or faster. Works on Daily timeframes as well for Futures and 24/7 Markets.
🕰️ 9. Multi-Timeframe Squeeze Settings
Each timeframe (Hourly, 4H, Daily, Weekly, Monthly) has:
Reversal Toggle: Enables dashed line DM-style pivots on crossovers.
MA Length: For Jurik MA smoothing on momentum.
BB/KC Thresholds: Define squeeze sensitivity per timeframe. A shorter BB/KC length, 17-14-12, responds better on lower timeframes.
Momentum Length: Tailors oscillator responsiveness; 20 is ideal.
🧮 10. BB Std. Deviation Scaling
Low-Pass Super Smoother : Smooths noise for BBs.
High-Pass Butterworth : Extracts cycles for BB Stdv. blend.
Root Mean Squared : Dynamic BB width adjustment based on market activity. True-range-based.
LP -> HP -> RMS -> Bollinger Band Multiplier (2.0)
Optional Intensify: Increases the squeeze rate * 4. Can be used for some option pricing strategies.
🧵 11. Moving Average Ribbon
4 optional MAs with full customization:
Choose from 13 MA types (incl. Kalman, Laguerre, T3, ALMA)
Color-coded for trend analysis (MA1–MA4 mimicking 9/21/50/200 periods)
Optional crossover alerts
🔔12. Alerts
RSI: Overbought/oversold reversals. Several types. (🦅 / 🕊️)
MACD: Histogram shift through zero line. (🐘 / 🐴)
DMI/ADX: Crossovers and strength conditions. The key level is the level where if DI/ADX is past this threshold, then it's considered to be trending. (🐬 / 🐋 / 🛡️)
Volume: Smart Money alerts on low-volume zones. May concentrate on ICT sessions. (🚨)
Squeeze: Alerts on all 5 squeeze states. (⚫, 🔴, 🟡, 🟣, 🟢)
Momentum: Momentum / JMA crosses and reversals. (🐂 / 🐻)
RoC: Bullish and bearish crosses. (📈 / 📉)
Divergences: Regular, hidden, and combined. (🐂 / 🐻 / 🐾 / 🐼)
MA Ribbon: Cross alert (⚔️)
VIX: VIX Z-Score past 2.0 (🏴☠️)
📊 13. Visual Output Summary
RSI Line + MA + Optional BB
MACD Histogram (Color Adaptive)
DMI/ADX Area Fills
%R Volume Bars (Smart Money)
Squeeze Dots (Circles)
Momentum Bars (Squares)
RoC Arrows (Cross Signals)
Pivot Break Lines (Dashed)
Auto-Divergence Lines & Labels
MA Ribbon Overlay (Optional)
✅ Best Practices ✅
Watch the slope of the RSI for pullbacks on a strong trend. Combine it with squeeze for exit timing.
Combine RSI Divergence with MACD histogram cross and Squeeze firing for precise entry.
Use Volume Z-Score to filter for institutional activity, and enter Long. Watch for reversals as well.
Watch RoC crossovers for fast, leading signals.
Enable Reversal Lines on 1H+ charts for breakout or breakdown pivots.
Use multi-timeframe thresholds for swing confirmation. The TFs I use the most are 2-5-15 minutes for futures and swinging with 1 hour daily and weekly. Those are the TFs I backtested.
An optional MA Ribbon is here as well; it supports 13 MA types.
🌎 Asset-Agnostic
MACD Automatically adjusts for Crypto, Forex, Stocks, Commodities, and Indices.
Custom ALMA, T3, Kalman, and Laguerre filters optimized per asset class and timeframe.
📚 Tech Highlights
Over 15,000 lines of modular, structured Pine Script v6 code.
Integration of Ehlers Cycle Theory and various other filters, one for each indicator.
Designed for visual clarity, multi-dimensional signal stacking, and low lag/high accuracy.
🌀 All 64 outputs are filled, so there might not be any more future updates. It's also a bit slow to load due to that.

EdgeXplorer - Mitigation SignalsEdgeXplorer – Mitigation Signals
Trade structure. React with precision. Trail with logic.
EdgeXplorer – Mitigation Signals is a precision tool designed to help traders visually identify mitigation zones in price action — areas where liquidity is swept, structure shifts, and opportunities appear. Using smart detection logic, this script plots high-probability bullish or bearish zones, provides TP/SL range guidance, and includes a built-in trailing stop system — all while coloring candles dynamically for cleaner trend recognition.
This is for traders who trust the story behind the candle — not just the candle itself.
⸻
🔍 What It Does
This script detects and maps mitigation blocks, entry zones, targets, and dynamic stops based on key price action structures. You get:
• Real-time bullish and bearish mitigation zones
• Average basis line inside zones (optional)
• Auto-calculated take profit (TP) and stop-loss (SL) regions
• Adaptive trailing stop engine
• Full candle coloring override to clarify live trend bias
It’s a visual and logic-based system to simplify complex decisions.
⸻
⚙️ How It Works
1. Mitigation Signal Detection
It identifies bullish or bearish mitigation signals by analyzing recent wick and close structure. When a breakout fakeout occurs (e.g., price sweeps a high/low and closes opposite), a mitigation zone is drawn — marking potential reversal or continuation zones.
2. Zone Boxes + Labels
A colored zone box appears around the structural wick. Inside that zone, a dashed average line can also be shown — acting as a “basis” for break-and-retest or trailing logic.
3. Range Zones for TP/SL
Above or below the mitigation zone, the script draws:
• A range top for profit-taking (ATR-based)
• A range bottom if enabled — great for SL zones or alternate TP levels
4. Trailing Stop System
After a signal is fired, the script deploys a dynamic trailing stop based on ATR and your trend mode:
• Reset on every new signal (more reactive)
• Or only on opposite signal (more committed)
5. Candle Coloring Engine
As long as price stays inside the active move, candles are color-coded (wick and body). If a trailing stop is hit or the zone is breached, the override is removed.
⸻
📊 Inputs & Settings
Setting Description
Zone Width Filter Filters out narrow/weak setups using ATR distance logic
TP/SL Range Zones Show/hide TP (top) and optional SL (bottom) boxes with custom distance
Trailing Stop Logic Choose how and when the trail resets (signal vs inverse signal)
Bull/Bear Toggle Show/hide specific mitigation zone types (bullish/bearish)
Average Line Toggle the median line inside the zone
Candle Coloring Auto overrides candles when a valid move is active
⸻
🧠 Use It For…
• Scalping and Intra-Day Reversals
Quickly spot smart money moves with structural context and follow-through logic.
• Swing Trading Smart Entries
Wait for confirmation, then use the built-in trailing stop to manage trades with less emotion.
• Trend Continuation Filtering
Use the average line and trailing stop to stay in strong moves while filtering noise.
• Break & Retest Traders
Let the zone + average line show you where to re-enter or add with confidence.
⸻
🚨 Built-In Alerts
✅ Bullish Mitigation Signal
✅ Bearish Mitigation Signal
✅ Trailing Stop Flips


OSOK Protection Pad v2.1.2OSOK Protection Pad v2.1.2
The OSOK Protection Pad is a dynamic price action tool designed for active traders seeking precise visual cues for risk management and trade planning. This indicator automatically plots customizable protection pad levels above and below the current price, updating in real time as the market moves. Users can set the pad distance in points and personalize line color, style, and width for both buy (green, above price) and sell (red, below price) pads.
Key features:
Continuously adjusting pad lines that move with the current price, providing instant reference for stop placement or trade entry/exit zones.
Clean, non-intrusive visuals with dotted or solid lines and compact labels, ensuring clarity without obstructing price action.
Simple, intuitive settings panel for quick adjustments to pad distance and appearance.
Ideal for discretionary and systematic traders who want to reinforce discipline and structure in their intraday or swing trading routines.
Add the OSOK Protection Pad to your chart to enhance your risk management and stay visually aligned with your trading plan

Eulers Exponential VolatilityRImplements an approximation to Patrik's Euler's Exponential for BTC
See X @GallantCryptoYT

Japanese Candlestick PatternsCandlestick Pattern Detector – Your Smart Market Insight Tool
Unlock the hidden language of price action with the Candlestick Pattern Detector, an advanced TradingView indicator meticulously crafted to identify powerful candlestick formations in real time. Whether you are a day trader seeking sharp reversals, a swing trader scouting for trend continuations, or an investor who values precise entry signals, this indicator is your indispensable trading companion.
The Candlestick Pattern Detector continuously scans every bar on your chart and highlights over 30 classic and advanced candlestick patterns, including dojis, engulfing candles, hammers, shooting stars, morning stars, evening stars, haramis, and more. Each detected pattern is labeled directly on the chart, providing crystal-clear visual signals without clutter. Customizable settings allow you to choose which patterns to monitor, fine-tune sensitivity, and adjust label colors and styles to match your personal trading aesthetic.
Beyond merely spotting patterns, this indicator empowers traders to understand the psychological forces driving the market. Bullish and bearish signals help you gauge potential trend reversals, momentum shifts, or periods of consolidation. By integrating these time-tested price action signals into your strategy, you gain a powerful edge in anticipating market moves before they unfold.
Key Features:
Detects 30+ popular candlestick patterns in real time
Clear on-chart labels and color-coded signals
Customizable alerts for immediate trading opportunities
Adjustable sensitivity for noise reduction
Perfect for intraday, swing, or long-term trading
Elevate your trading precision and confidence with the Candlestick Pattern Detector. Let the market’s story reveal itself, candle by candle.

🚨 Volume Spike + Bullish CandleDetects volume spikes exceeding the average by a custom multiplier. Optionally filters for bullish candles. Ideal for spotting breakout momentum on intraday charts.


Essa's Sessions IndicatorOverview
This powerful tool is designed to visually map out the key trading sessions: Asia, London, and New York directly on your chart. By highlighting these periods and plotting their respective highs and lows, it helps you identify critical price levels, gauge market sentiment, and pinpoint potential breakout opportunities with ease.
What It Does
Visualizes Key Trading Sessions: Automatically draws colored backgrounds for the Asia, London, and New York sessions to show you exactly when the most important market activity is happening.
Plots Session Highs & Lows: Displays precise horizontal lines for the highest and lowest prices reached during each session, acting as key support and resistance levels.
Dual Timezone Mode: Easily switch between London (GMT/BST) and New York (EST/EDT) timezones with a single click. The indicator automatically adjusts all session times for you, ensuring accuracy no matter where you are.
Interactive & Informative Labels: Hover over any session high or low label to see a detailed tooltip containing:
The exact price level.
The session's price range (calculated in pips or points).
The total daily price range for broader context.
A simple volatility gauge (from "Low Vol 😴" to "High Vol 🔥").
Customizable Alerts: Enable breakout alerts to receive instant notifications the moment the price closes above a session high or below a session low.
Simple, powerful, and highly informative, this indicator is an essential tool for traders looking to build strategies around session-based price action.

💚 Simple RSI by Markking77Jaaneman, ab jo tumhara chart ready hua hai — with SMC Premium Concepts + CHoCH + BOS + OB + FVG aur niche Simple RSI by Markking77 — uske liye ek premium-level indicator description ready ki hai jo aap TradingView mein publish karne ke waqt use kar sakte ho. Ye description professional bhi lagega aur powerful bhi
📈 SMC Premium Concepts + CHoCH + BOS + OB + FVG | Smart RSI by Markking77
🔍 Overview: This premium indicator combines the most effective Smart Money Concepts (SMC) into a clean and powerful tool designed for serious traders. It includes:
✅ Break of Structure (BOS)
✅ Change of Character (CHoCH)
✅ Order Blocks (OB)
✅ Fair Value Gaps (FVG)
✅ Minimal, High-Impact Labels
✅ Smart RSI for Confluence
🎯 Only key BOS/CHoCH points (around 12–13 across chart) are shown to reduce noise and improve decision-making. This avoids clutter and highlights only major structural shifts in the market.

PC UpdatedThis indicator identifies a high-probability breakout setup using a simple but powerful 3-candle formation. It works on lower timeframes (like 5m) and is ideal for scalping or short-term intraday setups.

RSI(2) - Estratégia com 3 filtros e 3 saídas
Entry: RSI(2) < 20 + EMA80 + above-average volume + reversal candle
Exit: Profit at close OR RSI > 70 OR 7th candle

QMC + QM + AO Divergence Strategy | 1:3 RR | H4-H1📊 QMC + QM Signal Alert
📍 Pair: {{ticker}}
🕐 Timeframe: {{interval}}
📈 Direction: {{strategy.order.action}}
🎯 Strategy: QMC + QM + AO Divergence | 1:3 RR
⚠️ Note: AO divergence and QM pattern confirmed. A potential trade setup is detected!
📩 Join the signal group for real-time updates:
👉 t.me/ErgunFX_SignalGroup
