📊 Visual MTF VMA Dashboard🔄️📊 Visual MTF VMA Dashboard🔄️
This powerful multi-timeframe indicator provides a clean, emoji-enhanced dashboard that helps you quickly identify the Variable Moving Average (VMA) trend direction across multiple key timeframes — all in real-time.
🔍 What It Does:
The Visual MTF VMA Dashboard calculates the LazyBear-style VMA on the following timeframes:
📆 Daily
🕰 195 Minutes
🕒 65 Minutes
⏳ 39 Minutes
⏱ 15 Minutes
Each cell in the table shows the current trend:
📈 BULLISH – VMA rising
📉 BEARISH – VMA falling
⚪ NEUTRAL – No change
🎨 Visual Boost:
This feature can be toggled on/off for cleaner visuals.
📌 Customization:
Adjustable VMA Length
Selectable table position: Top Left, Top Right, Bottom Left, Bottom Right
✅ Ideal For:
Multi-timeframe traders
Trend confirmation
Quick-glance analysis without cluttering your chart
Use this dashboard as a high-level trend confirmation tool — designed for simplicity, speed, and visual clarity.
Indicators and strategies

Trend Buy/Sell Fibonacci Range - KLTThe Trend Buy/Sell Fibonacci Range – KLT indicator identifies bullish and bearish trends based on where the closing price is located within a Fibonacci range calculated from the last N candles (default is 10). Instead of analyzing individual candles, this tool takes a broader view of price action using Fibonacci retracement levels across a dynamic multi-candle range.
How It Works:
Range Calculation
The indicator calculates the highest high and lowest low over the last N candles to define the active price range (default: 10 bars).
Fibonacci Levels
Within this range, Fibonacci levels (0.236, 0.382, 0.5, 0.618, 0.786) are dynamically computed. These levels act as internal thresholds to evaluate bullish or bearish pressure.
Trend Identification (via Close Position):
If the closing price is above the 0.618 level, it indicates strong buy pressure → the candle turns green and an upward triangle appears.
If the closing price is below the 0.382 level, it suggests strong sell pressure → the candle turns red and a downward triangle is displayed.
If the close lies between 0.382 and 0.618, the market is considered neutral, and the candle is gray.
Visual Elements:
Colored candles to immediately spot trend conditions.
Triangle signals (optional) for clear Buy/Sell markers.
Fibonacci level lines plotted on the chart for full context (can be toggled on/off).
Customization Options:
Lookback period (number of candles to calculate the range)
Fibonacci threshold levels (upper/lower)
Show/hide arrows and Fibonacci lines
Why Use This Indicator?
This tool is perfect for traders who want a simple visual method to assess trend strength based on price structure, not indicators derived from lagging moving averages. It offers:
Cleaner market structure analysis
Objective trend zones
Customizable sensitivity
Recommended Use:
Works well in conjunction with support/resistance zones, volume, or momentum indicators.
Applicable to any asset class or timeframe.
Credits:
Developed by KLT, combining structure-based logic with Fibonacci precision.

Combined and Count of Bull Bear Alerts for OBV, TDI, CCI, MACDCombined and Count of Bull Bear Alerts for OBV, TDI, CCI, MACD
Description
This powerful indicator combines four popular technical analysis tools (On-Balance Volume, Traders Dynamic Index, Commodity Channel Index, and MACD) into a single comprehensive divergence detection system. It monitors all four indicators simultaneously and provides real-time alerts when bullish or bearish divergences occur across multiple indicators, helping traders identify high-probability reversal opportunities.
Key Features
Multi-Indicator Divergence Detection: Simultaneously tracks divergences in OBV, TDI, CCI, and MACD
Comprehensive Signal Counting: Displays real-time count of bullish (1-4) and bearish (1-4) divergences
Four Customizable Alert Conditions:
Alert 1: 1-4 indicators showing bullish divergence
Alert 2: 3-4 indicators showing strong bullish divergence
Alert 3: 1-2 indicators showing bearish divergence
Alert 4: 3-4 indicators showing strong bearish divergence
Visual Signal Display: Clear numerical indicators showing how many tools are signaling divergence
Customizable Parameters: Adjustable settings for each indicator's sensitivity and display preferences
Overlay Display: All signals shown directly on the price chart for easy analysis
How It Works
The indicator continuously monitors each technical tool for both regular and hidden divergences using pivot point analysis. When a divergence pattern is detected, it increments the appropriate counter (bullish or bearish). The system then displays the total count as colored numbers on the chart and can trigger alerts based on your preferred signal strength thresholds.
Trading Applications
Strong Reversal Signals: Look for 3-4 indicator confirmations for high-probability trades
Early Trend Detection: Use 1-2 indicator signals for early entry opportunities
Confirmation Tool: Validate your trading signals with multi-indicator divergence confirmation
Risk Management: Avoid trading against multiple indicator divergences
Customization Options
Adjustable lookback periods for each indicator
Toggle visibility of bullish/bearish counters
Customizable colors, positions, and display styles
Option to show individual indicator signals
Configurable divergence detection parameters
This indicator is particularly valuable for traders who want to combine multiple technical analysis approaches into a single, easy-to-monitor system that highlights confluence opportunities across different market perspectives (volume, momentum, cycle, and trend).

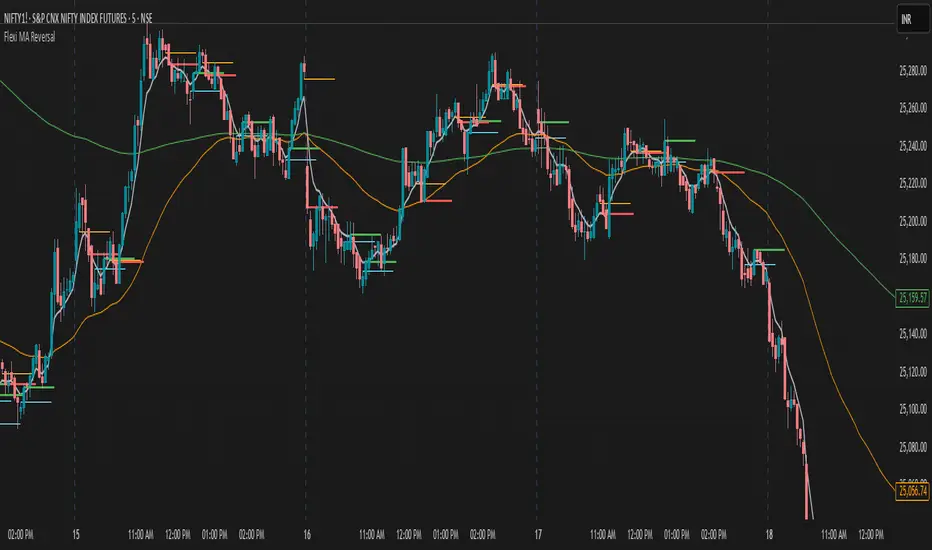
Flexi MA Reversal🔹 FlexiMA Reversal – Customizable MA-Based Reversal Indicator
FlexiMA Reversal is a real-time, moving average-based reversal indicator designed to highlight potential market turning points using signal and alert lines. It provides visual cues for both early alerts and confirmed entry signals on candle close.
🔧 Key Features:
Customizable Moving Average Type: Choose from EMA, SMA, WMA, or VWMA (default is EMA).
Flexible MA Inputs: Configure up to three MAs (commonly used 5, 50, and 200).
Toggle Visibility: Enable or disable each MA line as needed.
Real-Time Alert System:
Thin alert lines appear when a potential reversal is detected.
Thicker signal lines confirm the reversal when price closes beyond the alert level.
Optional Visual Styling:
Choose custom colors for each MA, signal, and alert line.
Alert candles are automatically colored to match the corresponding alert line.
Option to show only signal lines for cleaner charts.
Customizable projection length for both alert and signal lines.
📈 Strategy Logic:
This indicator is designed to detect reversal opportunities based on the relationship between price and a selected short-term moving average.
Bullish Setup:
Price closes below the selected MA (e.g., EMA 5).
A bullish alert line is drawn at the high.
If a subsequent candle closes above the alert line and the MA, a bullish signal line is plotted.
Bearish Setup:
Price closes above the selected MA.
A bearish alert line is drawn at the low.
If a subsequent candle closes below the alert line and the MA, a bearish signal line is plotted.
This approach attempts to capture quick market shifts where short-term momentum reverses direction near key MA levels.
🎯 How to Use:
Although originally developed using the 5 EMA strategy, through testing it was found that using 6, 7, or 8 EMA offers even better signal quality.
To add broader trend context, 50 MA and 200 MA lines are included and can be toggled on/off based on your strategy preference.
🔍 Trend Filtering & Re-Entry Tips:
Due to the nature of shorter moving averages, reversal signals may appear frequently. For better trend alignment:
Use the 50 MA as a trend filter:
❌ Ignore bearish signals when price is above 50 MA
❌ Ignore bullish signals when price is below 50 MA
Alternatively, filtered-out signals can be used for re-entry within the trend:
For example, if you receive a bearish alert and signal above the 50 MA, and the next candle closes back above the bearish alert line, this may be interpreted as a bullish re-entry opportunity into the prevailing uptrend.
🛠️ Styling Tips:
You can disable alert candle coloring in the Style tab of the indicator settings.
Use the "Show Only Signal Lines" checkbox to keep the chart minimalistic while still tracking confirmed entries.
Nasdaq 50-Point ZonesThis indicator has adjustable zone points for any chart, but was built for nasdaq. Minimum point range is 1 point. Can customize line appearance and zone appearance.

Clarix Market DashboardPurpose :
Shows if the market is trending, volatile, or stuck so you can decide when to trade or wait.
How to Use
Add the indicator to your chart. Adjust basic settings like EMA, RSI, ATR lengths, and timezone if needed. Use it before entering any trade to confirm market conditions.
What Each Metric Means (with general ranges)
Session: Identifies which market session is active (New York, London, Tokyo).
Trend: Shows current market direction. “Up” means price above EMA and VWAP, “Down” means price below. Use this to confirm bullish or bearish bias.
HTF Trend: Confirms trend on a higher timeframe for stronger signals.
ATR (Average True Range): Measures market volatility or price movement speed.
Low ATR (e.g., below 0.5% of price) means quiet or slow market; high ATR (above 1% of price) means volatile or fast-moving market, good for active trades.
Strong Bar: A candlestick closing near its high (above 75% of range) indicates strong buying momentum; closing near its low indicates strong selling momentum.
Higher Volume: Volume higher than average (typically 10-20% above normal) means more market activity and stronger moves.
Volume / Avg Volume: Ratio above 1.2 (120%) shows volume is significantly higher than usual, signaling strong interest.
RVol % (Relative Volume %): Above 100% means volume is hotter than normal, increasing chances of strong moves; below 50% means low activity and possible indecision.
Delta: Difference between buying and selling volume (if available). A positive delta means buyers dominate; negative means sellers dominate.
ADX (Average Directional Index): Measures trend strength:
Below 20 means weak or no trend;
Above 25 means strong trend;
Between 20-25 is moderate trend.
RSI (Relative Strength Index): Momentum oscillator:
Below 30 = oversold (potential buy);
Above 70 = overbought (potential sell);
Between 40-60 means neutral momentum.
MACD: Confirms momentum direction:
Positive MACD histogram bars indicate bullish momentum;
Negative bars indicate bearish momentum.
Choppiness Index: Measures how much the market is ranging versus trending:
Above 60 = very choppy/sideways market;
Below 40 = trending market.
Consolidation: When true, price is stuck in a narrow range, signaling indecision. Avoid breakout trades during this.
Quick Trading Reminder
Trade only when the trend is clear and volume is above average. Avoid trading in low volume or choppy markets.

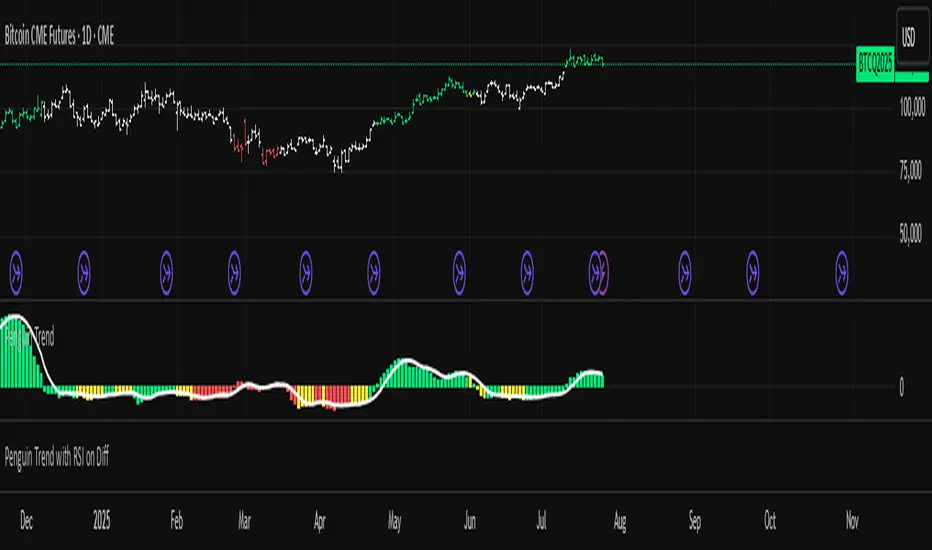
Penguin Trend🐧 Penguin Trend
Overview
The "Penguin Trend" indicator is designed to help traders identify potential breakouts after a period of low volatility or consolidation. It combines the concept of a Volatility Squeeze (Bollinger Bands vs. Keltner Channels) with a MACD-based trend filter to provide higher-probability signals.
---
How It Works
The indicator is based on three core components:
1. Volatility Squeeze:
The histogram bars appear only when volatility expands (the Upper BB moves outside the Upper KC). This event is known as a "Squeeze Release" and signals that the market may be about to make a significant move.
During periods of low volatility or sideways consolidation, the histogram will disappear.
2. Trend & Momentum Filter:
The color of the histogram bars is determined by the MACD and a fast EMA to gauge the direction and strength of the trend.
Lime: Strong Bullish Signal - The trend is up (MACD Cross-up) and short-term momentum is positive.
Red: Strong Bearish Signal - The trend is down (MACD Cross-down) and short-term momentum is negative.
Yellow: Weakening Momentum or Pullback - Indicates that while the primary trend is intact, short-term price is moving against it (e.g., a pullback in an uptrend).
3. Signal Line and Bar Coloring:
White Line: A moving average of the histogram, helping to visualize the general tendency of the volatility expansion.
Bar Coloring: The indicator also colors the price bars on the main chart to match the histogram (Lime, Red, Yellow) but only during a "Squeeze Release". This provides a clear visual cue directly on your chart.
---
How to Use
1. Look for the Squeeze: Identify periods where the histogram is flat (disappeared). This is the market consolidation phase.
2. Wait for the Release: The appearance of the first histogram bar signals that volatility is returning.
3. Confirm with Color:
Lime bars suggest a potential entry for a long position.
Red bars suggest a potential entry for a short position.
Yellow bars serve as a warning of a potential pullback or weakening trend; caution is advised.
Tip: For best results, use this indicator in conjunction with other technical analysis tools like support/resistance levels or volume analysis.
```
[DIP] Double Bollinger BandClassic Bollinger Bands based off of the SMA. Allowing choice between the 2nd and 3rd standard deviation or showing both. By default it is colored such that the 2nd deviation jumps out more while the 3rd deviation lurks in the background for the sake of clarity. For those who are not just satisfied with 2 OR 3 standard deviations, you can now have both.
All deviations have default cross-over and cross-under alerts for easy access, no more messing with which line is which although that is certainly still possible.
Includes a default for "Any alert() function call" condition, if you enable this alert it will trigger for any of the alert conditions when met, this allows you to use one alert instead of 6. The alert will include a message identifying which alert it is, especially useful for watchlist wide alerts.

Volume Weighted Average Pricehelps my strategy and allows my trades to hit tp allowing me to gain profit

My scriptProprietary by Yogesh Bhosale
Supertrend (by KivancOzbilgic)
QQE MOD (by Mihkel00)
UT Bot Alerts (by QuantNomad)
Pivot Reversal Strategy (built-in)
EMA 21 & EMA 200 (built-in Moving Average, set length manually)


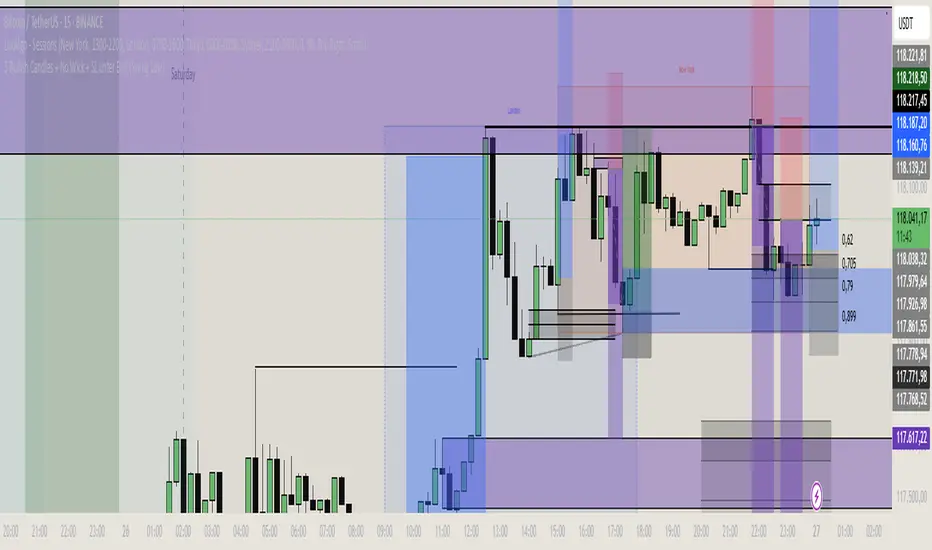
3 Bullish Candles + No Wick + SL unter BoS (Swing Low)1m strategie basierend auf price action and volume candle sticks
Reversal Strategy with MTF S/R, MACD, RSI, Doji + SL/TP + ArrowsHere is a comprehensive Python trading strategy script using 15-minute, 1-hour, and 4-hour support/resistance, combined with MACD, RSI, and Doji candlestick reversal detection. This script uses Pandas, TA-Lib (or ta), and Plotly/Matplotlib for analysis and visualization. Arrows are plotted where Doji reversal patterns occur.
support_1h and support_4h are just emulated by increasing the lookback period (20 for 15m, 80 for 1h, 320 for 4h). Ideally, you should resample the data.
The doji detector is basic but effective for small-body candles.
You can enhance signal confirmation by adding volume, Bollinger Bands, or divergence filters.
To integrate with live trading, use ccxt or your broker's API for real-time data and order execution.

Improved Weinstein Stage AnalysisThe code provides an actionable, disciplined, and visually informative implementation of the “Stage Analysis” approach pioneered by Stan Weinstein, with enhancements to modernize, automate, and clarify the methodology for today’s traders using TradingView. It faithfully follows the workflow recommended: identify long-term cycles, confirm with volume and relative strength, and only engage aggressively with the market during the advancing (bullish) stage with all “clues” aligned.

Sessions with timeframe filter🕒 Smart Timeframe Filtering
This session indicator includes an automatic filter that disables all session boxes when the chart timeframe is greater than the user-defined input. This helps keep higher-timeframe charts clean and focused by hiding intraday sessions when they’re no longer relevant — especially helpful for multi-timeframe traders.
🔍 Features:
📦 Draws up to 3 customizable session boxes with dynamic high/low tracking.
⏱️ Auto-disables on higher timeframes (Smart Timeframe Filter).
🌍 Fully customizable session times, box colors, and time zone (GMT-based).
⚡ Optimized for performance using lightweight, non-overlapping box logic.
👨🍳 UI is organized like a chef’s kitchen: clean, intuitive, and easy to navigate. Settings are grouped and filtered to avoid clutter.
✅ Best Use:
This indicator is most useful for intraday traders on 1m–15m charts.
It’s designed to keep your workspace clean on 30m+ charts or whatever threshold you define.

المتوسط المتحرك الأسي - 3 متوسطاتThe indicator is the same as the exponential moving average indicator, but this one has three averages and is parsed.

PdH e PdL (Dia Anterior)Simple line that shows with labels the Previous day high and previous day low.

Combined Predictive Indicator### Summary
The **Combined Predictive Indicator** is a comprehensive tool designed to provide traders with a multi-faceted view of potential future price action. It merges several well-known analytical concepts into a single, cohesive indicator, helping to identify key levels of support, resistance, and volatility-based price targets.
This script is an amalgamation of two different concepts:
1. A prediction model based on historical range, ATR, and Fibonacci levels.
2. The "Predictive Ranges" concept, which uses an adaptive ATR-based moving average to project dynamic support and resistance zones.
### Key Components
**1. Original Prediction Model:**
* **Bollinger Bands (BB):** Standard volatility bands that help gauge whether prices are high or low on a relative basis.
* **ATR-Based Predicted Range:** A channel calculated using the Average True Range (ATR) and the average historical bar range. This provides a statistically-based estimate of the potential trading range for the next period. The upper band (green) and lower band (red) represent potential bullish and bearish targets.
* **Fibonacci Levels:** Automatically drawn based on the highest high and lowest low over a user-defined lookback period. These classic 0.382 and 0.618 levels act as potential retracement or target zones.
* **HH/LL Markers:** Small triangles appear above or below the price bars to signal a new Highest High (HH) or Lowest Low (LL) within the lookback period, helping to identify shifts in market structure.
**2. Predictive Ranges (PR):**
* This component calculates five dynamic levels based on an adaptive moving average. When the price moves significantly away from the average, the levels recalculate and project new zones.
* **Resistance Levels (PR Upper 1 & 2):** Red zones that indicate potential areas of selling pressure.
* **Support Levels (PR Lower 1 & 2):** Green zones that indicate potential areas of buying pressure.
* **Average (PR Average):** The blue line serves as the centerline or equilibrium point for the ranges.
**3. Data Table:**
* A convenient table is displayed on the top-right of the chart, showing the real-time values of all key predictive levels. This allows for a quick glance without having to hover over the plotted lines.
### How to Use
* **Confluence is Key:** Look for areas where multiple levels from different components overlap. For example, if the `Predicted Upper Range` aligns with a `PR Upper` resistance level and a `Fibonacci` level, it signifies a strong area of potential resistance.
* **Range Trading:** The `Predicted Range` (gray-filled area) can be used to identify the expected volatility. Prices moving outside this range could signal a strong breakout.
* **Trend Confirmation:** Use the `New HH/LL` markers to confirm trend direction. A series of new higher highs and higher lows suggests an uptrend, and vice-versa.
* **Dynamic S/R:** The `Predictive Ranges` are excellent for identifying dynamic support and resistance in trending or ranging markets. Watch for price reactions as it approaches these zones.
### Settings
* **Original Indicators:** Customize the lengths for Bollinger Bands, ATR, and the HH/LL lookback period. Adjust Fibonacci levels if needed.
* **Predictive Ranges:** Adjust the `Length`, `Factor` (multiplier for ATR), `Timeframe`, and `Source` to fine-tune the sensitivity and responsiveness of the PR levels.
*Disclaimer: This indicator is for educational and analytical purposes only. It is not financial advice. Always perform your own due diligence before making any trading decisions.*

Infalible SL y TP estrategy
**🔥 Professional Trend-Following Strategy with Dynamic Risk Management**
#### 📈 **Key Features**
✅ **High-Probability Entries:** Uses **ADX > 25** to trade only strong trending markets.
✅ **Smart Stop Loss:** Dynamic **2x ATR** trailing stop to adapt to volatility.
✅ **2:1 Risk-Reward:** Take Profit levels set at **2x SL distance** for consistent gains.
✅ **Real-Time Visuals:** Auto-updating TP/SL lines and entry markers.
---
#### 🛠 **Indicators Used**
1. **SMAs (14 & 28):** Classic crossover for entry signals.
2. **ADX (14):** Filters trades in strong trends (ADX ≥ 25).
3. **ATR (14):** Calculates stop loss distance (2x ATR).
---
#### ⚙ **Recommended Settings**
- **Markets:** Forex, Crypto, Trending Stocks.
- **Timeframes:** 15min - 4H (day trading) or Daily (swing trading).
- **Customizable:**
- `ATR Multiplier` (default: `2.0`).
- `Risk-Reward Ratio` (default: `2:1`).
---
#### 📉 **Entry/Exit Rules**
🔹 **LONG:**
- When **SMA(14) crosses ABOVE SMA(28)** + **ADX ≥ 25**.
- **SL:** Entry price - (2 x ATR).
- **TP:** Entry price + (4 x ATR).
🔹 **SHORT:**
- When **SMA(14) crosses BELOW SMA(28)** + **ADX ≥ 25**.
- **SL:** Entry price + (2 x ATR).
- **TP:** Entry price - (4 x ATR).
---
#### 🎨 **Clear Visualization**
- Fast SMA (blue) & Slow SMA (red).
- Live TP (green) and SL (red) levels.
---
#### 💡 **Why This Works**
✔ **Fewer False Signals:** ADX filter avoids choppy markets.
✔ **Adaptive Risk:** ATR-based SL adjusts to volatility.
✔ **Professional-Grade:** Strict 2:1 risk-reward discipline.
---
#### 📢 **Backtest & Optimize!**
👉 **Tip:** Tweak `ATR Multiplier` for different assets (e.g., 1.5 for forex, 3 for crypto).
👉 **Pro Tip:** Use TradingView’s **Strategy Tester** to optimize parameters.
📌 **Want a Trailing Stop or Volume Filter? Comment below!**
---
🔹 **Disclaimer:** Past performance ≠ future results. Always backtest before live trading.
---
### 🌟 **Like & Follow for More Advanced Strategies!** 🌟

Combined Time and Price IndicatorThis is what my brain sees. Time slots for good trading hours will colorize candles, green is above yesterday's highs and within the time slot and red is below yesterday's highs and within the time slot I trade

Smart Trend Predictor (EMA + Vol + Volatility)//@version=5
indicator("Smart Trend Predictor (EMA + Vol + Volatility)", overlay=true)
// === Inputs ===
emaFastLength = input.int(20, title="Fast EMA")
emaSlowLength = input.int(50, title="Slow EMA")
volatilityLength = input.int(14, title="Volatility Period")
volumeLength = input.int(20, title="Volume MA Length")
// === Indicators ===
emaFast = ta.ema(close, emaFastLength)
emaSlow = ta.ema(close, emaSlowLength)
volatility = ta.stdev(close - close , volatilityLength)
volumeMA = ta.sma(volume, volumeLength)
// === Signal Conditions ===
buySignal = ta.crossover(emaFast, emaSlow) and volatility > ta.sma(volatility, 14) and volume > volumeMA
sellSignal = ta.crossunder(emaFast, emaSlow) and volatility > ta.sma(volatility, 14) and volume > volumeMA
// === Plot EMAs ===
plot(emaFast, title="Fast EMA", color=color.lime)
plot(emaSlow, title="Slow EMA", color=color.orange)
// === Plot Signals ===
plotshape(buySignal, title="Buy Signal", location=location.belowbar, color=color.green, style=shape.arrowup, size=size.small)
plotshape(sellSignal, title="Sell Signal", location=location.abovebar, color=color.red, style=shape.arrowdown, size=size.small)

CRT Impulse Detector - Bull & BearHelps Identify Impulse Candles, only triggering those that break recent swings.

📊 استراتيجية 5 مؤشرات + تنبيهات//@version=5
indicator("📊 استراتيجية 5 مؤشرات + تنبيهات", overlay=true)
// === المؤشرات الأساسية ===
ema20 = ta.ema(close, 20)
ema50 = ta.ema(close, 50)
sma200 = ta.sma(close, 200)
rsi = ta.rsi(close, 14)
volumeNow = volume
volumeAvg = ta.sma(volume, 20)
// === حساب نقاط القوة ===
bullScore = 0
bullScore += close > sma200 ? 1 : 0
bullScore += ema20 > ema50 ? 1 : 0
bullScore += rsi > 55 ? 1 : 0
bullScore += volumeNow > volumeAvg ? 1 : 0
bearScore = 0
bearScore += close < sma200 ? 1 : 0
bearScore += ema20 < ema50 ? 1 : 0
bearScore += rsi < 45 ? 1 : 0
bearScore += volumeNow > volumeAvg ? 1 : 0
// === نسبة السيطرة ===
bullPercent = (bullScore / 4) * 100
bearPercent = (bearScore / 4) * 100
// === إشارات مؤكدة للدخول ===
buySignal = bullPercent >= 100
sellSignal = bearPercent >= 100
// === رسم الإشارات فقط عند تحقق 100% ===
plotshape(buySignal, title="BUY Signal", location=location.belowbar, style=shape.labelup, text="BUY", color=color.green)
plotshape(sellSignal, title="SELL Signal", location=location.abovebar, style=shape.labeldown, text="SELL", color=color.red)
// === عرض النسبة في لابل (اختياري) ===
label.new(bar_index, high, text="🐂 Bulls: " + str.tostring(bullPercent, "#.##") + "%", style=label.style_label_up, size=size.tiny, color=color.green, textcolor=color.white)
label.new(bar_index, low, text="🐻 Bears: " + str.tostring(bearPercent, "#.##") + "%", style=label.style_label_down, size=size.tiny, color=color.red, textcolor=color.white)
// === التنبيهات ===
alertcondition(buySignal, title="✅ تنبيه شراء", message="🚀 تم دخول الثيران بقوة! فرصة شراء مؤكدة.")
alertcondition(sellSignal, title="⚠️ تنبيه بيع", message="🔥 تم دخول الدببة بقوة! فرصة بيع مؤكدة.")
