Trend-Following Colored Bars w/ SignalsTheTechnicalTraders trendfollowing
Easy way to follow the trend.
Indicators and strategies
Multi-TF S/R Lines by Pivots - 15min Chart//@version=5
indicator('Multi-TF S/R Lines by Pivots - 15min Chart', overlay=true, max_lines_count=32)
// تنظیمات کاربری
pivot_lookback = input.int(5, 'تعداد کندل دو طرف پیوت')
search_bars = input.int(200, 'تعداد کندل چکشونده در هر تایمفریم')
line_expire = input.int(40, 'حداکثر کندل بیتست تا پنهان کردن سطح')
h4_color = color.new(color.teal, 0)
h1_color = color.new(color.green, 0)
d1_color = color.new(color.blue, 0)
w1_color = color.new(color.red, 0)
plot_labels = input.bool(true, 'نمایش لیبل')
label_size = input.string('tiny', 'سایز لیبل', )
var float w1_pivothighs = array.new_float(0)
var float w1_pivotlows = array.new_float(0)
var float d1_pivothighs = array.new_float(0)
var float d1_pivotlows = array.new_float(0)
var float h4_pivothighs = array.new_float(0)
var float h4_pivotlows = array.new_float(0)
var float h1_pivothighs = array.new_float(0)
var float h1_pivotlows = array.new_float(0)
//----------------------
// تابع پیوتی (true اگر کندل مرکزی، پیوت سقف/کف باشد)
pivot(cF, length, dir) =>
// dir = 'high' یا 'low'
var bool isP = true
for i = 1 to length
if dir == 'high'
isP := isP and cF > cF and cF > cF
if dir == 'low'
isP := isP and cF < cF and cF < cF
isP
// جمعآوری پیوتها در تایمفریم انتخابی
get_pivots(tf, bars_limit, look, dir) =>
var float pivs = array.new_float(0)
pivs := array.new_float(0) // reset each call: همیشه آخرین ۲۰۰ کندل
h = request.security(tf, 'high', high)
l = request.security(tf, 'low', low)
arr = dir == 'high' ? h : l
// فقط کندلهای وسط برگردد (نه اول و آخر)
for i=look to (bars_limit - look)
if pivot(arr, look, dir)
array.unshift(pivs, arr )
pivs
// بروزرسانی آرایه پیوتها (آخرین سطوح)
if barstate.islastconfirmedhistory
w1_pivothighs := get_pivots('W', search_bars, pivot_lookback, 'high')
w1_pivotlows := get_pivots('W', search_bars, pivot_lookback, 'low')
d1_pivothighs := get_pivots('D', search_bars, pivot_lookback, 'high')
d1_pivotlows := get_pivots('D', search_bars, pivot_lookback, 'low')
h4_pivothighs := get_pivots('240', search_bars, pivot_lookback, 'high')
h4_pivotlows := get_pivots('240', search_bars, pivot_lookback, 'low')
h1_pivothighs := get_pivots('60', search_bars, pivot_lookback, 'high')
h1_pivotlows := get_pivots('60', search_bars, pivot_lookback, 'low')
//--------------
// تابع رسم سطح
draw_lines(pivArr, line_color, label_txt, expiry) =>
int count = math.min(array.size(pivArr), 8)
for i=0 to (count-1)
y = array.get(pivArr, i)
// بررسی در 40 کندل اخیر برخورد بوده یا نه؟
touched = false
for c=0 to (expiry-1)
touched := touched or (low <= y and high >= y)
if touched
l = line.new(bar_index-expiry, y, bar_index, y, color=line_color, width=2, extend=extend.right)
if plot_labels
label.new(bar_index, y, label_txt, color=line_color, style=label.style_label_right, textcolor=color.white, size=label_size)
// اگر طی پیشفرض expiry کندل برخورد نشده بود، خط و لیبل رسم نشود (مخفی شود)
// رسم همه خطوط
draw_lines(w1_pivothighs, w1_color, 'W1', line_expire)
draw_lines(w1_pivotlows, w1_color, 'W1', line_expire)
draw_lines(d1_pivothighs, d1_color, 'D1', line_expire)
draw_lines(d1_pivotlows, d1_color, 'D1', line_expire)
draw_lines(h4_pivothighs, h4_color, 'H4', line_expire)
draw_lines(h4_pivotlows, h4_color, 'H4', line_expire)
draw_lines(h1_pivothighs, h1_color, 'H1', line_expire)
draw_lines(h1_pivotlows, h1_color, 'H1', line_expire)

OBV-ROC Tilson Trend (Delta Toggle)Tracks the ROC of Obv via Tilson MA and plots slow and fast obv to see direction change


RSI Overbought ScannerRSI Overbought Scanner
Description
The RSI Overbought Scanner is a Pine Script indicator designed to identify potential overbought conditions across multiple timeframes (1-minute, 5-minute, and 15-minute) using the Relative Strength Index (RSI). This tool is ideal for traders looking to spot stocks or assets that may be overextended to the upside, potentially signaling a reversal or pullback opportunity.
Key Features
Multi-Timeframe Analysis: Evaluates RSI on 1m, 5m, and 15m timeframes to confirm overbought conditions (RSI > 70).
Visual Output: Plots a binary result (1 for overbought, 0 otherwise) for easy integration with TradingView's screener.
Debugging Table: Displays a table in the top-right corner showing RSI values and overbought status for each timeframe, with color-coded indicators (red for overbought, green for not overbought).
Alert Integration: Includes an alert condition that triggers when all three timeframes are overbought, providing a customizable message with the ticker symbol.
How It Works
RSI Calculation: Computes RSI with a default length of 14 for the 1m timeframe and retrieves RSI values for 5m and 15m timeframes using request.security.
Overbought Condition: Checks if RSI exceeds 70 on all three timeframes.
Output: Plots a value of 1 when all conditions are met, otherwise 0. A table updates on the last confirmed bar to show RSI values and overbought status.
Alerts: Triggers an alert when all timeframes are overbought, notifying users of potential trading opportunities.
Usage
Add the indicator to your chart and use it with TradingView's screener to filter assets meeting the overbought criteria.
Customize the RSI length or overbought level (default 70) in the indicator settings to suit your trading strategy.
Set up alerts to receive notifications when the overbought condition is met across all timeframes.
Notes
This script is written in Pine Script v6.
Best used in conjunction with other technical analysis tools to confirm signals.
The table is for debugging and visual confirmation, updating only on the last confirmed bar to avoid performance issues.

SMA Strategy with Re-Entry Signal (v6 Style)*SMA Trend Strategy with Re-Entry Signal (v6 Edition)*
This indicator is based on a classic moving average trend-following system, enhanced with re-entry signals designed for medium to short-term traders.
---
### 📈 Key Features:
1. *Trend Detection Logic:*
- The 30-period SMA (SMA30) is used as the trend filter.
- When the closing price is above the SMA30, the market is considered to be in an uptrend.
2. *Re-Entry Signal:*
- While in an uptrend, if the closing price crosses above the SMA20, a re-entry (add position) signal is triggered.
- These signals are shown with green upward arrows below the bars.
3. *Background Highlighting:*
- Green background: indicates an uptrend.
- Red background: indicates a break below SMA30, suggesting weakening momentum.
4. *Multi-SMA Visualization:*
- Five SMAs are displayed: SMA10, SMA20, SMA30, SMA60, and SMA250.
- This helps visualize both short-term and long-term trend structures.
---
### 🔍 Usage Tips:
- Use this script directly on your main chart to monitor trend direction and wait for re-entry signals during pullbacks.
- Combine with other tools like volume, price action, or candlestick patterns to confirm entries.
---
### ⚠️ Disclaimer:
- This indicator is for educational and informational purposes only. It does not constitute financial advice or a buy/sell signal.
- Avoid relying solely on this script for trading decisions. Always manage your own risk.
---
👨💻 *Developer’s Note:*
This script is 100% manually developed, not copied or auto-generated. It is an original implementation based on my personal trading logic. Suggestions and feedback are welcome!


RAHA - Roni's Adjusted Hybrid AverageRoni's Hybrid Moving Average Oscillator
Each value in the series is weighted inversely to its distance from the mean, meaning that outliers have less impact.
The indicator reduces distortions caused by extreme movements.
More suitable for cases such as volatile stocks.
מתנד הממוצע ההיברידי של רוני
כל ערך בסדרה מקבל משקל הפוך למרחקו מהממוצע כלומר חריגים משפיעים פחות.
האינדיקטור מצמצם עיוותים שנגרמים על ידי תנועות קיצוניות.
מתאים יותר למקרים כמו מניות תנודתיות.

MA Crossover with Asterisk on MA (Fixed)MA 10x20 khi nào tin hiệu cắt nhau xuất hiện màu xanh thì Buy, xuất hiện mày đỏ thì Sell

Ghost Momentum Strategy [SOXL/SOXS Flip]Enter SOXL on a bull then sells on momentum cross and enters into SOXS. Exits SOXS on momentum cross and then enters into SOXL. Keeps doing this. Plug into a platform like traderspost

WCWebhookLibraryLibrary "WCWebhookLibrary"
The webhook message library provides several functions for building JSON payloads
method buildWebhookJson(msg, constants)
Builds the final JSON payload from a webhookMessage type.
Namespace types: webhookMessage
Parameters:
msg (webhookMessage) : (webhookMessage) A prepared webhookMessage.
constants (CONSTANTS)
Returns: A JSON Payload.
method buildTakeProfitJson(msg)
Builds the takeProfit JSON message to be used in a webhook message.
Namespace types: takeProfitMessage
Parameters:
msg (takeProfitMessage) : (takeProfitMessage)
Returns: A JSON takeProfit payload.
method buildStopLossJson(msg, constants)
Builds the stopLoss JSON message to be used in a webhook message.
Namespace types: stopLossMessage
Parameters:
msg (stopLossMessage) : (stopLossMessage)
constants (CONSTANTS)
Returns: A JSON stopLoss payload.
CONSTANTS
Constants for payload values.
Fields:
ACTION_BUY (series string)
ACTION_SELL (series string)
ACTION_EXIT (series string)
ACTION_CANCEL (series string)
ACTION_ADD (series string)
SENTIMENT_BULLISH (series string)
SENTIMENT_BEARISH (series string)
SENTIMENT_LONG (series string)
SENTIMENT_SHORT (series string)
SENTIMENT_FLAT (series string)
STOP_LOSS_TYPE_STOP (series string)
STOP_LOSS_TYPE_STOP_LIMIT (series string)
STOP_LOSS_TYPE_TRAILING_STOP (series string)
EXTENDED_HOURS (series bool)
webhookMessage
Final webhook message.
Fields:
ticker (series string)
action (series string)
sentiment (series string)
price (series float)
quantity (series int)
takeProfit (series string)
stopLoss (series string)
extended_hours (series bool)
takeProfitMessage
Take profit message.
Fields:
limitPrice (series float)
percent (series float)
amount (series float)
stopLossMessage
Stop loss message.
Fields:
type (series string)
percent (series float)
amount (series float)
stopPrice (series float)
limitPrice (series float)
trailPrice (series float)
trailPercent (series float)

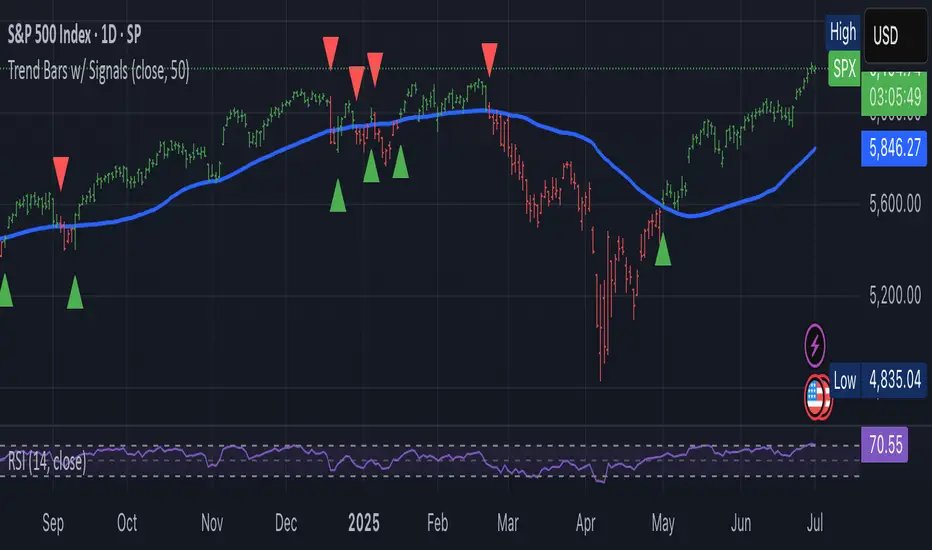
PRO Investing - Apex Engine FREE VERSION🧠 The Apex Engine: True Self-Tuning Intelligence
The biggest flaw in most indicators is that they rely on fixed settings. The Apex Engine solves this with two layers of adaptation:
Fully Auto-Adjustable Parameters: The engine first analyzes the volatility of the asset on your chart to derive its own optimal "Fast," "Mid," and "Slow" momentum lengths. You never have to guess settings again—it tunes itself for any instrument and timeframe.
Performance-Based Selection: It then uses statistical correlation to constantly measure which of its auto-tuned parameters is most in-sync with recent price action. It deploys the "winning" engine to generate signals, ensuring you're always using the most relevant analysis.
🎨 An All-in-One, Unified View
We've engineered this script to deliver maximum information with minimum clutter, all within a single indicator.
High-Confluence Buy/Sell Signals (▲/▼): Clear triangles appear directly on your chart. These are not simple crossovers; a signal is only plotted if it aligns with the dominant trend (above/below the 200MA) and the market is not choppy (ADX > 20).
Compact Oscillator Display: A "lite" version of the oscillator is displayed in a compact panel at the bottom of your price chart, showing the active Velocity line and its signal.
Transparent Dashboard: A small table in the corner shows you the engine's "brain" at work, displaying the real-time correlation scores and highlighting the active parameter.
Smart Background Coloring: The entire chart background changes color to give you immediate context:
🟩 Green: Bullish trend, favorable conditions for buys.
🟥 Red: Bearish trend, favorable conditions for sells.
⬛ Gray: Caution zone. Market is choppy or counter-trend.
This tool is designed to be the ultimate all-in-one solution for traders who value automation, clarity, and adaptive analysis.
If you find this indicator powerful, please leave a Boost 👍 and Follow our Profile for more professional-grade tools.
Disclaimer: All indicators are for analytical and educational purposes only. Trading involves significant risk. Always use your own judgment and risk management.

Volatility Strategy 01a quantitative volatility strategy (especially effective in trend direction on the 15min chart on the s&p-index)
the strategy is a rule-based setup, which dynamically adapts to the implied volatility structure (vx1!–vx2!)
context-dependent mean reversion strategy based on multiple timeframes in the vix index
a signal is provided under following conditions:
1. the vvix/vix spread has deviated significantly beyond one standard deviation
2. the vix is positioned above or below 3 moving averages on 3 minor timeframes
3. the trade direction is derived from the projected volatility regime, measured via vx1! and vx2! (cboe)

IDKFAIDKFA - Advanced Order Blocks & Volume Profile with Market Structure Analysis
Why IDKFA?
Named after the legendary DOOM cheat code that gives players "all weapons and full ammo," IDKFA provides traders with a comprehensive arsenal of market analysis tools. Just as the cheat code arms players with everything needed for combat, this indicator equips traders with essential market structure tools: Order Blocks, Volume Profile, LVN/HVN areas, Fibonacci retracements, and intelligent buy/sell signals - all in one unified system.
Core Features
Order Blocks Detection
Automatically identifies institutional order blocks using pivot high/low analysis
Extends blocks dynamically until price interaction occurs
Bullish blocks (demand zones) and bearish blocks (supply zones)
Customizable opacity and extend functionality
Advanced Volume Profile
Real-time volume profile calculation for multiple session types
Point of Control (POC), Value Area High (VAH), and Value Area Low (VAL)
Mode 1: Side-by-side bull/bear volume display
Mode 2: Overlapped volume display with percentage analysis
Shows buying vs selling pressure at each price level
LVN/HVN Area Detection
Low Volume Nodes (LVN): Areas below VAL where price moves quickly
High Volume Nodes (HVN): Areas above VAH with strong resistance
NPOC (Naked Point of Control): Single print areas within Value Area
Volume-based gradient coloring shows relative activity levels
Smart Fibonacci Retracements
Auto-detects trend direction for proper fibonacci orientation
Dynamic color coding: Red levels in uptrends, Gold in downtrends
Special 88.6% level turns lime green in downtrends
Key levels: 23.6%, 38.2%, 50%, 61.8%, 65%, 78.6%, 88.6%
Intelligent Signal System
Works best on higher timeframes
Identifies high-probability reversal setups at key levels
Buy signals: Large bearish rejection followed by bullish reclaim
Sell signals: Large bullish rejection followed by bearish breakdown
Signals only trigger near significant support/resistance areas
Signal Analysis & Usage Guidelines
Buy Signal Mechanics
The buy signal triggers when:
Previous candle shows significant bearish movement (minimum ATR multiplier)
Current candle reclaims a configurable percentage of the previous candle's range
Price is near a key support level (order blocks, fibonacci, volume levels)
Sell Signal Mechanics
The sell signal triggers when:
Previous candle shows significant bullish movement (minimum ATR multiplier)
Current candle rejects below a configurable percentage of the previous candle's range
Price is near a key resistance level (order blocks, fibonacci, volume levels)
When to TAKE Signals
High Probability Buy Signals:
Signal appears AT or BELOW the VAL (Value Area Low)
Signal occurs at bullish order block confluence
Price is in LVN area below VAL (momentum acceleration zone)
Signal aligns with fibonacci 61.8% or 78.6% support
Multiple session POC levels provide support confluence
Previous session's VAL acting as current support
High Probability Sell Signals:
Signal appears AT or ABOVE the VAH (Value Area High)
Signal occurs at bearish order block confluence
Price is in HVN area above VAH (heavy resistance zone)
Signal aligns with fibonacci 61.8% or 78.6% resistance
Multiple session POC levels provide resistance confluence
Previous session's VAH acting as current resistance
When to AVOID Signals
Avoid Buy Signals When:
Signal appears ABOVE the VAH (buying into resistance)
Price is in HVN red zones (high volume resistance areas)
No clear support structure below current price
Volume profile shows heavy selling pressure (high bear percentages)
Signal occurs during low-volume periods between major sessions
Multiple bearish order blocks exist below current price
Avoid Sell Signals When:
Signal appears BELOW the VAL (selling into support)
Price is in LVN green zones (momentum could continue)
No clear resistance structure above current price
Volume profile shows heavy buying pressure (high bull percentages)
Signal occurs during Asian session ranges without clear direction
Multiple bullish order blocks exist above current price
Volume Profile Context for Signals
Understanding Bull/Bear Percentages:
70%+ Bull dominance at a level = Strong support expected
70%+ Bear dominance at a level = Strong resistance expected
50/50 Split = Neutral zone, less predictable
Use percentages to gauge conviction behind moves
POC (Point of Control) Interactions:
Signals above POC in uptrend = Higher probability
Signals below POC in downtrend = Higher probability
Signals against POC bias require extra confirmation
POC often acts as magnetic level for price return
Trading Strategies
Strategy 1: VAL/VAH Bounce Strategy
Wait for price to approach VAL (support) or VAH (resistance)
Look for signal confirmation at these critical levels
Enter with tight stops beyond the Value Area
Target opposite boundary or next session's levels
Strategy 2: Order Block + Volume Confluence
Identify order block alignment with VAL/VAH
Wait for signal within the confluence zone
Enter on signal with stop beyond order block
Use LVN areas as acceleration zones for targets
Strategy 3: LVN/HVN Strategy
LVN (Green) Areas: "Go Zones" - expect quick price movement through low volume
HVN (Red) Areas: "Stop Zones" - expect resistance and potential reversals
NPOC Areas: "Fill Zones" - price often returns to fill single print gaps
Strategy 4: Multi-Session Analysis
Use Daily/Weekly for major structure context
Use 4H for intermediate levels
Use 1H for precise entry timing
Ensure all timeframes align before taking signals
Strategy 5: Fibonacci + Volume Profile
Buy signals at 61.8% or 78.6% fibonacci near VAL
Sell signals at 61.8% or 78.6% fibonacci near VAH
Use 88.6% level as final support/resistance before major moves
50% level often aligns with POC for confluence
Signal Quality Assessment
Grade A Signals (Highest Probability):
Signal at VAL/VAH with order block confluence
Fibonacci level alignment (61.8%, 78.6%)
Volume profile shows 70%+ dominance in signal direction
Multiple timeframe structure alignment
Signal occurs during high-volume sessions (London/NY)
Grade B Signals (Moderate Probability):
Signal near POC with some confluence
Fibonacci 50% or 38.2% alignment
Mixed volume profile readings (50-70% dominance)
Some timeframe alignment present
Signal during overlap sessions
Grade C Signals (Lower Probability):
Signal with minimal confluence
Weak fibonacci alignment or none
Volume profile neutral or against signal
Conflicting timeframe signals
Signal during low-volume periods
Risk Management Guidelines
Position Sizing Based on Signal Quality:
Grade A: Standard position size
Grade B: Reduced position size (50-75%)
Grade C: Minimal position size (25%) or skip entirely
Stop Loss Placement:
Beyond order block boundaries
Outside Value Area (VAL/VAH)
Below/above fibonacci confluence levels
Account for session volatility ranges
Profit Targets:
First target: Opposite VAL/VAH boundary
Second target: Next session's key levels
Final target: Major order blocks or fibonacci extensions
Credits & Attribution
Original components derived from:
Market Sessions & Volume Profile by © Leviathan (Mozilla Public License 2.0)
Volume Profile elements inspired by @LonesomeTheBlue's volume profile script
Pivot Order Blocks by TradingWolf / © MensaTrader (Mozilla Public License 2.0)
Auto Fibonacci Retracement code (public domain)
Significant enhancements and modifications include:
Advanced LVN/HVN detection and visualization
Bull/Bear percentage analysis for Mode 2/3
Comprehensive alert system with market context
Integrated buy/sell signals at key levels
Performance optimizations and extended session support
Enhanced Mode 2/3 with percentage pressure analysis
Important Disclaimers
This indicator is a technical analysis tool designed for educational purposes. It does not provide financial advice, investment recommendations, or trading signals that guarantee profits. All trading involves substantial risk of loss, and past performance does not guarantee future results. Users should conduct their own research, understand the risks involved, and consider consulting with qualified financial advisors before making trading decisions. The signals and analysis provided are based on historical price patterns and volume data, which may not predict future market movements accurately.
Best Practices
Never trade signals blindly - always consider volume profile context
Wait for confluence between multiple tools before entering
Respect the Value Area - avoid buying above VAH or selling below VAL
Use session context - Asian ranges vs London/NY breakouts
Practice proper risk management - position size based on signal quality
Understand the bigger picture - use multiple timeframes for context
Remember: Like the IDKFA cheat code, having all the tools doesn't guarantee success. The key is learning to use them together effectively and understanding when NOT to take a signal is often more important than knowing when to take one.

TrendBoxThis indicator is called "TrendBox," designed to help traders analyze daily price ranges using several technical indicators. Below is a breakdown of its functionality, purpose, and key components:
Purpose
The script overlays indicators on a chart to assess whether the price is above or below key levels and moving in a trend.
VIX-based expected range (index fund targeted)
- This helps calculate the expected dealers range based on VIX implications. You can expect to see ranges be bought on and sold on. Moving outside this range creates heightened volatility and most of the time a gamma squeeze follows.
VWAP (Volume Weighted Average Price)
- This allows you to understand the mid point or average pricing of the daily session. If you're paying a premium or getting a discount on the daily session.
Daily Market Open
- Identifying the market open price is a key level on a daily session and allows you to identify some level of intraday trend.
Daily 4-period VWMA
- This is a crucial role of our indicator and showing short term time frame bias. Seeing price move over the top of our daily 4 level establishes a short term trend and can be used as a distribution guide, closing positions when we see longer time frame candles close under it. Vice versa for shorting.
It also displays a status box (optional) summarizing whether the price is above or below these levels, helping traders quickly evaluate market conditions.

TTM Squeeze Value OscillatorThis indicator is specifically designed for use with TradingView's Stock Screener, not for chart analysis. It provides numerical values and binary signals that allow traders to efficiently scan stocks for specific TTM Squeeze conditions, momentum patterns, and EMA alignments.
What It Does
The TTM Squeeze Value Oscillator converts the popular TTM Squeeze indicator into a screenable format by outputting specific numerical values and binary signals (1 or 0) that can be filtered in TradingView's screener tool.
Key Features
1. TTM Squeeze Compression Levels
Value 0: Low Compression (Black) - Bollinger Bands inside outer Keltner Channels
Value 1: Mid Compression (Red) - Bollinger Bands inside middle Keltner Channels
Value 2: High Compression (Orange) - Bollinger Bands inside inner Keltner Channels
Value 3: Squeeze Fired (Green) - Bollinger Bands outside Keltner Channels
2. Momentum Analysis
Four distinct momentum conditions based on TTM Squeeze methodology:
Buy Momentum Increasing - Positive momentum growing stronger
Buy Momentum Decreasing - Positive momentum weakening
Sell Momentum Increasing - Negative momentum growing stronger
Sell Momentum Decreasing - Negative momentum weakening
3. EMA Stacking Analysis
Three EMA alignment patterns using 8, 21, and 48 period EMAs:
EMA Stacked Bullish - 8 EMA > 21 EMA > 48 EMA (uptrend alignment)
EMA Stacked Bearish - 8 EMA < 21 EMA < 48 EMA (downtrend alignment)
EMA Mixed - EMAs not in clear bullish or bearish alignment
4. Consecutive Day Counters
Tracks how many consecutive days each squeeze condition has persisted:
Low Compression Days
Mid Compression Days
High Compression Days
Squeeze Fired Days
5. Combined Signal Analysis
Pre-calculated combinations of squeeze conditions with momentum:
All squeeze levels combined with all four momentum conditions
16 total combined signals for advanced screening

RAHA Indicator📈 RAHA Indicator
Roni's Adjusted Hybrid Average
The indicator developed by Aaron Roni Pesach combines an innovative RAHA average - an adjusted hybrid average with smart trend analysis, using additional oscillators in a sophisticated way.
LONG and SHORT signals are given only when:
✅ Technical conditions confirm
✅ And the long-term trend is consistent
RAHA Indicator helps traders identify entry points while filtering out noise and market anomalies.
📈 RAHA Indicator
Roni's Adjusted Hybrid Average
האינדיקטור שפותח על ידי אהרון רוני פסח משלב ממוצע חדשני מסוג RAHA - ממוצע היברידי מתואם עם ניתוח מגמה חכם, באמצעות שימוש במתנדים נוספים באופן מתוחכם.
איתותי LONG ו‑SHORT ניתנים רק כאשר:
✅ התנאים הטכניים מאשרים
✅ והמגמה בטווח ארוך תואמת
RAHA Indicator מסייע לסוחרים לזהות נקודות כניסה תוך סינון רעשים וחריגות שוק.

Hidden Bearish Divergence [1H]Detects Hidden Bearish Divergence on the 1-hour timeframe using RSI. This is the opposite of hidden bullish — it suggests bearish continuation in a downtrend. Price forms a Lower High. RSI forms a Higher High. Suggests bearish continuation (ideal in a downtrend).

ETF Leverage VerificationDo leveraged ETFs really return what they promise?
Do they return the exact 2x or 3x? Or a slightly different multiple?
How much do they deviate from the promised leverage multiples?
Do these deviations impact investors in a positive or negative manner?
These are the questions that I want to answer with this indicator.
The ETF Leverage Verification indicator challenges the conventional understanding of leveraged ETFs by measuring how they actually perform versus their theoretical targets.
Instead of assuming leveraged ETFs perfectly track their target multiple, this indicator quantifies the real-world behavior by comparing the expected returns versus the actual results on every trading day.
Key Features
Measures actual versus expected performance of leveraged ETFs
Tracks deviation patterns across thousands of trading days
Identifies asymmetric behavior in up versus down markets
Quantifies beneficial "cushioning effect" during market declines
Provides statistical summary of performance patterns
Works with any leverage factor (2x, 3x, -1x, etc.)
Compatible with all leveraged ETFs (equity, bond, commodity, volatility)
How to Use the Indicator
Enter the Expected Leverage Factor (default: 2.0)
Select the Base Asset (underlying index, e.g., SPX)
Select the Leveraged Asset (leveraged ETF, e.g., SSO)
Understanding the Results
Green markers: Days when the ETF outperformed its expected multiple
Red markers: Days when the ETF underperformed its expected multiple
Data Table:
Positive Deviations: Count of days with better-than-expected performance
Negative Deviations: Count of days with worse-than-expected performance
Avg Deviation: Average magnitude of deviation from expected returns
Frequency Skew: Difference between beneficial deviations in down vs. up markets
Impact: Overall assessment of pattern benefit to investors
Summary Label:
Percentage of positive deviations in up and down markets
Total sample size for statistical significance
Key Patterns to Look For
Positive Deviation in Negative Days:
This occurs when a leveraged ETF falls less than expected during market declines. For example, if SPX falls 1% and a 2x ETF falls only 1.8% (instead of the expected 2%), this creates a +0.2% deviation. This pattern is beneficial as it provides downside protection.
Negative Deviation in Positive Days:
This happens when a leveraged ETF rises less than expected during market advances. For example, if SPX rises 1% and a 2x ETF rises only 1.9% (instead of the expected 2%), this creates a -0.1% deviation. This pattern reduces upside performance.
Frequency Skew:
The most critical metric that measures how much more frequently beneficial deviations occur in down markets compared to up markets. A higher positive skew indicates a stronger asymmetric pattern that helps long-term performance.
Mathematical Background
The indicator computes the deviation between expected and actual performance:
Deviation = Actual Return - Expected Return
Where:
Expected Return = Base Asset Return × Leverage Factor
The deviation is then categorized into four possible outcomes:
Positive deviation on positive market days
Negative deviation on positive market days
Positive deviation on negative market days
Negative deviation on negative market days
In short, more positive deviations are good for investors.
Please feel free to criticize. I'm happy to improve the indicator.


XAU/USD Lot Size CalculatorThis indicator automatically calculates the optimal lot size for XAUUSD (gold) based on the level of risk the trader wants to take. It is designed for traders using MetaTrader 4 or 5 and helps adjust position size according to the specific volatility of gold. The user can set the percentage of capital they are willing to risk on a single trade, for example 1%. The indicator also takes into account the stop loss level, which can be entered in pips or in dollars, as well as the account size (balance or equity).
Based on these parameters, it calculates the exact lot size that matches the risk amount. It then displays on the chart the recommended lot size, the risk amount in dollars, the pip value for XAUUSD, and a confirmation of the stop loss level. This type of indicator is useful for maintaining disciplined risk management and avoiding position sizing errors, especially on a highly volatile asset like gold.

Faisalvolume pro//@version=6
indicator("Faisalvolume Pro", overlay=false)
// إعدادات
maLength = input.int(20, minval=1, title="Volume MA Length")
highVolumeMultiplier = input.float(1.5, title="High Volume Multiplier")
// بيانات
vol = volume
volMA = ta.sma(vol, maLength)
// شروط
isHighVol = vol > volMA * highVolumeMultiplier
isAboveMA = vol > volMA
// لون العمود
barColor = isHighVol ? color.rgb(18, 163, 42) : isAboveMA ? color.rgb(226, 20, 20) : color.gray
// رسم المؤشر
plot(vol, title="Volume", style=plot.style_columns, color=barColor)
plot(volMA, title="Volume MA", color=color.orange, linewidth=2)

Volume Weighted Average PriceTitle: VWAP with Confirmed Breakout Color Shift
Description:
This is an enhanced Volume Weighted Average Price (VWAP) indicator that dynamically changes color based on confirmed price breakouts above or below the VWAP line.
✅ Green VWAP line indicates a strong bullish move (price has broken above VWAP by at least 0.2%).
🔻 Red VWAP line signals a bearish move (price has dropped below VWAP by at least 0.2%).
⚪️ Neutral gray is used when price is near VWAP without clear breakout confirmation.
Includes optional upper/lower bands based on either standard deviation or percentage distance from VWAP.
Ideal for identifying market bias and confirming momentum shifts in real time.
