London Reversal + LazyAlgoLondon Reversal Strategy with FS Entry
This script detects trend reversals during the London session, following the Asian session, using technical signals based on moving averages, Asian range breakouts, and multi-timeframe trend filters. It includes a system of visual signals and alerts, with customizable Stop Loss and Take Profit levels.
Indicators and strategies

Useful Open Price Lines - Multi-Timeframe SupportDisplay important opening price levels on your chart with this comprehensive indicator.
KEY FEATURES:
✓ Track up to 6 different opening prices simultaneously
✓ Support for intraday time-based opens (any hour:minute)
✓ Higher timeframe opens: Daily, Weekly, Monthly, Quarterly, Semi-Annual, Yearly
✓ Automatic line extension with customizable cutoff
✓ Clean chart option - hide previous day's lines
✓ Full timezone support for global markets
✓ Customizable colors, labels, and line styles
USE CASES:
- Day traders: Track key session opens (Asian, London, NY)
- Swing traders: Monitor weekly and monthly opens
- Position traders: Track quarterly and yearly opens
- Multi-timeframe analysis: See all key levels at once
CUSTOMIZATION:
- Choose any time for intraday opens (00:00 - 23:00)
- Select from multiple timeframes (D, W, M, 3M, 6M, 12M)
- Customize labels, colors, and line styles
- Adjust label offset and size
- Set line extension cutoff time
The indicator is optimized for performance and works smoothly on all timeframes.

EMA HMA ATF Trade SignalThis indicator is designed as a discretionary trading tool to highlight high-quality trade setups across 15-minute and similar intraday timeframes. It uses a multi-layered logic framework combining trend, momentum, structure, and timing filters. It is not meant to fire frequently — its strength is in filtering out noise and emphasizing clean, aligned market moves.

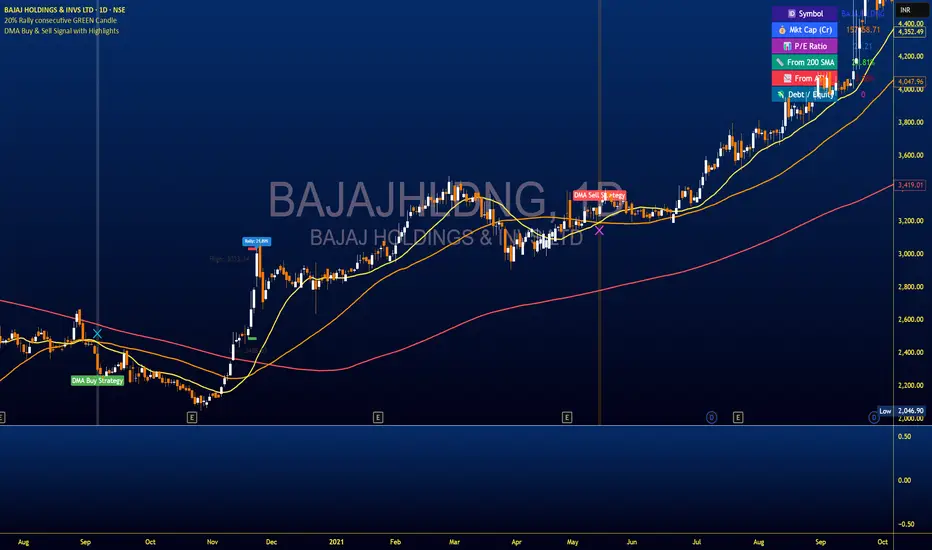
DMA Buy & Sell Signal with AlertsThis script identifies **BUY** signals when the 20 DMA crosses **below** the 50 DMA, with the alignment: `200 DMA > 50 DMA > 20 DMA > Price`.
It also plots **SELL** signals when the 20 DMA crosses **above** the 50 DMA, with the alignment: `Price > 20 DMA > 50 DMA > 200 DMA`.
Each signal is plotted on the chart with green "BUY" and red "SELL" labels.
The script includes alert conditions for both signals.
It uses simple moving averages (SMA) of 20, 50, and 200 periods.
Kalman Moving Average For LoopKey Features of the Indicator:
Flexible Moving Average Calculation (calcMovingAverage):Description: Allows users to select from 10 moving average types (SMA, EMA, DEMA, TEMA, WMA, VWMA, SMMA, HMA, LSMA, ALMA) to process the input price source (pricesource, default: close).
Parameters:
maType: User selects the moving average type (default: HMA).
period: Length of the moving average (default: 14).
almaSigma: Sigma parameter for ALMA (default: 5).
Purpose: Provides versatility in analyzing price trends, with the chosen moving average (maValue) used for comparison with the smoothed Kalman filter output.
Kalman Filter for Price Smoothing:
Description:
Applies a Kalman filter to the price source to produce a filtered price (kalmanFilteredPrice), which is further smoothed using an HMA to create smoothedKalmanPrice.
Parameters:
process_noise: Controls system model noise (default: 0.01).
measurement_noise:
Controls measurement noise (default: 3).
N: Filter order, determining the number of state estimates (default: 3).
smooth_period: HMA period for smoothing kalmanFilteredPrice (default: 9).
Purpose: Reduces noise in price data, providing a smoother trend line for signal generation and plotting.
Historical Analysis with For-Loop:
Description: Uses a for-loop to calculate the average of calcMovingAverage values over a user-defined historical range (from to to_) for historical bars of the price source (pricesource ).
Parameters:
from: Start of the historical range (default: 1).
to_: End of the historical range (default: 25).
Purpose: Computes an average moving average (avgMa) over the specified range to compare with the smoothed Kalman price for signal generation.
Error Handling and Robustness:
Description: Includes checks for na values in the for-loop to ensure only valid calcMovingAverage values contribute to the average (avgMa). Resets signal and plot variables each bar to prevent carryover.
Purpose: Ensures reliable calculations and prevents errors from invalid data.

PietasterThis Pine Script (v6) indicator plots a 111-day Simple Moving Average (SMA) and a 2 * 350-day SMA (equivalent to a 700-day SMA) for Bitcoin's price, displayed on any timeframe. It highlights crossover points with vertical lines: green for bullish crossovers (111-day MA crosses above 700-day MA) and purple for bearish crossovers (111-day MA crosses below 700-day MA). Vertical lines extend 50% above the highest price and 50% below the lowest price at the crossover, ensuring visibility through price action. Labels identify the moving averages for clarity.

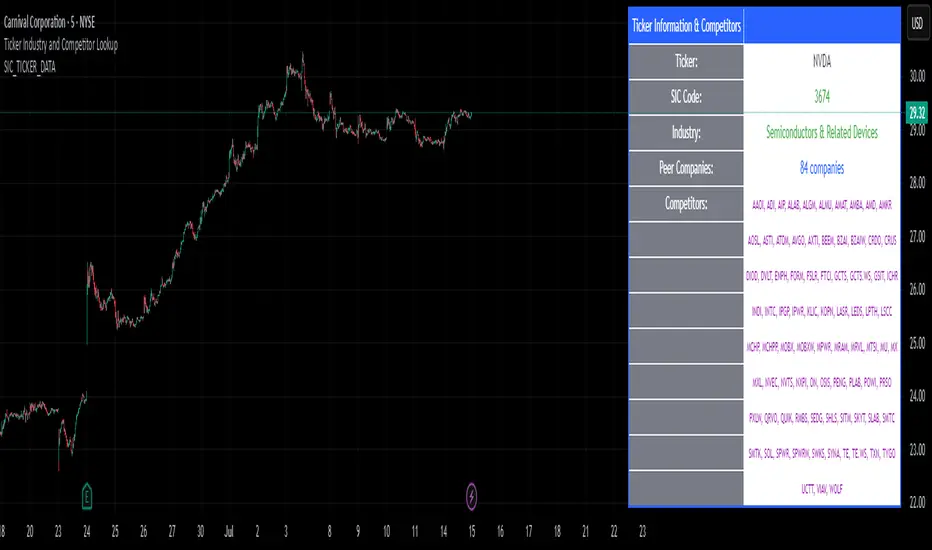
SIC_TICKER_DATAThe SIC Ticker Data is an advanced and efficient library for ticker-to-industry classification and sector analysis. Built with enterprise-grade performance optimizations, this library provides instant access to SIC codes, industry classifications, and peer company data for comprehensive market analysis.
Perfect for: Sector rotation strategies, peer analysis, portfolio diversification, market screening, and financial research tools.
The simple idea behind this library is to pull any data related to SIC number of any US stock market ticker provided by SEC in order to see the industry and also see the exact competitors of the ticker.
The library stores 3 types of data: SIC number, Ticker, and Industry name. What makes it very useful is that you can pull any one of this data using the other. For example, if you would like to know which tickers are inside a certain SIC, or what's the SIC number of a specific ticker, or even which tickers are inside a certain industry, you can use this library to pull this data. The idea for data inside this library is to be accessible in any direction possible as long as they're related to each other.
We've also published a simple indicator that uses this library in order to demonstrate the inner workings of this library.
The library stores thousands of tickers and their relevant SIC code and industry for your use and is constantly updated with new data when available. This is a large library but it is optimized to run as fast as possible. The previous unpublished versions would take over 40 seconds to load any data but the final public version here loads the data in less than 5 seconds.
🔍 Primary Lookup Functions
createDataStore()
Initialize the library with all pre-loaded data.
store = data.createDataStore()
getSicByTicker(store, ticker)
Get SIC code for any ticker symbol.
sic = data.getSicByTicker(store, "AAPL") // Returns: "3571"
getIndustryByTicker(store, ticker)
Get industry classification for any ticker.
industry = data.getIndustryByTicker(store, "AAPL") // Returns: "Computer Hardware"
getTickersBySic(store, sic)
Get all companies in a specific SIC code.
software = data.getTickersBySic(store, "7372") // Returns: "MSFT,GOOGL,META,V,MA,CRM,ADBE,ORCL,NOW,INTU"
getTickersByIndustry(store, industry)
Get all companies in an industry.
retail = data.getTickersByIndustry(store, "Retail") // Returns: "AMZN,HD,WMT,TGT,COST,LOW"
📊 Array & Analysis Functions
getTickerArrayBySic(store, sic)
Get tickers as array for processing.
techArray = data.getTickerArrayBySic(store, "7372")
for i = 0 to array.size(techArray) - 1
ticker = array.get(techArray, i)
// Process each tech company
getTickerCountBySic(store, sic)
Count companies in a sector (ultra-fast).
pinescripttechCount = data.getTickerCountBySic(store, "7372") // Returns: 10
🎯 Utility Functions
tickerExists(store, ticker)
Check if ticker exists in database.
exists = data.tickerExists(store, "AAPL") // Returns: true
tickerInSic(store, ticker, sic)
Check if ticker belongs to specific sector.
isInTech = data.tickerInSic(store, "AAPL", "3571") // Returns: true
💡 Usage Examples
Example 1: Basic Ticker Lookup
// @version=6
import EdgeTerminal/SIC_TICKER_DATA/1 as data
indicator("Ticker Analysis", overlay=true)
store = data.createDataStore()
currentSic = data.getSicByTicker(store, syminfo.ticker)
currentIndustry = data.getIndustryByTicker(store, syminfo.ticker)
if barstate.islast and currentSic != "NOT_FOUND"
label.new(bar_index, high, syminfo.ticker + " SIC: " + currentSic + " Industry: " + currentIndustry)
Example 2: Sector Analysis
// @version=6
import EdgeTerminal/SIC_TICKER_DATA/1 as data
indicator("Sector Comparison", overlay=false)
store = data.createDataStore()
// Compare sector sizes
techCount = data.getTickerCountBySic(store, "7372") // Software
financeCount = data.getTickerCountBySic(store, "6199") // Finance
healthCount = data.getTickerCountBySic(store, "2834") // Pharmaceutical
plot(techCount, title="Tech Companies", color=color.blue)
plot(financeCount, title="Finance Companies", color=color.green)
plot(healthCount, title="Health Companies", color=color.red)
Example 3: Peer Analysis
// @version=6
import EdgeTerminal/SIC_TICKER_DATA/1 as data
indicator("Find Competitors", overlay=true)
store = data.createDataStore()
currentSic = data.getSicByTicker(store, syminfo.ticker)
if currentSic != "NOT_FOUND"
competitors = data.getTickersBySic(store, currentSic)
peerCount = data.getTickerCountBySic(store, currentSic)
if barstate.islast
label.new(bar_index, high, "Competitors (" + str.tostring(peerCount) + "): " + competitors)
Example 4: Portfolio Sector Allocation
// @version=6
import EdgeTerminal/SIC_TICKER_DATA/1 as data
indicator("Portfolio Analysis", overlay=false)
store = data.createDataStore()
// Analyze your portfolio's sector distribution
portfolioTickers = array.from("AAPL", "MSFT", "GOOGL", "JPM", "JNJ")
sectorCount = map.new()
for i = 0 to array.size(portfolioTickers) - 1
ticker = array.get(portfolioTickers, i)
industry = data.getIndustryByTicker(store, ticker)
if industry != "NOT_FOUND"
currentCount = map.get(sectorCount, industry)
newCount = na(currentCount) ? 1 : currentCount + 1
map.put(sectorCount, industry, newCount)
🔧 Advanced Feature
You can also bulk load data for large data sets like this:
// Pre-format your data as pipe-separated string
bulkData = "AAPL:3571:Computer Hardware|MSFT:7372:Software|GOOGL:7372:Software"
store = data.createDataStoreFromBulk(bulkData)

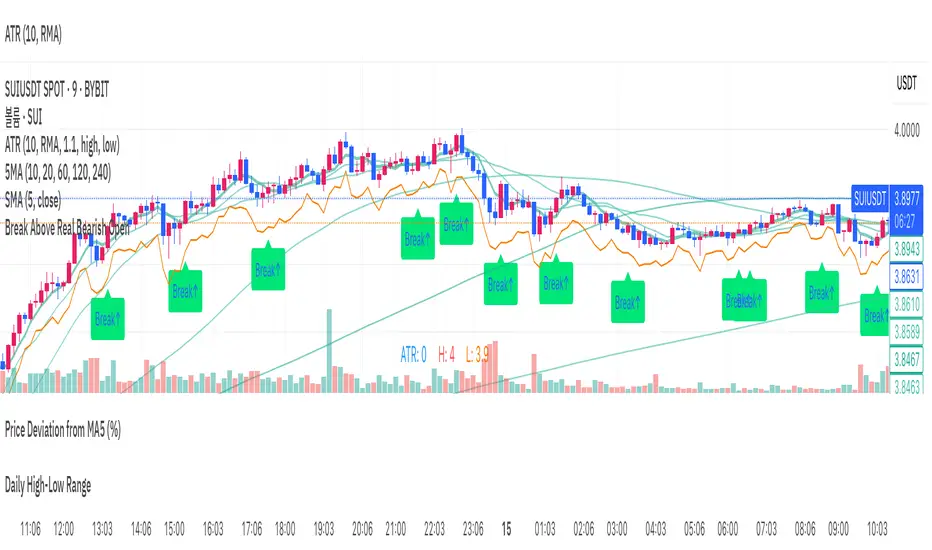
Break Above Real Bearish Open// This indicator is designed to help identify precise intraday entry points on lower timeframes.
// It tracks the most recent valid bearish candle—defined as a red candle whose close is lower than the low of the most recent bullish candle.
// When the price breaks above the open of that bearish candle with a bullish candle, a "Break↑" signal is shown.
// Minor pullback candles within uptrends are filtered out to reduce noise.
// The alert only triggers once per valid bearish setup, avoiding redundant signals.
// Ideal for detecting breakout opportunities after pullbacks in intraday trending markets.
// 이 인디케이터는 장중 분봉 기준에서 정밀한 진입 타이밍을 포착하는 데 도움을 줍니다.
// 최근 형성된 유효한 음봉(가장 최근 양봉의 저가보다 종가가 낮은 음봉)을 추적하며,
// 해당 음봉의 시가를 돌파하는 양봉이 등장할 경우, "Break↑" 신호를 차트에 표시합니다.
// 상승 중의 사소한 눌림 음봉은 자동으로 걸러내어 노이즈를 최소화합니다.
// 하나의 음봉에 대해 알림은 단 한 번만 발생하며, 중복되지 않도록 설계되어 있습니다.
// 분봉 흐름 속 눌림목 이후 돌파 구간을 자동으로 포착하고자 할 때 유용하게 활용할 수 있습니다.
NVDA Put Exit Alerts - Enhanced How to Use on These Timeframes:
5-15 min chart:
Look for price rejections or bounces at the weekly/monthly VWAP.
Confirm with CMF above 0.1 (buy pressure) or below -0.1 (sell pressure).
30-min to 1-hour chart:
Use to identify broader intraday swing moves that align with macro VWAP levels.
CMF will act as a filter for volume divergence setups.

Economy RadarEconomy Radar — Key US Macro Indicators Visualized
A handy tool for traders and investors to monitor major US economic data in one chart.
Includes:
Inflation: CPI, PCE, yearly %, expectations
Monetary policy: Fed funds rate, M2 money supply
Labor market: Unemployment, jobless claims, consumer sentiment
Economy & markets: GDP, 10Y yield, US Dollar Index (DXY)
Options:
Toggle indicators on/off
Customizable colors
Tooltips explain each metric (in Russian & English)
Perfect for spotting economic cycles and supporting trading decisions.
Add to your chart and get a clear macro picture instantly!

Capitalife IndexCapitalife Index
Jahres Rendite seit 2008 basierend auf Backtesting & Live Ergebnisse

SOL Technical Confluence DashboardHow to Use This Confluence Dashboard
Setup Instructions:
Use the other script published as the 1 of 2 scripts to add to your 4-hour SOL chart.
What You'll See:
1. RSI Panel with Enhancements
Colored RSI line (Green = oversold, Red = overbought)
Divergence detection (triangles mark divergences)
Background color changes on strong signals
2. Confluence Table (Top Right)
Shows real-time status of:
RSI: Current value and signal
MACD: Trend direction
Volume: Spike detection and relative volume
Divergence: Bull/Bear divergence alerts
Confluence Scores: 0-10 scale for bull/bear strength
Overall Signal: STRONG BUY/SELL, BUY/SELL, or WAIT
3. Net Confluence Histogram (Bottom)
Green bars = Bullish confluence
Red bars = Bearish confluence
Height = Strength of signal
How It Works with Elliott Waves:
Scenario 1: Wave 5 Top Detection
Elliott Wave shows Wave 5 approaching 261.8%
Confluence Dashboard shows:
RSI: 78 (overbought) ❌
MACD: Bearish cross ❌
Volume: Declining ❌
Divergence: Bearish ❌
Signal: STRONG SELL 🔴
Scenario 2: Wave 2 Bottom
Elliott Wave shows Wave 2 at 61.8% retracement
Confluence Dashboard shows:
RSI: 28 (oversold) ✅
MACD: Bullish cross ✅
Volume: Spike ✅
Divergence: Bullish ✅
Signal: STRONG BUY 🟢
Confluence Scoring System:
The script uses a weighted scoring system:
Divergences: 3 points (most reliable)
RSI extremes: 2 points
Volume spikes: 2 points
MACD signals: 1.5 points
Price action: 1 point
Signals:
Score ≥ 5 = STRONG signal
Score ≥ 3 = Moderate signal
Score < 3 = WAIT
Pro Tips for Maximum Accuracy:
Best Setups: When Elliott Wave completion aligns with STRONG signals
Avoid: Taking trades when confluence is mixed
Volume Confirmation: Always check if volume supports the move
Divergence Priority: RSI divergence at wave endpoints is highly reliable
Alerts Available:
Strong Bullish Confluence
Strong Bearish Confluence
Bullish Divergence
Bearish Divergence
This gives you a complete technical analysis suite that works seamlessly with your Elliott Wave indicator. The combination significantly improves accuracy by confirming wave counts with momentum, volume, and divergence analysis!

SOL Elliott Wave 4H with Enhanced ProjectionsThis 4H-optimized version includes:
Key Features for 4H Timeframe:
Optimized Default Settings:
Wave Detection Period: 7 (perfect for 4H)
ZigZag Depth: 3% (captures significant moves on 4H)
Visual Indicators:
Small circles mark pivot points as they form
Blue background on the last bar shows script is active
Clean zigzag lines between pivots
Wave numbers at each pivot
Immediate Feedback:
Pivots show up as soon as they're confirmed
Table shows pivots found count
Current price always visible
To Use This:
Add to your 4H SOL chart
You should immediately see:
Small circles marking recent pivots
The info table in top-right
Blue highlight on the current bar
If you don't see lines yet, try:
Reduce Wave Detection Period to 5
Reduce ZigZag Depth to 2%
Make sure you have at least 100-200 bars of history loaded
Fine-tuning for current market:
If SOL is ranging: Lower ZigZag Depth to 2%
If SOL is trending strongly: Increase to 4-5%
The indicator will start drawing zigzag lines and counting waves as soon as it finds valid alternating highs and lows that meet the minimum percentage move requirement.

Dominancia USDT + USDC (colores dinámicos + etiqueta)//@version=5
indicator("Dominancia USDT + USDC (colores dinámicos + etiqueta)", overlay=true)
usdt = request.security("CRYPTOCAP:USDT.D", "D", close)
usdc = request.security("CRYPTOCAP:USDC.D", "D", close)
combo = usdt + usdc
// Color verde si sube, rojo si baja
colorLine = combo > combo ? color.green : color.red
// Mostrar la línea de dominancia combinada
plot(combo, title="Dominancia Combinada", color=colorLine, linewidth=2)
// Crear etiqueta con valor actual (usando label, que sí permite texto dinámico)
if bar_index == ta.highest(bar_index, 1)
var label lbl = na
lbl := label.new(x=bar_index, y=combo, text="⬤ " + str.tostring(combo, "#.##"), style=label.style_label_right, textcolor=color.white, size=size.small, color=colorLine)
label.delete(lbl )


Advanced Range Theory - ART📊 Advanced Range Theory (ART): The Institutional Blueprint
Stop drawing lines. Start reading the blueprint of the market. Advanced Range Theory (ART) is not another support and resistance indicator; it is a military-grade market structure engine designed to decode the language of institutional capital. It operates on a single, powerful premise: markets move in phases of consolidation and expansion, and the key to anticipation lies in understanding the complete lifecycle of these phases.
ART provides a living, breathing map of the battlefield, identifying institutional accumulation zones and tracking them with unparalleled precision from their inception as "Pending" ranges to their ultimate classification after a breakout. This is your X-ray into the market's skeletal structure.
🔬 THEORETICAL FRAMEWORK: THE ARCHITECTURE OF PRICE ACTION
ART is built on a multi-layered system of logic that moves beyond static levels. It treats ranges as dynamic entities with a narrative—a beginning, a middle, and an end. The core of the system is the dynamic classification engine, which analyzes not just the range, but the character of the price action that resolves it.
1. The Range Lifecycle: From Accumulation to Classification
This is the revolutionary heart of ART. A range's true identity is only revealed by how it is broken.
Phase 1: PENDING (Yellow): A new range is identified based on a period of price consolidation (a "parent" candle followed by a minimum number of "inside" candles). At this stage, it is a neutral zone of potential energy—an area where institutions are likely building positions. It is a question the market has not yet answered.
Phase 2: MITIGATION & CLASSIFICATION: When price breaks out and reaches a calculated extension level, the range is considered "mitigated." At this exact moment, ART analyzes the breakout's DNA to classify the range's true intent:
TYPE 1 - BREAKOUT (Blue): Characterized by a strong, impulsive move with confirming volume. This is a high-conviction breakout, signaling aggressive institutional participation and the likely start of a new trend. It is a statement of intent.
TYPE 2 - REVERSAL (Orange): Occurs when price attempts to break one way but is aggressively rejected, reversing and breaking out the other side. This signals absorption and a "failed auction," often marking significant market turning points.
TYPE 3 - PIVOT (Green): A more balanced breakout, lacking the explosive momentum of a Type 1. This often represents a resolution after a period of indecision or a pivot within a larger trading range.
2. The Hierarchical Map: Source & S/R Levels
ART doesn't just draw boxes; it builds a genealogical map of market structure.
SOURCE LEVEL (Thick Gold Line): This is the "genesis" point—the most recently mitigated range. It acts as the primary point of origin for the current market swing and serves as a critical level for determining overall bias. Price action above the Source is generally bullish; below is bearish.
S/R LEVELS (Cyan Lines): When a range is mitigated, the price level where it broke becomes a key Support/Resistance zone for the future. ART tracks the two most recent S/R levels, as these often act as powerful magnets or rejection points for price.
3. The Multi-Factor Validation Engine
To eliminate noise and focus only on institutionally significant ranges, every potential range must pass a rigorous quality control check:
Time-Based Consolidation: Requires a minimum number of consecutive inside candles (minInsideCandles), ensuring a true period of balance.
Volatility-Based Significance: The range's size must be greater than a multiple of the Average True Range (minRangeSize), filtering out insignificant micro-consolidations.
Participation Confirmation: The parent candle of the range is checked against average volume to ensure there was meaningful activity during its formation.
⚙️ THE COMMAND CONSOLE: CONFIGURING YOUR ART ENGINE
Every input is designed to give you granular control over the detection engine, allowing you to tune ART to any market or timeframe with precision. Each tooltip in the script provides a deep dive, but here is a summary of the core controls.
🎯 ART Detection Engine
Minimum Inside Candles: The soul of the detection algorithm. It defines the minimum number of bars that must be contained within a single "parent" candle to qualify as a range. Higher values (3-4) find major, significant consolidation zones. Lower values (1-2) are more sensitive and will identify shorter-term accumulation patterns.
Extension Multiplier & Fibonacci Extension: These control the profit target projections. The Extension Multiplier uses a simple measured move (e.g., 1.0 = a 1:1 projection of the range's height). The Fibonacci Extension uses the golden ratio (1.618) for harmonically-derived targets.
Mitigation Method (Cross vs. Close): Determines how a breakout is confirmed. Cross is more responsive, triggering as soon as price touches the extension. Close is more conservative, requiring a full candle to close beyond the level, which helps filter out fake-outs from wicks.
Min Range Size (ATR): A crucial noise filter. It ensures that ART ignores tiny, insignificant ranges by requiring a range's height to be a certain multiple of the current market volatility (ATR).
📊 Display & Visual Configuration
These settings give you full control over the visual interface. You can toggle every single element—from the Webb Scanner to the S/R Levels—to create a clean or a comprehensive view. Choose a color theme that suits your charting environment or define a fully custom palette.
🕸️ Webb Analysis Scanner
This is a unique real-time flow analysis tool. It draws dynamic, animated lines from the current price to recent historical points. This visualization helps reveal hidden "tendrils" of momentum and short-term support/resistance that are not immediately obvious, acting as a "sonar" for immediate price flow.
📊 THE ANALYTICS HUB: YOUR DASHBOARD DECODED
The dashboard provides a real-time, at-a-glance intelligence briefing on the current state of market structure as seen by the ART engine.
RANGE METRICS: This section is a "census" of the market's structure. It tells you the total number of ranges identified, how many are still Pending (awaiting a breakout), how many are Unmitigated (active but not yet broken), and how many have been Mitigated (classified and complete).
TYPE BREAKDOWN: This is a powerful gauge of market character. A high count of Type 1 (Breakout) ranges suggests a strong, trending environment. A rising number of Type 2 (Reversal) ranges can signal market exhaustion and potential trend changes. A dominant Type 3 (Pivot) count indicates a balanced, rotational market.
KEY GUIDE: The Large dashboard includes a full legend, so you never have to guess what a line or color represents. It's your built-in user manual.
🎨 DECODING THE BLUEPRINT: A VISUAL INTERPRETATION GUIDE
Every line and color in ART is designed for instant, intuitive understanding.
The Range Lines:
Yellow Lines: A Pending range. This is an active zone of accumulation. Pay close attention.
Colored Lines (Blue/Orange/Green): An unmitigated, classified range. The color tells you its breakout character.
Dotted Lines: A Mitigated range. Its story has been told. These historical levels can still act as support or resistance.
The Identification Zones: These colored boxes appear at a range's origin point after it has been classified. They are the "birth certificate" of the range, permanently marking its type (Breakout, Reversal, or Pivot) and providing an immediate visual history of market behavior.
The Hierarchical Lines:
Thick Gold Line (Source): The most important line on your chart. It is the anchor for your bias.
Cyan Lines (S/R): High-probability decision points. Expect reactions here.
Purple Dotted Lines (Extensions): Logical, calculated profit targets for breaking ranges.
🔧 THE ARCHITECT'S VISION: THE DEVELOPMENT JOURNEY
ART was born from a deep frustration with the static and subjective nature of traditional market structure analysis. Drawing lines by hand is inconsistent, and most indicators are reactive, only confirming what has already happened. The goal was to create a proactive, objective, and dynamic framework that could think about the market in terms of phases and lifecycles.
The breakthrough came from a simple shift in perspective: a range's true character isn't defined when it forms, but by how it resolves. This led to the development of the "post-breakout classification engine," which waits for the market to show its hand before assigning a definitive type. The Webb Scanner was inspired by the desire to visualize the unseen, to create a tool that could feel the immediate "pull" and "push" of price flow. The result is not just an indicator; it is a new language for interpreting price action, built on a foundation of logic, clarity, and precision.
⚠️ RISK DISCLAIMER & BEST PRACTICES
Advanced Range Theory is a professional-grade analytical tool designed to enhance a trader's decision-making process. It does not provide direct buy or sell signals. The levels and classifications it generates are based on historical price action and mathematical probabilities. All trading involves substantial risk, and past performance is not indicative of future results. Always use this tool in conjunction with a robust risk management plan.
"I fear not the man who has practiced 10,000 kicks once, but I fear the man who has practiced one kick 10,000 times."
— Dskyz, Trade with insight. Trade with anticipation.
— Bruce Lee

CVDoogle (CVDoogle Indicator)This is a free simple line indicator that represents Cumulative Volume Delta. The script has been tuned specifically to most popular timeframes to be more accurate of the timeframe of the chart. This may make the line appear less smooth than other indicators, but should be more accurate to the current timeframe of the chart.
This indicator was created to be used along with the following to create a Poor Man's Exochart:
Use Volume Footprint instead of Candles on the TradingView chart
Settings:
Row Size - Auto (ATR)
ATR Length - 9
Display - Cluster
Type - Delta
Add Open Interest Suite - By Leviathan indicator
Timeframes covered by this indicator
15s
30s
1m
2m
3m
5m
6m
10m
12m
15m
24m
30m
45m
1H
2H
3H
4H
5H
6H
8H
12H
1D

7 EMA CloudThe "7 EMA Cloud" script was likely flagged because it reuses the core concept of EMA clouds (shading areas between multiple EMAs to visualize trends, support/resistance, and momentum) without crediting the original inventor, Ripster (author ripster47 on TradingView). This concept is prominently associated with Ripster's "EMA Clouds" indicator, which popularized filling spaces between EMA pairs for trading signals. TradingView's house rules require crediting authors when reusing open-source ideas or code, even if not a direct copy-paste, and mandate significant improvements where the original forms a small proportion of the script. Your version adds features like multiple color modes (Classic rainbow, Monochrome, Heatmap), customizable signal sizes, and crossover alerts between the first and last EMA, which are enhancements, but the foundational EMA ribbon/cloud idea needs explicit attribution in the description and ideally code comments to comply.
Additionally, the description might be seen as not fully self-contained (e.g., it uses promotional language like "Advanced" and "Adaptive Trend & Signal Suite" without deeply explaining calculations or use cases), potentially violating rules against relying on code or external references for clarity.
To fix this, republish a new version with proper credits, ensure the description is detailed and standalone, and emphasize your improvements (e.g., the 7 Fibonacci-based EMAs, color modes, and signals). Do not reuse the flagged script—create a fresh one. Here's a compliant description you can use:
7 EMA Cloud Indicator
Overview
The 7 EMA Cloud overlays seven exponential moving averages (EMAs) with Fibonacci-inspired periods and fills the spaces between them with customizable "clouds" to visually represent trend strength, direction, and convergence/divergence. It includes crossover signals between the shortest and longest EMAs for potential entry/exit points, with adjustable visual modes for different trading styles. This helps traders identify bullish/bearish momentum, support/resistance zones, and overextensions in trending or ranging markets.
This script builds on the EMA cloud concept popularized by Ripster (ripster47) in their "EMA Clouds" indicatortradingview.com, where areas between EMA pairs are shaded for trend analysis. Improvements include a fixed set of 7 Fibonacci EMAs, multiple color schemes (Classic rainbow, Monochrome grayscale, Heatmap for intensity), user-selectable signal sizes, and transparency controls. Released under the Mozilla Public License 2.0.
Key Features
7 EMAs with Clouds: EMAs at periods 8, 13, 21, 34, 55, 89, and 144; clouds filled between consecutive pairs to show alignment (tight clouds for consolidation, wide for trends).
Color Modes:
Classic: Rainbow gradients (blue to purple) for vibrant distinction.
Monochrome: Grayscale shades for minimalistic charts.
Heatmap: Red-to-blue spectrum to highlight "hot" (volatile) vs. "cool" (stable) areas.
Crossover Signals: Triangle markers (up for bullish, down for bearish) when the shortest EMA crosses the longest; sizes from Tiny to Huge.
Display Options: Toggle EMA lines on/off, adjust cloud transparency (0-100%), and enable alerts for crossovers.
Alerts: Notifications for "Bullish EMA Crossover" (EMA1 > EMA7) and "Bearish EMA Crossover" (EMA1 < EMA7).
How It Works
EMA Calculations: Each EMA is computed using ta.ema(close, period), with periods based on Fibonacci sequences for natural market rhythm alignment.
Clouds: Filled via fill() between plot pairs, with colors derived from the selected mode and transparency applied.
Signals: Detected with ta.crossover(ema1, ema7) and ta.crossunder(ema1, ema7), plotted as shapes with mode-specific colors (e.g., green/lime for bull, red for bear).
Customization: Inputs grouped into EMA Settings (periods), Display Settings (visibility, colors, transparency), and Signal Settings (size).
Customization Options
EMA Periods: Individually adjustable (defaults: 8, 13, 21, 34, 55, 89, 144).
Show EMAs: Toggle to hide lines and focus on clouds.
Cloud Transparency: 0% for solid fills, 100% for invisible (default 80%).
Color Mode: Switch between Classic, Monochrome, or Heatmap.
Signal Size: Tiny, Small, Normal, Large, or Huge for crossover markers.
Ideal Use Case
Suited for swing or trend-following on any timeframe (e.g., 15m-1h for intraday, daily for swings) and assets (stocks, forex, crypto, futures). Enter long on bullish crossovers above aligned clouds; exit on bearish signals or cloud widenings. Use Monochrome for clean charts or Heatmap for volatility emphasis. Combine with volume or RSI for confirmation.
Why It's Valuable
By expanding Ripster's EMA cloud idea with multi-mode visuals and integrated signals, this indicator provides a versatile, at-a-glance tool for trend assessment—reducing noise while highlighting key shifts. It's more adaptive than basic MA ribbons, with Fibonacci periods adding a layer of harmonic analysis.
Note: Test on historical data or demo accounts. Not financial advice—incorporate risk management. Optimized for Pine Script v5; some features may vary on non-overlay charts.

Dominancia USDT + USDC con fondoUSDT DOMINANCE + USDC DOMINANCE. It helps me identify future resistances and new BTC ATHs, as well as potential selling zones.

Dominancia USDT + USDCUSDT DOMINANCE + USDC DOMINANCE. It helps me identify future resistances and new BTC ATHs, as well as potential selling zones.

Dominancia USDT + USDCUSDT.D+USDC.D
USDT DOMINANCE + USDC DOMINANCE. It helps me identify future resistances and new BTC ATHs, as well as potential selling zones.

MP MTF FVG/IFVG/BPRMP MTF FVG/IFVG/BPR — Script Description
Overview:
The “MP MTF FVG/IFVG/BPR” indicator is a multi-timeframe (MTF) trading tool that automatically identifies and visualizes three key Smart Money Concepts (SMC) price imbalances:
FVG (Fair Value Gap)
IFVG (Improved/Mitigated Fair Value Gap)
BPR (Balanced Price Range)
The script allows traders to monitor these liquidity zones across multiple custom timeframes (up to 6), helping them spot high-probability trade setups and market structure shifts. Designed for intraday and swing traders, it adapts to any market—forex, stocks, indices, or crypto.
Key Features:
Multi-Timeframe Support:
Select up to 6 different timeframes for simultaneous analysis.
Toggle visibility, set custom max number of imbalances to show per TF, and choose custom colors for each type and timeframe.
FVG Detection:
Automatically marks Fair Value Gaps (price imbalances where rapid moves may leave “inefficiency” between candles), highlighting both bullish and bearish gaps.
IFVG Identification:
Optionally marks mitigated or improved FVGs based on user logic or additional filters, to highlight areas where imbalances have been partially filled.
BPR Highlighting:
Detects and draws Balanced Price Ranges—zones where price efficiently rebalances after filling a previous gap or sweep.
Visualization:
Draws clean colored boxes/lines for each zone, with options for border style, fill opacity, and label display (including timeframe tags).
Option to enable or disable the midline for BPRs.
Performance Optimization:
Limits max active boxes/lines per TF to prevent chart clutter or performance lag.
Works Only On Closed Bars:
The indicator is designed to avoid drawing liquidity zones on unfinished candles, ensuring only valid, confirmed imbalances are shown.
Use Cases:
Identify high-probability entry/exit zones based on institutional trading concepts.
Spot potential reversal, retracement, or continuation areas.
Combine with your own execution model or other SMC tools for more robust strategies.
Parameters:
Enable/disable each timeframe (TF1–TF6)
Custom timeframe selection for each
Max FVGs, IFVGs, BPRs per TF
Custom color for each type/timeframe
Optional BPR midline and color
Notes:
This script is for educational purposes and should be used with risk management.
For best results, combine with additional confirmation signals and trade planning.
