Asset Premium/Discount Monitor📊 Overview
The Asset Premium/Discount Monitor is a tool for analyzing the relative value between two correlated assets. It measures when one asset is trading at a premium or discount compared to its historical relationship with another asset, helping traders identify potential mean reversion opportunities, or pairs trading opportunities.
🎯 Use Cases
Perfect for analyzing:
NASDAQ:MSTR vs CRYPTO:BTCUSD - MicroStrategy's premium/discount to Bitcoin
NASDAQ:COIN vs BITSTAMP:BTCUSD - Coinbase's relative value to Bitcoin
NASDAQ:TSLA vs NASDAQ:QQQ - Tesla's premium to tech sector
Regional banks AMEX:KRE vs AMEX:XLF - Individual bank stocks vs financial sector
Any two correlated assets where relative value matters
Example of a trade: MSTR vs BTC - When indicator shows MSTR at 95% percentile (extreme premium): Short MSTR, Buy BTC. Then exit when the spread reverts to the mean, say 40-60% percentile.
🔧 How It Works
Core Calculation
Ratio Analysis: Calculates the price ratio between your asset and the correlated asset
Historical Baseline: Establishes the "normal" relationship using a 252-day moving average. You can change this.
Premium Measurement: Measures current deviation from historical average as a percentage
Statistical Context: Provides percentile rankings and standard deviation bands
The Math
Premium % = (Current Ratio / Historical Average Ratio - 1) × 100
🎨 Customization Options
Correlated Asset: Choose any symbol for comparison
Lookback Period: Adjust historical baseline (50-1000 days)
Smoothing: Reduce noise with moving average (1-50 days)
Visual Toggles: Show/hide bands and percentile lines
Color Themes: Customize premium/discount colors
📊 Interpretation Guide
Premium/Discount Reading
Positive %: Asset trading above historical relationship (premium)
Negative %: Asset trading below historical relationship (discount)
Near 0%: Asset at fair value relative to correlation
Percentile Ranking
90%+: Near recent highs - potential selling opportunity
10% and below: Near recent lows - potential buying opportunity
25-75%: Normal trading range
Signal Classifications
🔴 SELL PREMIUM: Asset expensive relative to recent range
🟡 Premium Rich: Moderately expensive, monitor for reversal
⚪ NEUTRAL: Fair value territory
🟡 Discount Opportunity: Moderately cheap, potential accumulation zone
🟢 BUY DISCOUNT: Asset cheap relative to recent range
🚨 Built-in Alerts
Extreme Premium Alert: Triggers when percentile > 95%
Extreme Discount Alert: Triggers when percentile < 5%
⚠️ Important Notes
Works best with highly correlated assets
Historical relationships can change - monitor correlation strength
Not investment advice - use as one factor in your analysis
Backtest thoroughly before implementing any strategy
🔄 Updates & Future Features
This indicator will be continuously improved based on user feedback. So... please give me your feedback!
Pairstrading

Market to NAV Premium Arbitrage Alpha IndicatorMARKET TO NAV PREMIUM ARBITRAGE ALPHA INDICATOR
A quantitative tool for identifying statistical mispricings between market capitalization and net asset value (NAV), designed specifically for arbitrage strategies and alpha generation in Bitcoin-holding companies like MicroStrategy (MSTR), companies or SPACS used mostly to hold crypto, Bitcoin ETFs, and other NAV-based instruments. Can probably be also used in certain spin-offs.
📊 KEY FEATURES:
✅ Real-time Premium/Discount Calculation
• Automatically retrieves market cap data from TradingView
• Calculates precise NAV based on underlying asset holdings
• Formula: (Market Cap - NAV) / NAV × 100
✅ Statistical Analysis Framework
• Historical percentile rankings (customizable lookback period)
• Standard deviation bands (2σ) for extreme value detection
• Smoothing options to reduce noise
✅ Multi-Source Market Cap Detection
• Priority system: TradingView data → Calculated → Manual override
• Automatic fallback mechanisms for data reliability
✅ Advanced NAV Modeling
• Basic NAV: Asset holdings + cash
• Adjusted NAV: Includes software business value, debt, preferred shares. If the company has a lot of this kind of intrinsic value, put it in the "cash" field
• Support for any underlying asset (BTC, ETH, etc.)
📈 TRADING APPLICATIONS:
🎯 Pairs Trading Signals
• Long/Short opportunities when premium reaches statistical extremes
• Mean reversion strategies based on historical ranges
• Risk-adjusted position sizing using percentile ranks
🎯 Arbitrage Detection
• Identifies when market pricing significantly deviates from fair value
• Quantifies the magnitude of mispricing for profit potential
• Historical context for timing entry/exit points
🔧 CONFIGURATION OPTIONS:
• Underlying Asset: Any symbol (default: COINBASE:BTCUSD) NEED MANUAL INPUT
• Asset Quantity: Precise holdings amount. NEED MANUAL INPUT
• Cash Holdings: Additional liquid assets. NEED MANUAL INPUT
• Market Cap Mode: Auto-detect, calculated, or manual
• Advanced Adjustments: Business value, debt, preferred shares
• Display Settings: Lookback period, smoothing, custom colors
🎯 PERFECT FOR:
• Quantitative traders focused on statistical arbitrage
• Institutional investors monitoring NAV-based instruments
• Bitcoin ETF and MSTR traders seeking alpha generation
• Risk managers tracking premium/discount exposures
• Academic researchers studying market efficiency (as you can see, markets are not efficient 😉)
🔗 CONNECT & SUPPORT:
Follow for updates and additional quantitative trading tools. Feedback and suggestions welcome!

Arbitrage Synthetic Spread Chart v2Powerful tool for analyzing market divergences and identifying arbitrage opportunities! It creates a synthetic spread chart between two assets, displaying it in a clear format and helping traders spot moments of maximum decorrelation.
How does it work?
The indicator takes the closing prices of two assets and calculates their difference (spread):
spread = price1 - price2
Then, it constructs a price channel based on the highest and lowest values of the spread over a given period:
-Upper boundary: The highest spread value over the period
- Lower boundary: The lowest spread value over the period
- Middle line: The average of the upper and lower boundaries
Additionally, the indicator calculates the **correlation** between the two assets, helping traders assess their relationship strength.
How to use it?
When the spread reaches the channel boundaries, it may indicate an abnormal divergence between the assets. This serves as a signal for arbitrage trading:
✅ At the upper boundary: Sell Asset 1 and buy Asset 2
✅ At the lower boundary: Buy Asset 1 and sell Asset 2

Statistical Arbitrage Pairs Trading - Long-Side OnlyThis strategy implements a simplified statistical arbitrage (" stat arb ") approach focused on mean reversion between two correlated instruments. It identifies opportunities where the spread between their normalized price series (Z-scores) deviates significantly from historical norms, then executes long-only trades anticipating reversion to the mean.
Key Mechanics:
1. Spread Calculation: The strategy computes Z-scores for both instruments to normalize price movements, then tracks the spread between these Z-scores.
2. Modified Z-Score: Uses a robust measure combining the median and Median Absolute Deviation (MAD) to reduce outlier sensitivity.
3. Entry Signal: A long position is triggered when the spread’s modified Z-score falls below a user-defined threshold (e.g., -1.0), indicating extreme undervaluation of the main instrument relative to its pair.
4. Exit Signal: The position closes automatically when the spread reverts to its historical mean (Z-score ≥ 0).
Risk management:
Trades are sized as a percentage of equity (default: 10%).
Includes commissions and slippage for realistic backtesting.

Symbols Correlation, built for pair tradingOverview:
This script is designed for pairs trading. If you are not familiar with pairs trading, I suggest learning about it, as it can be a profitable strategy in neutral markets (or neutral trends between two assets). The correlation between two assets is the foundation of pairs trading, and without it, the chances of making a profit are low.
Correlation can be described in two opposite ways:
1: Absolute positive correlation (meaning the asset prices move together).
-1: Absolute negative correlation (meaning the asset prices move in opposite directions).
Any value between 1 and -1 indicates some degree of correlation, but generally, values higher than 0.7 or lower than -0.7 are considered significant.
Features:
Typically, correlation is measured using the closing prices. This script adds three more correlation studies based on open, high, and low prices. By using all four lines, we can get a better understanding of the pair's correlation.
How to Read This Indicator:
To use this indicator effectively, you need to input your pair as a ratio. For example, if your pair is TSN and ZBH, enter it in the symbol search as: TSN/ZBH
Gray Area : This area indicates "no high correlation" (default is between -0.8 and 0.8, adjustable in the settings).
Gray Line : This represents the close correlation within the "no high correlation" range.
Green Line : This represents the close correlation within the "high correlation" range.
Dot Lines : These represent the open, high, and low correlations.
Example Interpretations:
A : All four lines are close together & the line is green – very good correlation!
B : The line is gray, and the dot lines are apart – not a strong correlation.
C : When the close correlation remains green for a long time, it signals a strong correlation.
Application in Pairs Trading:
In pairs trading, aim for the highest possible correlation, and it is important to have a sustained correlation over a long period. Pairs that correlate only part of the year but not consistently are less reliable for pairs trading.
This is an example for good correlation for pairs trading:
This is an example for bad correlation for pairs trading:
Here is a view of my full indicators when doing pairs trading:

Trend Momentum Strength Indicator, Built for Pairs TradingOverview:
This script combines multiple indicators to provide a comprehensive analysis of both trend strength and trend momentum. It is tailored specifically for pairs trading strategies but can also be used for other trading strategies.
Benefit of Comprehensive Analysis:
Having an indicator that evaluates both trend strength and trend momentum is crucial for traders looking to make informed decisions. It allows traders to not only identify the direction and intensity of a trend but also gauge the momentum behind it. This dual capability helps in confirming potential trade opportunities, whether for entering trades with strong trends or considering reversals during overbought or oversold conditions. By integrating both aspects into one tool, traders can gain a holistic view of market dynamics, enhancing their ability to time entries and manage risk effectively.
Features:
* Trend Strength:
Enhanced ADX Formula: The script includes modifications to the standard ADX formula along with DI+ and DI- to provide more responsive trend strength readings.
Directional Indicators: DI+ (green line) indicates positive directional movement, while DI- (red line) indicates negative directional movement.
Trend Momentum:
Modified Stochastic Indicators: The script uses %K and %D indicators, modified and combined with ADX to give a clear indication of trend momentum.
Momentum Strength: This helps determine the strength and direction of the momentum.
Trading Signals:
Combining Indicators: The script combines ADX, DI+, DI-, %K, and %D to generate comprehensive trading signals.
Optimal Entry Points: Designed to identify optimal entry points for trades, particularly in pairs trading.
Colored Area at Bottom:
This area provides two easy-to-read functions:
Color:
Green: Upward momentum (ratio above 1)
Red: Downward momentum (ratio below 1)
Height:
Higher in green: Stronger upward momentum
Lower in red: Stronger downward momentum
Legend:
Green Line: DI+ (Positive)
Red Line: DI- (Negative)
Black Line: ADX
How to Read This Indicator:
1) Trend Direction:
DI+ above DI-: Indicates an upward trend.
DI- above DI+: Indicates a downward trend.
2) Trend Strength:
ADX below 20: Indicates a neutral trend.
ADX between 20 and 25: Indicates a weak trend.
ADX above 25: Indicates a strong trend.
Trading Signals in Pairs Trading:
Neutral Trend: Ideal for pairs trading when no strong trend is detected.
Overbought/Oversold: Uses %K and %D to identify overbought/oversold conditions that support trade decisions.
Entry Signals: Green signals for long positions, red signals for short positions, based on combined criteria of neutral trend strength and supportive momentum.
Application in Pairs Trading:
Neutral trend: In pairs trading strategies, where neutral movement is often sought, this indicator provides signals that are especially relevant during periods of neutral trend strength and supportive momentum, aiding traders in identifying optimal entry
Risk Management: Combining signals from ADX, DI+, DI-, %K, and %D helps traders make more informed decisions regarding entry points, enhancing risk management.
Example Chart (The indicator is on the upper right corner):
Clean Presentation: The chart only includes the necessary elements to demonstrate the indicator’s functionality.
Demonstrates: Overbought/oversold conditions, upward/downward/no momentum, and trading signals with/without specific scenarios.

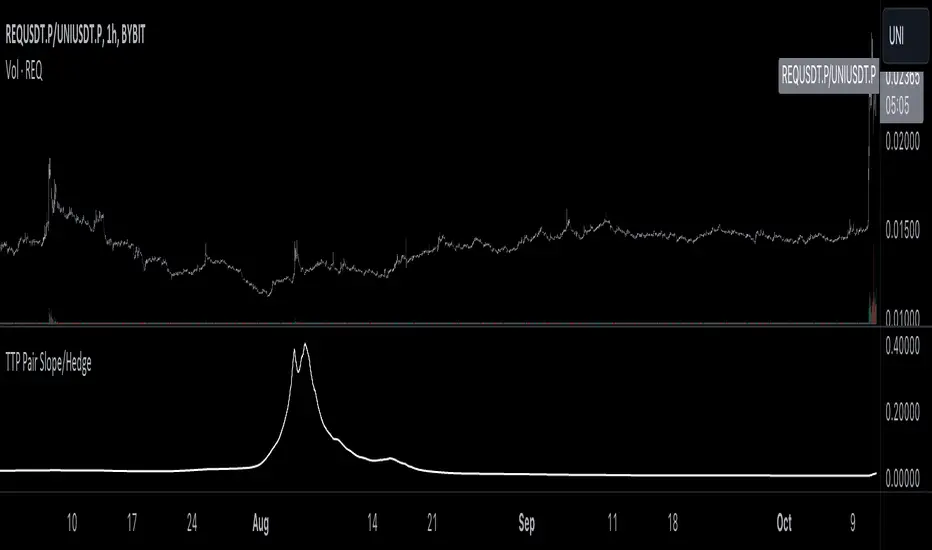
TTP Pair Slope/HedgePair slope/hedge uses linear regression to calculate the hedge ratio (slope) between the two assets within a period.
It allows you to specify a "from" and a "to" candle.
Example:
"A regression from 1000 candles back in time and ignore the last 100 candles. This would result in making a regression of 900 candles in total."
The formula used to perform the regression with the assts X and Y is:
Hedge =
mean( (X-mean(X))^2 )
——————————————————
mean( (X-mean(X)) * (Y-mean(Y)) )
You can later use the hedge in a chart of X - Hedge * Y
(Confirm with 1 / hedge )
If the plot is stationary the period tested should look like stationary.
If you cross an imaginary horizontal line across all the values in the period used it should look like a flat channel with values crossing above and below the line.
The purpose of this indicator is to help finding the linear regression test used for conintegration analysis. Conintegration assets is one of the requirements to consider assets for pair and hedge trading.
Bollinger Pair TradeNYSE:MA-1.6*NYSE:V
Revision: 1
Author: @ozdemirtrading
Revision 2 Considerations :
- Simplify and clean up plotting
Disclaimer: This strategy is currently working on the 5M chart. Change the length input to accommodate your needs.
For the backtesting of more than 3 months, you may need to upgrade your membership.
Description:
The general idea of the strategy is very straightforward: it takes positions according to the lower and upper Bollinger bands.
But I am mainly using this strategy for pair trading stocks. Do not forget that you will get better results if you trade with cointegrated pairs.
Bollinger band: Moving average & standard deviation are calculated based on 20 bars on the 1H chart (approx 240 bars on a 5m chart). X-day moving averages (20 days as default) are also used in the background in some of the exit strategy choices.
You can define position entry levels as the multipliers of standard deviation (for exp: mult2 as 2 * standard deviation).
There are 4 choices for the exit strategy:
SMA: Exit when touches simple moving average (SMA)
SKP: Skip SMA and do not stop if moving towards 20D SMA, and exit if it touches the other side of the band
SKPXDSMA: Skip SMA if moving towards 20D SMA, and exit if it touches 20D SMA
NoExit: Exit if it touches the upper & lower band only.
Options:
- Strategy hard stop: if trade loss reaches a point defined as a percent of the initial capital. Stop taking new positions. (not recommended for pair trade)
- Loss per trade: close position if the loss is at a defined level but keeps watching for new positions.
- Enable expected profit for trade (expected profit is calculated as the distance to SMA) (recommended for pair trade)
- Enable VIX threshold for the following options: (recommended for volatile periods)
- Stop trading if VIX for the previous day closes above the threshold
- Reverse active trade direction if VIX for the previous day is above the threshold
- Take reverse positions (assuming the Bollinger band is going to expand) for all trades
Backtesting:
Close positions after a defined interval: mark this if you want the close the final trade for backtesting purposes. Unmark it to get live signals.
Use custom interval: Backtest specific time periods.
Other Options:
- Use EMA: use an exponential moving average for the calculations instead of simple moving average
- Not against XDSMA: do not take a position against 20D SMA (if X is selected as 20) (recommended for pairs with a clear trend)
- Not in XDSMA 1 DEV: do not take a position in 20D SMA 1*standart deviation band (recommended if you need to decrease # of trades and increase profit for trade)
- Not in XDSMA 2 DEV: do not take a position in 20D SMA 2*standart deviation band
Session management:
- Not in session: Session start and end times can be defined here. If you do not want to trade in certain time intervals, mark that session.(helps to reduce slippage and get more realistic backtest results)

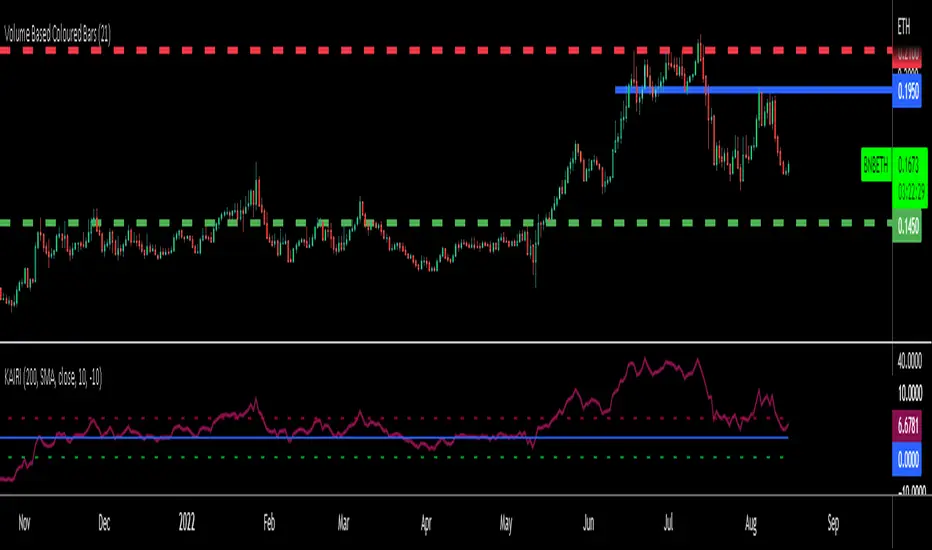
KAIRI RELATIVE INDEXAn old but gold Japanese indicator for Mean Reverting strategies and ideal for Pairs Trading...
The Kairi Relative Index measures the distance between closing prices and a Moving Average in percent value (generally SMA).
Extreme reading in the KRI are considered buy and sell signals.
Extreme readings will vary by asset, with more volatile assets reaching much higher and lower extremes that more sedate assets.
The KRI is not an accurate timing signal, and therefore, should be combined with other forms of analysis to generate trade signals.
You can calculate percent difference between the price and 10 different types of Moving Averages in this version of KAIRI as:
SMA : Simple Moving Average
EMA : Exponential Moving Average
WMA : Weighted Moving Average
TMA : Triangular Moving Average
VAR : Variable Index Dynamic Moving Average a.k.a. VIDYA
WWMA : Welles Wilder's Moving Average
ZLEMA : Zero Lag Exponential Moving Average
TSF : True Strength Force
HULL : Hull Moving Average
VWMA: Volume Veighted Moving Average
Personal advice: try using bigger length of Moving Averages like 50-100-200 for pairs and mean reversion strategies
Pairs Trading (basic OLS regression)Pairs trading using hedge ratio.
Firstly, it calculates hedge ration using OLS linear regression.
Then it calculates spread and z-score of spread.
if spread in specific range (which it's possible to change in settings) it makes Long/Short orders.
The very basic script.

RW Simple Pairs TradeA Simple Implementation of a Pairs Trading Strategy
It uses a simple moving average of specified length (default = 20) and enters at cutoffs set by Entry ZScore. Trades are exited at the moving average.
It is intended to be run on pairs of stocks. To Spread KO and PEP, for example, use the ticker KO / PEP * 1000
To visualise the trade better add Bollinger bands to your charts, corresponding to the SMA length and Entry ZScore criteria you specified.
